Analysis Summary
Notes:
- 1) No attempt has been made to eliminate the non-significant decimal places.
- 2) This batgrbproduct analysis is done using the HEASARC data.
- 3) This batgrbproduct analysis is using the flight position for the mask-weighting calculation.
======================================================================
                  BAT GRB EVENT DATA PROCESSING REPORT
    Process Script Ver: batgrbproduct v2.48
    Process Start Time: Mon Oct 24 00:05:24 EDT 2022
             Host Name: batproc1
   Current Working Dir: /local/data/bat1/alien/Swift_3rdBATcatalog/event/batevent_reproc/trigger1090472
======================================================================

  Trigger: 01090472      Segment: 000

  BAT Trigger Time: 661812549.12   [s; MET]
      Trigger Stop: 661812550.144   [s; MET]
               UTC: 2021-12-21T20:48:40.822240    [includes UTCF correction]
       Where From?: TDRSS position message

  BAT
    RA: 78.9375331088164   Dec: 0.940451696142954  [deg; J2000]

     Catalogged Source?: NO
     Point Source?:      YES
     GRB Indicated?:     YES    [ by BAT flight software ]
     Image S/N Ratio:    7.09
     Image Trigger?:     NO
     Rate S/N Ratio:     13.8924439894498  [ if not an image trigger ]
     Image S/N Ratio:    7.09

  Analysis Position:   [ source = BAT ]
    RA: 78.9375331088164   Dec: 0.940451696142954  [deg; J2000]

  Refined Position:   [ source = BAT pre-slew burst ]
    RA: 78.8905711977677   Dec: 0.912781942964853  [deg; J2000]
        { 05h 15m 33.7s , +00d 54' 46.0" }
         +/- 1.85869471524444 [arcmin] (estimated 90% radius based on SNR)
         +/- 0.62047215020939 [arcmin] (formal 1-sigma fit error)
    SNR: 12.5468709535705

  Angular difference between the analysis and refined position is 3.270115 arcmin

  Partial Coding Fraction: 0.9765625    [ including projection effects ]

  Duration
     T90: 136.527999997139 +/- 13.8882079356101
        Measured from: -118.44000005722
                   to: 18.0879999399185     [s; relative to TRIGTIME]
     T50: 75.1679999828339 +/- 17.7403274329958
        Measured from: -71.444000005722
                   to: 3.72399997711182     [s; relative to TRIGTIME]


  Fluence
     Peak Flux  (peak 1 second)
        Measured from: 0.235999941825867
                   to: 1.23599994182587     [s; relative to TRIGTIME]
     Total Fluence
        Measured from: -129.340000033379
                   to: 26.3559999465942     [s; relative to TRIGTIME]

             Band 1     Band 2     Band 3     Band 4
              15-25      25-50     50-100    100-350     keV
 Total     0.585194   1.088090   0.802745   0.274289
           0.080889   0.084281   0.076096   0.074293 [error]
 Peak      0.020461   0.049291   0.039249   0.017263
           0.006747   0.007685   0.006819   0.006302 [error]

     [ fluence units of on-axis counts / fully illuminated detector ]

======================================================================


====== Table of the duration information =============================

        Value   tstart    tstop
T100  155.696 -129.340   26.356
T90   136.528 -118.440   18.088
T50    75.168  -71.444    3.724
Peak    1.000    0.236    1.236


====== Spectral Analysis Summary =====================================

Model      : spectral model: simple power-law (PL) and cutoff power-law (CPL)
Ph_index   : photon index: E^{Ph_index}
Ph_90err   : 90% error of the photon index
Epeak      : Epeak in keV
Epeak_90err: 90% error of Epeak
Norm       : normalization at 50 keV in both the PL model and CPL model
Nomr_90err : 90% error of the normalization
chi2       : Chi-Squared
dof        : degree of freedo

=== Time-averaged spectral analysis ===
(Best model with acceptable fit: N/A)

Model Ph_index Ph_90err_low Ph_90err_hi  Epeak  Epeak_90err_low  Epeak_90err_hi  Norm       Nomr_90err_low    Norm_90err_hi    chi2    dof
PL      -1.276    -0.155      0.156       -           -               -         1.12e-03     -1.02e-04          1.02e-04      51.380   57
CPL     -0.438    -0.698      0.846       91.146     -24.469       185.422      3.00e-03     -1.66e-03          4.97e-03      47.060   56


=== 1-s peak spectral analysis ===
(Best model with acceptable fit: N/A)

Model Ph_index Ph_90err_low Ph_90err_hi  Epeak  Epeak_90err_low  Epeak_90err_hi  Norm       Nomr_90err_low    Norm_90err_hi    chi2    dof
PL      -1.149     -0.287     0.295       -           -               -         7.78e-03     -1.38e-03          1.38e-03      59.810   57
CPL     -0.189     -1.075     1.604       92.982     -34.290       -92.982      2.42e-02     -2.42e-02          1.37e-01      57.800   56


=== Fluence/Peak Flux Summary ===

              Model    Band1     Band2     Band3     Band4     Band5     Total
                       15-25     25-50    50-100    100-350    15-150    15-350    keV
Fluence         PL   1.80e-07  3.80e-07  6.27e-07  2.35e-06  1.73e-06  3.53e-06   erg/cm2
      90%_error_low -2.82e-08 -3.73e-08 -7.22e-08 -5.35e-07 -1.79e-07 -5.95e-07   erg/cm2
      90%_error_hi   2.94e-08  3.70e-08  7.20e-08  6.39e-07  1.82e-07  6.84e-07   erg/cm2
Peak flux       PL   2.29e-01  2.84e-01  2.56e-01  4.01e-01  9.07e-01  1.17e+00   ph/cm2/s
      90%_error_low -6.91e-02 -5.71e-02 -5.33e-02 -1.47e-01 -1.62e-01 -2.23e-01   ph/cm2/s
      90%_error_hi   7.53e-02  5.61e-02  5.28e-02  1.95e-01  1.62e-01  2.34e-01   ph/cm2/s

Fluence        CPL   1.58e-07  4.14e-07  6.49e-07  7.24e-07  1.59e-06  1.95e-06   erg/cm2
      90%_error_low -3.39e-08 -4.74e-08 -8.11e-08    N/A    -1.90e-07 -4.59e-07   erg/cm2
      90%_error_hi   3.46e-08  4.94e-08  8.13e-08    N/A     2.14e-07  1.12e-06   erg/cm2
Peak flux      CPL   1.96e-01  3.13e-01  2.74e-01  1.44e-01  8.76e-01  9.27e-01   ph/cm2/s
      90%_error_low -7.87e-02 -6.90e-02 -6.16e-02 -1.44e-01 -1.67e-01 -2.02e-01   ph/cm2/s
      90%_error_hi   8.49e-02  7.46e-02  6.28e-02  3.29e-01  1.67e-01  3.54e-01   ph/cm2/s

======================================================================
Image
Pre-slew 15.0-350.0 keV image (Event data)
#   RAcent    DECcent   POSerr    Theta     Phi              Peak Cts       SNR   Name
   78.8906     0.9128   0.0153     7.1543    72.9221         2.8357197     12.547 TRIG_01090472

Foreground time interval of the image:
-129.340  15.181 (delta_t = 144.521 [sec])
Background time interval of the image:
-239.120 -129.340 (delta_t = 109.780 [sec])
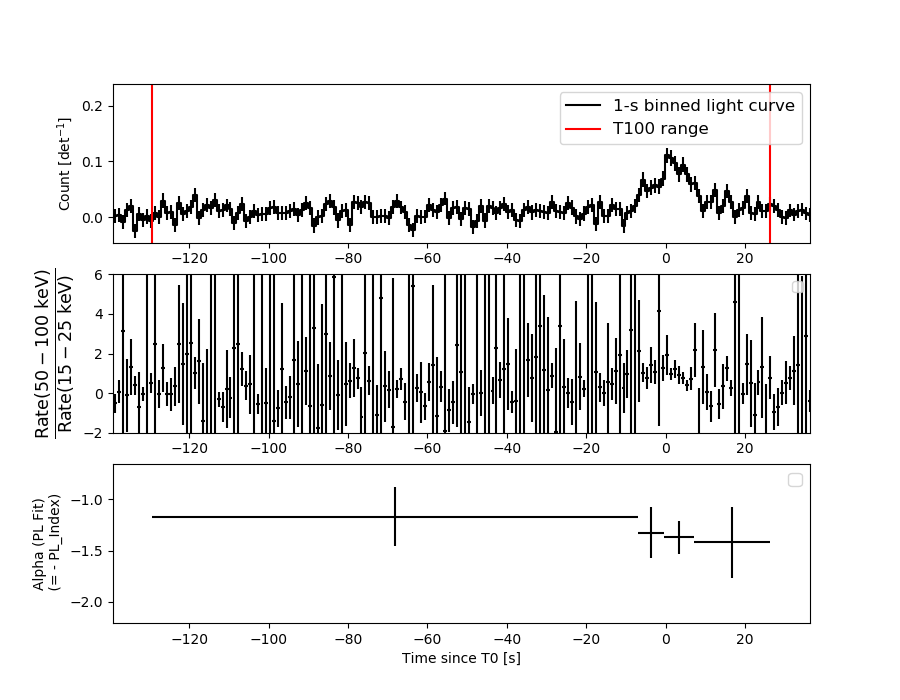
Light Curves
Note: The mask-weighted lightcurves have units of either count/det or counts/sec/det, where a det is 0.4 x 0.4 = 0.16 sq cm.
Full-time range; 1 s binning
Other quick-look light curves:
- 64 ms binning (zoomed)
- 16 ms binning (zoomed)
- 8 ms binning (zoomed)
- 2 ms binning (zoomed)
- SN=5 or 10 s binning (full-time range)
- Raw light curve
Spectra
- 64 ms binning (zoomed)
- 16 ms binning (zoomed)
- 8 ms binning (zoomed)
- 2 ms binning (zoomed)
- SN=5 or 10 s binning (full-time range)
- Raw light curve
Spectra
Notes:
- 1) The fitting includes the systematic errors.
- 2) When the burst includes telescope slew time periods, the fitting uses an average response file made from multiple 5-s response files through out the slew time plus single time preiod for the non-slew times, and weighted by the total counts in the corresponding time period using addrmf. An average response file is needed becuase a spectral fit using the pre-slew DRM will introduce some errors in both a spectral shape and a normalization if the PHA file contains a lot of the slew/post-slew time interval.
- 3) For fits to more complicated models (e.g. a power-law over a cutoff power-law), the BAT team has decided to require a chi-square improvement of more than 6 for each extra dof.
Time averaged spectrum fit using the average DRM
Power-law model
Time interval is from -129.340 sec. to   26.356 sec.

Spectral model in power-law:
------------------------------------------------------------
Parameters  : value       lower 90%   higher 90%
Photon index: -1.27647     ( -0.155253   0.156383 )
Norm@50keV  : 1.11758E-03    ( -0.000102293   0.000102133 )
------------------------------------------------------------
#Fit statistic  : Chi-Squared                   51.38     using 59 bins.
 Reduced chi-squared = 0.901404
# Null hypothesis probability of 6.85e-01 with 57 degrees of freedom

Photon flux (15-150 keV)    in 155.7 sec: 0.132771 ( -0.012168  0.012179 ) ph/cm2/s
Energy fluence (15-150 keV)             : 1.72981e-06 ( -1.7918e-07  1.81532e-07 ) ergs/cm2
Cutoff power-law model
Time interval is from -129.340 sec. to   26.356 sec.
Spectral model in the cutoff power-law:
------------------------------------------------------------
Parameters  : value       lower 90%   higher 90%
Photon index: -0.438363     ( -0.697526   0.845839 )
Epeak [keV] : 91.1456      ( -24.4686 185.423 )
Norm@50keV  : 2.99960E-03    ( -0.00165692   0.00496774 )
------------------------------------------------------------
#Fit statistic  : Chi-Squared                   47.06     using 59 bins.
 Reduced chi-squared = 0.840357
# Null hypothesis probability of 7.97e-01 with 56 degrees of freedom

Photon flux (15-150 keV)    in 155.7 sec: 0.127684 ( -0.012992  0.012923 ) ph/cm2/s
Energy fluence (15-150 keV)             : 1.59312e-06 ( -1.90281e-07  2.13838e-07 ) ergs/cm2
1-s peak spectrum fit
Power-law model
Time interval is from    0.236 sec. to    1.236 sec.

Spectral model in power-law:
------------------------------------------------------------
Parameters  : value       lower 90%   higher 90%
Photon index: -1.1492     ( -0.286969   0.294944 )
Norm@50keV  : 7.77692E-03    ( -0.00137978   0.00137884 )
------------------------------------------------------------
#Fit statistic  : Chi-Squared                   59.81     using 59 bins.
 Reduced chi-squared = 1.0493
# Null hypothesis probability of 3.74e-01 with 57 degrees of freedom

Photon flux (15-150 keV)    in 1 sec: 0.906869 ( -0.161894  0.162081 ) ph/cm2/s
Energy fluence (15-150 keV)             : 8.00848e-08 ( -1.59786e-08  1.62826e-08 ) ergs/cm2
Cutoff power-law model
Time interval is from    0.236 sec. to    1.236 sec.
Spectral model in the cutoff power-law:
------------------------------------------------------------
Parameters  : value       lower 90%   higher 90%
Photon index: -0.188996     ( -1.0746   1.60467 )
Epeak [keV] : 92.9824      ( -34.3026 -92.9952 )
Norm@50keV  : 2.41538E-02    ( -0.0241453   0.136535 )
------------------------------------------------------------
#Fit statistic  : Chi-Squared                   57.80     using 59 bins.
 Reduced chi-squared = 1.03214
# Null hypothesis probability of 4.09e-01 with 56 degrees of freedom

Photon flux (15-150 keV)    in 1 sec: 0.876004 ( -0.166702  0.166596 ) ph/cm2/s
Energy fluence (15-150 keV)             : 7.33398e-08 ( -1.81537e-08  1.8392e-08 ) ergs/cm2
Time-resolved spectra
Distribution
T90 vs. Hardness ratio plot
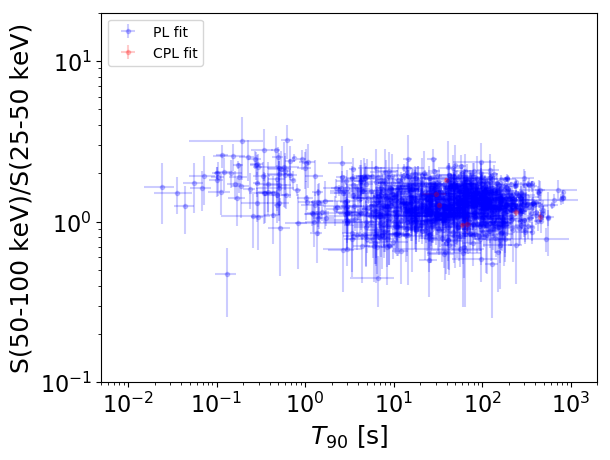
T90                                   = N/A sec.
Hardness ratio (energy fluence ratio) = N/A
S(15-50 keV) vs. S(50-150 keV) plot
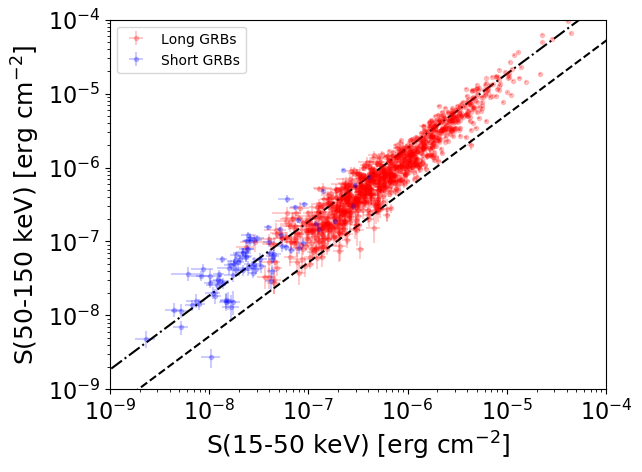
S(15-50 keV)  = N/A
S(50-150 keV) = N/A
The dash-dotted line and the dashed line traces the fluences calculated from the Band function with Epeak = 15 and 150 keV, respectively. Both lines assume a canonical values of alpha = -1 and beta = -2.5.
Mask shadow pattern
IMX = 3.686134579391920E-02, IMY = -1.199847013855260E-01
Spacecraft aspect plot
Bright source in the pre-burst/pre-slew/post-slew images
Pre-burst image of 15-350 keV band
Time interval of the image:
-239.120000 -129.340000

# RAcent  DECcent POSerr Theta    Phi  PeakCts   SNR AngSep     Name
#  [deg]    [deg]    ['] [deg]  [deg]                   [']
 83.6329  22.0285    0.8  28.8   72.0   3.7422  14.9    0.8	Crab
 63.7565 -40.4099    3.8  36.4 -103.0   1.1936   3.0 ------	UNKNOWN
 20.0287  -2.9450    2.0  57.1  -30.0   5.4847   5.7 ------	UNKNOWN
 88.8603 -53.2947    2.4  48.2 -129.7   4.1727   4.9 ------	UNKNOWN
Pre-slew background subtracted image of 15-350 keV band
Time interval of the image:
-129.340000 15.180590

# RAcent  DECcent POSerr Theta    Phi  PeakCts   SNR AngSep     Name
#  [deg]    [deg]    ['] [deg]  [deg]                   [']
 83.7327  21.9465    5.0  28.7   72.2   0.9021   2.3    6.9	Crab
 78.8906   0.9128    0.9   7.2   72.9   2.8357  12.6 ------	UNKNOWN
133.5027 -31.2078    2.3  58.2 -177.2   8.0872   5.0 ------	UNKNOWN
Post-slew image of 15-350 keV band
Time interval of the image:
42.980590 963.023700

# RAcent  DECcent POSerr Theta    Phi  PeakCts   SNR AngSep     Name
#  [deg]    [deg]    ['] [deg]  [deg]                   [']
 83.6339  22.0224    0.3  21.6   77.0  39.7659  33.7    0.5	Crab
114.0495   0.5421    2.6  35.1  155.4   6.4208   4.5 ------	UNKNOWN
 61.7803   0.6624    6.3  17.1  -25.7   1.5964   1.8 ------	UNKNOWN
126.7128 -34.7100    3.2  57.1 -161.4  14.7239   3.6 ------	UNKNOWN
123.7202 -40.4233    3.6  58.0 -154.2  16.7233   3.2 ------	UNKNOWN
114.3121 -44.5330    5.7  55.3 -145.1  13.0549   2.0 ------	UNKNOWN
 94.4920 -45.2549    3.1  48.2 -129.6  17.4754   3.7 ------	UNKNOWN
 98.6984 -45.6740    3.2  49.8 -133.0  17.4026   3.6 ------	UNKNOWN