Analysis Summary
Notes:
- 1) No attempt has been made to eliminate the non-significant decimal places.
- 2) This batgrbproduct analysis is done using the HEASARC data.
- 3) This batgrbproduct analysis is using the flight position for the mask-weighting calculation.
======================================================================
                  BAT GRB EVENT DATA PROCESSING REPORT
    Process Script Ver: batgrbproduct v2.48
    Process Start Time: Mon Oct 24 00:02:57 EDT 2022
             Host Name: batproc1
   Current Working Dir: /local/data/bat1/alien/Swift_3rdBATcatalog/event/batevent_reproc/trigger1090656
======================================================================

  Trigger: 01090656      Segment: 000

  BAT Trigger Time: 661962595.008   [s; MET]
      Trigger Stop: 661962596.032   [s; MET]
               UTC: 2021-12-23T14:29:26.700140    [includes UTCF correction]
       Where From?: TDRSS position message

  BAT
    RA: 227.163643811444   Dec: -26.8726512362331  [deg; J2000]

     Catalogged Source?: NO
     Point Source?:      YES
     GRB Indicated?:     YES    [ by BAT flight software ]
     Image S/N Ratio:    12.22
     Image Trigger?:     NO
     Rate S/N Ratio:     30.4466746952767  [ if not an image trigger ]
     Image S/N Ratio:    12.22

  Analysis Position:   [ source = BAT ]
    RA: 227.163643811444   Dec: -26.8726512362331  [deg; J2000]

  Refined Position:   [ source = BAT pre-slew burst ]
    RA: 227.169609149185   Dec: -26.88043584476  [deg; J2000]
        { 15h 08m 40.7s , -26d 52' 49.6" }
         +/- 1.10779445856886 [arcmin] (estimated 90% radius based on SNR)
         +/- 0.332360228519502 [arcmin] (formal 1-sigma fit error)
    SNR: 26.278783305112

  Angular difference between the analysis and refined position is 0.565762 arcmin

  Partial Coding Fraction: 0.328125    [ including projection effects ]

  Duration
     T90: 11.0759998559952 +/- 0.719077255401357
        Measured from: -2.75199997425079
                   to: 8.32399988174438     [s; relative to TRIGTIME]
     T50: 5.05599999427795 +/- 0.601225352052128
        Measured from: 0.131999969482422
                   to: 5.18799996376038     [s; relative to TRIGTIME]


  Fluence
     Peak Flux  (peak 1 second)
        Measured from: 0.299999952316284
                   to: 1.29999995231628     [s; relative to TRIGTIME]
     Total Fluence
        Measured from: -3.56000006198883
                   to: 9.05599999427795     [s; relative to TRIGTIME]

             Band 1     Band 2     Band 3     Band 4
              15-25      25-50     50-100    100-350     keV
 Total     0.628269   1.047816   1.082667   0.402071
           0.045756   0.050315   0.047012   0.037117 [error]
 Peak      0.074313   0.153926   0.140292   0.069080
           0.014097   0.015961   0.016022   0.011613 [error]

     [ fluence units of on-axis counts / fully illuminated detector ]

======================================================================


====== Table of the duration information =============================

        Value   tstart    tstop
T100   12.616   -3.560    9.056
T90    11.076   -2.752    8.324
T50     5.056    0.132    5.188
Peak    1.000    0.300    1.300


====== Spectral Analysis Summary =====================================

Model      : spectral model: simple power-law (PL) and cutoff power-law (CPL)
Ph_index   : photon index: E^{Ph_index}
Ph_90err   : 90% error of the photon index
Epeak      : Epeak in keV
Epeak_90err: 90% error of Epeak
Norm       : normalization at 50 keV in both the PL model and CPL model
Nomr_90err : 90% error of the normalization
chi2       : Chi-Squared
dof        : degree of freedo

=== Time-averaged spectral analysis ===
(Best model with acceptable fit: N/A)

Model Ph_index Ph_90err_low Ph_90err_hi  Epeak  Epeak_90err_low  Epeak_90err_hi  Norm       Nomr_90err_low    Norm_90err_hi    chi2    dof
PL      -1.144    -0.084      0.085       -           -               -         1.69e-02     -8.21e-04          8.20e-04      53.460   57
CPL     -0.866    -0.308      0.361      231.483     -99.304      -231.483      2.26e-02     -6.05e-03          9.95e-03      51.460   56


=== 1-s peak spectral analysis ===
(Best model with acceptable fit: N/A)

Model Ph_index Ph_90err_low Ph_90err_hi  Epeak  Epeak_90err_low  Epeak_90err_hi  Norm       Nomr_90err_low    Norm_90err_hi    chi2    dof
PL      -1.133     -0.194     0.197       -           -               -         2.75e-02     -3.20e-03          3.20e-03      69.770   57
CPL     -0.869     -0.433     0.871      234.502    -234.502      -234.502      3.67e-02     -1.48e-02          5.56e-02      69.420   56


=== Fluence/Peak Flux Summary ===

              Model    Band1     Band2     Band3     Band4     Band5     Total
                       15-25     25-50    50-100    100-350    15-150    15-350    keV
Fluence         PL   1.96e-07  4.47e-07  8.10e-07  3.48e-06  2.20e-06  4.93e-06   erg/cm2
      90%_error_low -1.88e-08 -2.61e-08 -4.41e-08 -4.12e-07 -1.14e-07 -4.37e-07   erg/cm2
      90%_error_hi   1.94e-08  2.59e-08  4.39e-08  4.49e-07  1.14e-07  4.69e-07   erg/cm2
Peak flux       PL   7.98e-01  9.99e-01  9.11e-01  1.45e+00  3.20e+00  4.16e+00   ph/cm2/s
      90%_error_low -1.71e-01 -1.38e-01 -1.20e-01 -3.63e-01 -3.81e-01 -5.13e-01   ph/cm2/s
      90%_error_hi   1.83e-01  1.36e-01  1.19e-01  4.31e-01  3.82e-01  5.24e-01   ph/cm2/s

Fluence        CPL   1.83e-07  4.57e-07  8.35e-07  2.42e-06  2.18e-06  3.89e-06   erg/cm2
      90%_error_low -2.36e-08 -2.86e-08 -5.31e-08 -8.20e-07 -1.20e-07 -8.14e-07   erg/cm2
      90%_error_hi   2.41e-08  2.91e-08  5.37e-08  1.05e-06  1.19e-07  1.17e-06   erg/cm2
Peak flux      CPL   7.55e-01  1.02e+00  9.42e-01  1.09e+00  3.18e+00  3.81e+00   ph/cm2/s
      90%_error_low -2.08e-01 -1.52e-01 -1.43e-01 -5.88e-01 -3.87e-01 -7.18e-01   ph/cm2/s
      90%_error_hi   1.10e-01  1.58e-01  1.51e-01  4.76e-01  3.87e-01  6.74e-01   ph/cm2/s

======================================================================
Image
Pre-slew 15.0-350.0 keV image (Event data)
#   RAcent    DECcent   POSerr    Theta     Phi              Peak Cts       SNR   Name
  227.1696   -26.8804   0.0073    33.2996   -82.3585         3.2216431     26.279 TRIG_01090656

Foreground time interval of the image:
 -3.560   9.056 (delta_t =  12.616 [sec])
Background time interval of the image:
-239.008  -3.560 (delta_t = 235.448 [sec])
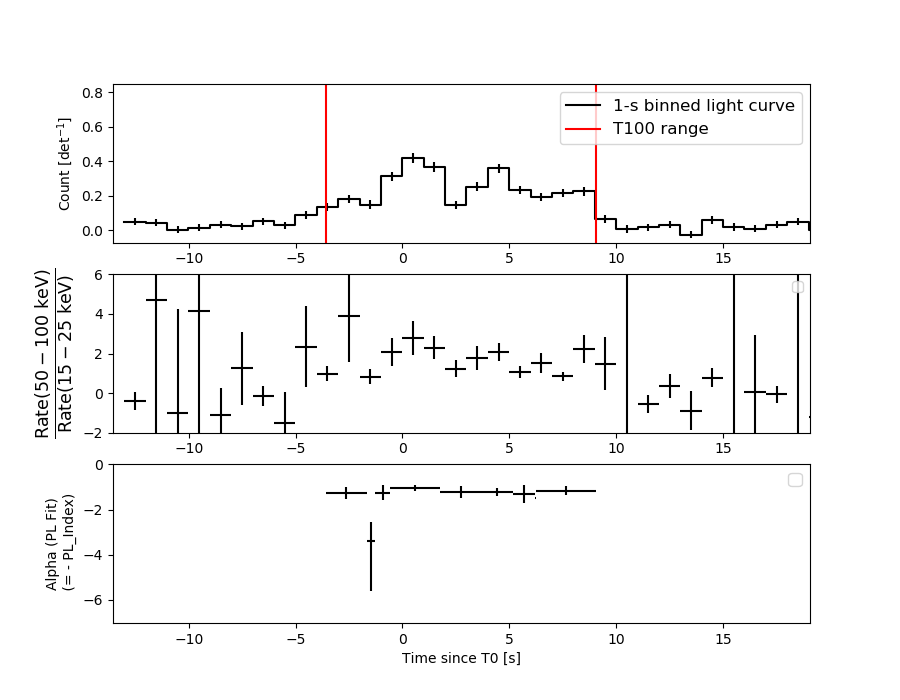
Light Curves
Note: The mask-weighted lightcurves have units of either count/det or counts/sec/det, where a det is 0.4 x 0.4 = 0.16 sq cm.
Full-time range; 1 s binning
Other quick-look light curves:
- 64 ms binning (zoomed)
- 16 ms binning (zoomed)
- 8 ms binning (zoomed)
- 2 ms binning (zoomed)
- SN=5 or 10 s binning (full-time range)
- Raw light curve
Spectra
- 64 ms binning (zoomed)
- 16 ms binning (zoomed)
- 8 ms binning (zoomed)
- 2 ms binning (zoomed)
- SN=5 or 10 s binning (full-time range)
- Raw light curve
Spectra
Notes:
- 1) The fitting includes the systematic errors.
- 2) When the burst includes telescope slew time periods, the fitting uses an average response file made from multiple 5-s response files through out the slew time plus single time preiod for the non-slew times, and weighted by the total counts in the corresponding time period using addrmf. An average response file is needed becuase a spectral fit using the pre-slew DRM will introduce some errors in both a spectral shape and a normalization if the PHA file contains a lot of the slew/post-slew time interval.
- 3) For fits to more complicated models (e.g. a power-law over a cutoff power-law), the BAT team has decided to require a chi-square improvement of more than 6 for each extra dof.
Time averaged spectrum fit using the average DRM
Power-law model
Time interval is from   -3.560 sec. to    9.056 sec.

Spectral model in power-law:
------------------------------------------------------------
Parameters  : value       lower 90%   higher 90%
Photon index: -1.1437     ( -0.0839039   0.0847821 )
Norm@50keV  : 1.69302E-02    ( -0.00082139   0.00082012 )
------------------------------------------------------------
#Fit statistic  : Chi-Squared                   53.46     using 59 bins.
 Reduced chi-squared = 0.937895
# Null hypothesis probability of 6.09e-01 with 57 degrees of freedom

Photon flux (15-150 keV)    in 12.62 sec: 1.97295 ( -0.09998  0.10015 ) ph/cm2/s
Energy fluence (15-150 keV)             : 2.20394e-06 ( -1.13641e-07  1.13874e-07 ) ergs/cm2
Cutoff power-law model
Time interval is from   -3.560 sec. to    9.056 sec.
Spectral model in the cutoff power-law:
------------------------------------------------------------
Parameters  : value       lower 90%   higher 90%
Photon index: -0.865645     ( -0.307959   0.360868 )
Epeak [keV] : 231.483      ( -99.3116 -231.49 )
Norm@50keV  : 2.26250E-02    ( -0.00604496   0.00995063 )
------------------------------------------------------------
#Fit statistic  : Chi-Squared                   51.46     using 59 bins.
 Reduced chi-squared = 0.918929
# Null hypothesis probability of 6.47e-01 with 56 degrees of freedom

Photon flux (15-150 keV)    in 12.62 sec: 1.94990 ( -0.10367  0.10376 ) ph/cm2/s
Energy fluence (15-150 keV)             : 2.176e-06 ( -1.20069e-07  1.19402e-07 ) ergs/cm2
1-s peak spectrum fit
Power-law model
Time interval is from    0.300 sec. to    1.300 sec.

Spectral model in power-law:
------------------------------------------------------------
Parameters  : value       lower 90%   higher 90%
Photon index: -1.13331     ( -0.193656   0.196817 )
Norm@50keV  : 2.75246E-02    ( -0.00319808   0.00319634 )
------------------------------------------------------------
#Fit statistic  : Chi-Squared                   69.77     using 59 bins.
 Reduced chi-squared = 1.22404
# Null hypothesis probability of 1.19e-01 with 57 degrees of freedom

Photon flux (15-150 keV)    in 1 sec: 3.20377 ( -0.38118  0.3817 ) ph/cm2/s
Energy fluence (15-150 keV)             : 2.8482e-07 ( -3.63809e-08  3.65757e-08 ) ergs/cm2
Cutoff power-law model
Time interval is from    0.300 sec. to    1.300 sec.
Spectral model in the cutoff power-law:
------------------------------------------------------------
Parameters  : value       lower 90%   higher 90%
Photon index: -0.86947     ( -0.43288   0.871465 )
Epeak [keV] : 234.502      ( -234.516 -234.516 )
Norm@50keV  : 3.67427E-02    ( -0.014785   0.0556096 )
------------------------------------------------------------
#Fit statistic  : Chi-Squared                   69.42     using 59 bins.
 Reduced chi-squared = 1.23964
# Null hypothesis probability of 1.07e-01 with 56 degrees of freedom

Photon flux (15-150 keV)    in 1 sec: 3.18184 ( -0.38669  0.38675 ) ph/cm2/s
Energy fluence (15-150 keV)             : 2.81443e-07 ( -3.85919e-08  3.79387e-08 ) ergs/cm2
Time-resolved spectra
Distribution
T90 vs. Hardness ratio plot
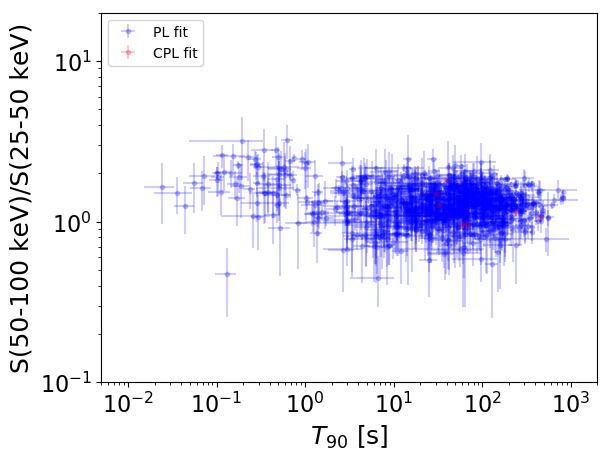
T90                                   = N/A sec.
Hardness ratio (energy fluence ratio) = N/A
S(15-50 keV) vs. S(50-150 keV) plot
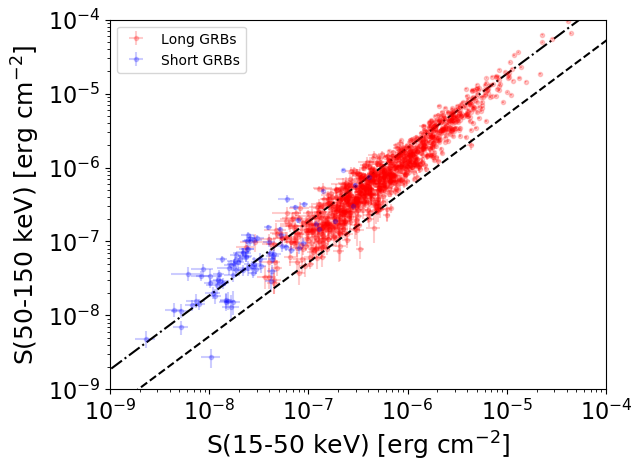
S(15-50 keV)  = N/A
S(50-150 keV) = N/A
The dash-dotted line and the dashed line traces the fluences calculated from the Band function with Epeak = 15 and 150 keV, respectively. Both lines assume a canonical values of alpha = -1 and beta = -2.5.
Mask shadow pattern
IMX = 8.734597730554834E-02, IMY = 6.510334254058794E-01
Spacecraft aspect plot
Bright source in the pre-burst/pre-slew/post-slew images
Pre-burst image of 15-350 keV band
Time interval of the image:
-239.008000 -3.560000

# RAcent  DECcent POSerr Theta    Phi  PeakCts   SNR AngSep     Name
#  [deg]    [deg]    ['] [deg]  [deg]                   [']
170.3153 -60.6227   14.0  53.7  -10.5   0.5629   0.8    0.0	Cen X-3
186.3062 -62.8432   59.1  52.8  -20.3  -0.1594  -0.2   10.6	GX 301-2
213.3802  39.6967    2.7  52.7  170.4   3.8408   4.4 ------	UNKNOWN
225.7944  19.6856    2.6  41.9 -162.2   1.8869   4.4 ------	UNKNOWN
238.2034 -18.7713    3.0  41.2  -99.5   4.4935   3.8 ------	UNKNOWN
Pre-slew background subtracted image of 15-350 keV band
Time interval of the image:
-3.560000 9.056000

# RAcent  DECcent POSerr Theta    Phi  PeakCts   SNR AngSep     Name
#  [deg]    [deg]    ['] [deg]  [deg]                   [']
170.3371 -60.6221    9.3  53.7  -10.5  -0.1911  -1.2    0.6	Cen X-3
186.4472 -62.7552    6.6  52.7  -20.4  -0.3188  -1.8    5.8	GX 301-2
189.7591  34.6022    3.0  45.6  146.3   0.6057   3.8 ------	UNKNOWN
151.2239 -39.8315    2.4  49.5   19.7   0.6119   4.8 ------	UNKNOWN
166.3104 -59.3483    2.3  53.8   -7.6   0.7697   5.0 ------	UNKNOWN
227.1696 -26.8804    0.4  33.3  -82.4   3.2218  26.3 ------	UNKNOWN
Post-slew image of 15-350 keV band
Time interval of the image:
774.092610 963.122000

# RAcent  DECcent POSerr Theta    Phi  PeakCts   SNR AngSep     Name
#  [deg]    [deg]    ['] [deg]  [deg]                   [']
244.9757 -15.6413    0.4  34.9  -88.0  18.8103  29.0    0.2	Sco X-1
254.5368  35.2599   50.1  48.1 -168.3  -0.1312  -0.2    6.3	Her X-1
167.3040 -11.6461    4.5  50.2   39.6   3.7069   2.6 ------	UNKNOWN
239.8314  40.3599    4.0  42.9  175.5   1.3876   2.9 ------	UNKNOWN
263.9380  43.6188    3.3  58.6 -172.6   5.5565   3.5 ------	UNKNOWN