Analysis Summary
Notes:
- 1) No attempt has been made to eliminate the non-significant decimal places.
- 2) This batgrbproduct analysis is done using the HEASARC data.
- 3) This batgrbproduct analysis is using the flight position for the mask-weighting calculation.
======================================================================
                  BAT GRB EVENT DATA PROCESSING REPORT
    Process Script Ver: batgrbproduct v2.48
    Process Start Time: Sun Oct 23 23:58:32 EDT 2022
             Host Name: batproc1
   Current Working Dir: /local/data/bat1/alien/Swift_3rdBATcatalog/event/batevent_reproc/trigger1090853
======================================================================

  Trigger: 01090853      Segment: 000

  BAT Trigger Time: 662130767.424   [s; MET]
      Trigger Stop: 662130771.52   [s; MET]
               UTC: 2021-12-25T13:12:19.104820    [includes UTCF correction]
       Where From?: TDRSS position message

  BAT
    RA: 258.568373830299   Dec: 17.2625625868679  [deg; J2000]

     Catalogged Source?: NO
     Point Source?:      YES
     GRB Indicated?:     YES    [ by BAT flight software ]
     Image S/N Ratio:    9.17
     Image Trigger?:     NO
     Rate S/N Ratio:     13.7840487520902  [ if not an image trigger ]
     Image S/N Ratio:    9.17

  Analysis Position:   [ source = BAT ]
    RA: 258.568373830299   Dec: 17.2625625868679  [deg; J2000]

  Refined Position:   [ source = BAT pre-slew burst ]
    RA: 258.545136051457   Dec: 17.2768509449536  [deg; J2000]
        { 17h 14m 10.8s , +17d 16' 36.7" }
         +/- 0.514878835700222 [arcmin] (estimated 90% radius based on SNR)
         +/- 0.128342795339958 [arcmin] (formal 1-sigma fit error)
    SNR: 78.5178361229359

  Angular difference between the analysis and refined position is 1.583546 arcmin

  Partial Coding Fraction: 1.015625    [ including projection effects ]

  Duration
     T90: 121.519999980927 +/- 2.9694658728837
        Measured from: 4.61199998855591
                   to: 126.131999969482     [s; relative to TRIGTIME]
     T50: 27.8359999656677 +/- 0.81073800487038
        Measured from: 48.2559999227524
                   to: 76.0919998884201     [s; relative to TRIGTIME]


  Fluence
     Peak Flux  (peak 1 second)
        Measured from: 50.1879999637604
                   to: 51.1879999637604     [s; relative to TRIGTIME]
     Total Fluence
        Measured from: -24.7760000228882
                   to: 139.815999984741     [s; relative to TRIGTIME]

             Band 1     Band 2     Band 3     Band 4
              15-25      25-50     50-100    100-350     keV
 Total     7.685955   9.997282   7.152638   1.496354
           0.101471   0.104583   0.091258   0.071521 [error]
 Peak      0.185817   0.291992   0.256508   0.053879
           0.009556   0.010872   0.010552   0.006634 [error]

     [ fluence units of on-axis counts / fully illuminated detector ]

======================================================================


====== Table of the duration information =============================

        Value   tstart    tstop
T100  164.592  -24.776  139.816
T90   121.520    4.612  126.132
T50    27.836   48.256   76.092
Peak    1.000   50.188   51.188


====== Spectral Analysis Summary =====================================

Model      : spectral model: simple power-law (PL) and cutoff power-law (CPL)
Ph_index   : photon index: E^{Ph_index}
Ph_90err   : 90% error of the photon index
Epeak      : Epeak in keV
Epeak_90err: 90% error of Epeak
Norm       : normalization at 50 keV in both the PL model and CPL model
Nomr_90err : 90% error of the normalization
chi2       : Chi-Squared
dof        : degree of freedo

=== Time-averaged spectral analysis ===
(Best model with acceptable fit: N/A)

Model Ph_index Ph_90err_low Ph_90err_hi  Epeak  Epeak_90err_low  Epeak_90err_hi  Norm       Nomr_90err_low    Norm_90err_hi    chi2    dof
PL      -1.599    -0.033      0.033       -           -               -         1.01e-02     -1.72e-04          1.72e-04      62.800   57
CPL     -1.320    -0.138      0.142      139.775     -28.259        76.988      1.34e-02     -1.68e-03          1.98e-03      50.610   56


=== 1-s peak spectral analysis ===
(Best model with acceptable fit: N/A)

Model Ph_index Ph_90err_low Ph_90err_hi  Epeak  Epeak_90err_low  Epeak_90err_hi  Norm       Nomr_90err_low    Norm_90err_hi    chi2    dof
PL      -1.331     -0.072     0.072       -           -               -         5.08e-02     -2.18e-03          2.18e-03      72.330   57
CPL     -0.611     -0.306     0.329      102.451     -17.129        36.791      1.13e-01     -3.15e-02          4.78e-02      54.600   56


=== Fluence/Peak Flux Summary ===

              Model    Band1     Band2     Band3     Band4     Band5     Total
                       15-25     25-50    50-100    100-350    15-150    15-350    keV
Fluence         PL   2.33e-06  4.03e-06  5.32e-06  1.43e-05  1.56e-05  2.60e-05   erg/cm2
      90%_error_low -8.48e-08 -8.48e-08 -1.06e-07 -6.59e-07 -2.66e-07 -7.00e-07   erg/cm2
      90%_error_hi   8.62e-08  8.46e-08  1.06e-07  6.80e-07  2.66e-07  7.15e-07   erg/cm2
Peak flux       PL   1.78e+00  1.98e+00  1.57e+00  2.07e+00  6.10e+00  7.40e+00   ph/cm2/s
      90%_error_low -1.34e-01 -9.35e-02 -8.15e-02 -2.12e-01 -2.64e-01 -3.28e-01   ph/cm2/s
      90%_error_hi   1.37e-01  9.31e-02  8.11e-02  2.27e-01  2.65e-01  3.29e-01   ph/cm2/s

Fluence        CPL   2.15e-06  4.07e-06  5.45e-06  1.03e-05  1.53e-05  2.20e-05   erg/cm2
      90%_error_low -1.16e-07 -8.82e-08 -1.23e-07 -1.46e-06 -2.98e-07 -1.49e-06   erg/cm2
      90%_error_hi   1.18e-07  8.84e-08  1.24e-07  1.77e-06  2.97e-07  1.79e-06   erg/cm2
Peak flux      CPL   1.52e+00  2.09e+00  1.69e+00  1.05e+00  5.92e+00  6.35e+00   ph/cm2/s
      90%_error_low -1.64e-01 -1.08e-01 -9.71e-02 -2.48e-01 -2.75e-01 -3.78e-01   ph/cm2/s
      90%_error_hi   1.68e-01  1.09e-01  9.83e-02  3.32e-01  2.75e-01  4.23e-01   ph/cm2/s

======================================================================
Image
Pre-slew 15.0-350.0 keV image (Event data)
#   RAcent    DECcent   POSerr    Theta     Phi              Peak Cts       SNR   Name
  258.5451    17.2769   0.0024     4.0668  -113.4534        19.4940108     78.518 TRIG_01090853

Foreground time interval of the image:
-24.776  74.277 (delta_t =  99.053 [sec])
Background time interval of the image:
-239.424 -24.776 (delta_t = 214.648 [sec])
Light Curves
Note: The mask-weighted lightcurves have units of either count/det or counts/sec/det, where a det is 0.4 x 0.4 = 0.16 sq cm.
Full-time range; 1 s binning
Other quick-look light curves:
- 64 ms binning (zoomed)
- 16 ms binning (zoomed)
- 8 ms binning (zoomed)
- 2 ms binning (zoomed)
- SN=5 or 10 s binning (full-time range)
- Raw light curve
Spectra
- 64 ms binning (zoomed)
- 16 ms binning (zoomed)
- 8 ms binning (zoomed)
- 2 ms binning (zoomed)
- SN=5 or 10 s binning (full-time range)
- Raw light curve
Spectra
Notes:
- 1) The fitting includes the systematic errors.
- 2) When the burst includes telescope slew time periods, the fitting uses an average response file made from multiple 5-s response files through out the slew time plus single time preiod for the non-slew times, and weighted by the total counts in the corresponding time period using addrmf. An average response file is needed becuase a spectral fit using the pre-slew DRM will introduce some errors in both a spectral shape and a normalization if the PHA file contains a lot of the slew/post-slew time interval.
- 3) For fits to more complicated models (e.g. a power-law over a cutoff power-law), the BAT team has decided to require a chi-square improvement of more than 6 for each extra dof.
Time averaged spectrum fit using the average DRM
Power-law model
Time interval is from  -24.776 sec. to  139.816 sec.

Spectral model in power-law:
------------------------------------------------------------
Parameters  : value       lower 90%   higher 90%
Photon index: -1.59937     ( -0.032958   0.0329704 )
Norm@50keV  : 1.01026E-02    ( -0.000171658   0.000171632 )
------------------------------------------------------------
#Fit statistic  : Chi-Squared                   62.80     using 59 bins.
 Reduced chi-squared = 1.10175
# Null hypothesis probability of 2.78e-01 with 57 degrees of freedom

Photon flux (15-150 keV)    in 164.6 sec: 1.29802 ( -0.02669  0.02681 ) ph/cm2/s
Energy fluence (15-150 keV)             : 1.5555e-05 ( -2.65971e-07  2.65854e-07 ) ergs/cm2
Cutoff power-law model
Time interval is from  -24.776 sec. to  139.816 sec.
Spectral model in the cutoff power-law:
------------------------------------------------------------
Parameters  : value       lower 90%   higher 90%
Photon index: -1.32031     ( -0.137782   0.141794 )
Epeak [keV] : 139.775      ( -28.2586 76.9879 )
Norm@50keV  : 1.33576E-02    ( -0.00168251   0.00198321 )
------------------------------------------------------------
#Fit statistic  : Chi-Squared                   50.61     using 59 bins.
 Reduced chi-squared = 0.90375
# Null hypothesis probability of 6.78e-01 with 56 degrees of freedom

Photon flux (15-150 keV)    in 164.6 sec: 1.26382 ( -0.0308  0.03105 ) ph/cm2/s
Energy fluence (15-150 keV)             : 1.52781e-05 ( -2.98191e-07  2.97299e-07 ) ergs/cm2
1-s peak spectrum fit
Power-law model
Time interval is from   50.188 sec. to   51.188 sec.

Spectral model in power-law:
------------------------------------------------------------
Parameters  : value       lower 90%   higher 90%
Photon index: -1.33133     ( -0.0719705   0.071686 )
Norm@50keV  : 5.08271E-02    ( -0.00217725   0.00217589 )
------------------------------------------------------------
#Fit statistic  : Chi-Squared                   72.33     using 59 bins.
 Reduced chi-squared = 1.26895
# Null hypothesis probability of 8.30e-02 with 57 degrees of freedom

Photon flux (15-150 keV)    in 1 sec: 6.10028 ( -0.26445  0.26461 ) ph/cm2/s
Energy fluence (15-150 keV)             : 4.98597e-07 ( -2.38196e-08  2.39075e-08 ) ergs/cm2
Cutoff power-law model
Time interval is from   50.188 sec. to   51.188 sec.
Spectral model in the cutoff power-law:
------------------------------------------------------------
Parameters  : value       lower 90%   higher 90%
Photon index: -0.611207     ( -0.306053   0.329429 )
Epeak [keV] : 102.451      ( -17.1284 36.7916 )
Norm@50keV  : 0.112528    ( -0.0315361   0.0478343 )
------------------------------------------------------------
#Fit statistic  : Chi-Squared                   54.60     using 59 bins.
 Reduced chi-squared = 0.975
# Null hypothesis probability of 5.28e-01 with 56 degrees of freedom

Photon flux (15-150 keV)    in 1 sec: 5.91916 ( -0.27463  0.27464 ) ph/cm2/s
Energy fluence (15-150 keV)             : 4.78355e-07 ( -2.58014e-08  2.57604e-08 ) ergs/cm2
Time-resolved spectra
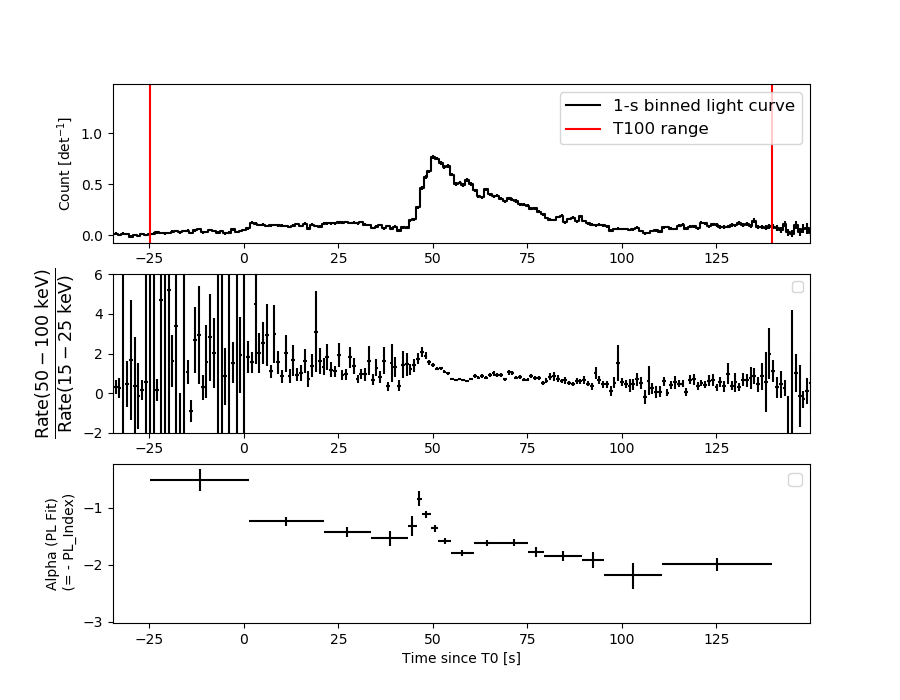
Distribution
T90 vs. Hardness ratio plot
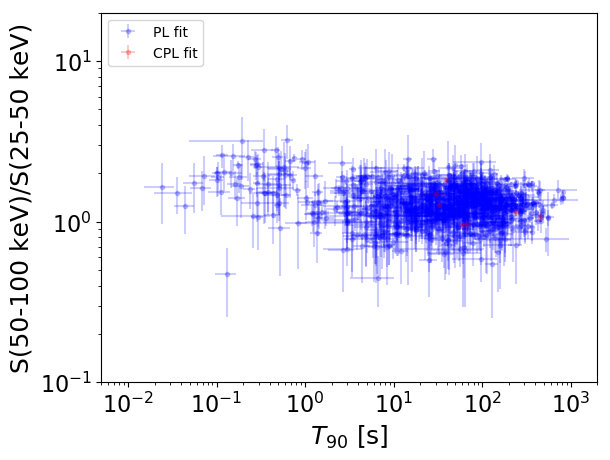
T90                                   = N/A sec.
Hardness ratio (energy fluence ratio) = N/A
S(15-50 keV) vs. S(50-150 keV) plot
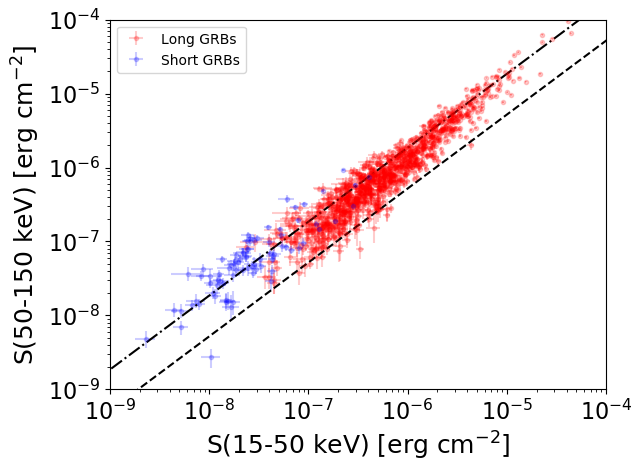
S(15-50 keV)  = N/A
S(50-150 keV) = N/A
The dash-dotted line and the dashed line traces the fluences calculated from the Band function with Epeak = 15 and 150 keV, respectively. Both lines assume a canonical values of alpha = -1 and beta = -2.5.
Mask shadow pattern
IMX = -2.829766426403050E-02, IMY = 6.522529208728120E-02
Spacecraft aspect plot
Bright source in the pre-burst/pre-slew/post-slew images
Pre-burst image of 15-350 keV band
Time interval of the image:
-239.424000 -24.776000

# RAcent  DECcent POSerr Theta    Phi  PeakCts   SNR AngSep     Name
#  [deg]    [deg]    ['] [deg]  [deg]                   [']
245.0034 -15.6424    0.8  37.1  -48.6   6.4876  14.2    1.4	Sco X-1
254.6997  35.2682    0.0  15.3  112.6  -0.1150  -0.4   12.7	Her X-1
268.2452  -1.5124    5.4  25.0  -97.1   0.7001   2.1    8.2	SW J1753.5-0127
274.0513 -13.9486   49.8  38.6  -95.1  -0.1865  -0.2    5.9	GX 17+2
288.7678  10.7910   12.1  33.4 -144.3   0.3091   1.0    9.4	GRS 1915+105
299.5872  35.2028    0.6  41.6  173.8   8.4313  18.1    0.2	Cyg X-1
308.2594  41.0349    8.7  49.3  167.3  -1.0180  -1.3    8.4	Cyg X-3
201.0868  23.8959    4.1  50.2   39.7   4.4512   2.8 ------	UNKNOWN
292.0379  31.0118    3.4  34.7  178.8   1.0538   3.4 ------	UNKNOWN
239.5393  11.2696    2.8  17.6   -2.8   1.0119   4.2 ------	UNKNOWN
264.4962   4.3871    2.4  18.0  -96.1   1.3792   4.7 ------	UNKNOWN
291.7997   4.6883    4.0  38.6 -136.8   1.1815   2.9 ------	UNKNOWN
305.4723   0.2059    2.2  52.8 -139.5   6.3507   5.3 ------	UNKNOWN
Pre-slew background subtracted image of 15-350 keV band
Time interval of the image:
-24.776000 74.276600

# RAcent  DECcent POSerr Theta    Phi  PeakCts   SNR AngSep     Name
#  [deg]    [deg]    ['] [deg]  [deg]                   [']
244.8780 -15.7367    9.1  37.2  -48.4  -0.5237  -1.3    8.2	Sco X-1
254.6572  35.2693    3.9  15.3  112.5  -0.7674  -3.0   10.7	Her X-1
268.4880  -1.3855   11.4  25.0  -97.8  -0.3302  -1.0    8.2	SW J1753.5-0127
273.9175 -13.9109    8.9  38.5  -95.0   1.0155   1.3    9.1	GX 17+2
288.8369  11.0479   19.4  33.4 -144.8  -0.2075  -0.6    6.5	GRS 1915+105
299.4081  35.1855   52.7  41.5  173.8  -0.0974  -0.2    9.0	Cyg X-1
308.1104  40.9511  236.2  49.2  167.3   0.0351   0.0    0.1	Cyg X-3
284.5499  42.7742    2.7  33.4  155.2   1.4628   4.2 ------	UNKNOWN
218.3143   4.4899    2.8  39.3    6.4   1.6226   4.2 ------	UNKNOWN
214.1954  -1.9292    2.1  45.9    1.0   2.4877   5.4 ------	UNKNOWN
311.8279  30.1089    2.5  51.6 -178.4   3.0836   4.6 ------	UNKNOWN
258.5451  17.2768    0.1   4.1 -113.5  19.4937  78.5 ------	UNKNOWN
263.1980   9.5585    2.4  12.9 -102.2   1.1551   4.7 ------	UNKNOWN
298.1424  11.6473    2.1  41.9 -150.4   2.3505   5.6 ------	UNKNOWN
Post-slew image of 15-350 keV band
Time interval of the image:
159.076590 372.276600

# RAcent  DECcent POSerr Theta    Phi  PeakCts   SNR AngSep     Name
#  [deg]    [deg]    ['] [deg]  [deg]                   [']
254.3651  35.3509    7.2  44.2  -28.9   0.8130   1.6    4.6	Her X-1
288.8072  10.8753   10.4  36.5  -91.1  -0.8423  -1.1    4.2	GRS 1915+105
299.5943  35.2130    0.4  11.2  -71.4   8.8655  32.4    0.7	Cyg X-1
308.0693  40.9286    1.8   2.5  -55.1   1.4851   6.3    2.3	Cyg X-3
326.0503  38.2055   41.4  11.8  151.7   0.0690   0.3    9.0	Cyg X-2
211.2200  82.1335    3.6  50.2   39.7   4.3933   3.2 ------	UNKNOWN
217.2366  63.0416    3.1  55.4   16.5   5.6510   3.8 ------	UNKNOWN
328.9899  14.7000    2.8  31.0 -165.1   1.2577   4.2 ------	UNKNOWN
336.1227   2.3251    3.0  45.2 -166.5   1.8594   3.8 ------	UNKNOWN
241.5910  42.1478    2.8  50.3  -14.8   2.4422   4.1 ------	UNKNOWN
266.1936  25.4233    3.2  40.4  -49.3   1.7671   3.6 ------	UNKNOWN
291.5470   4.3319    2.7  41.2  -99.5   4.6035   4.2 ------	UNKNOWN