Analysis Summary
Notes:
- 1) No attempt has been made to eliminate the non-significant decimal places.
- 2) This batgrbproduct analysis is done using the HEASARC data.
- 3) This batgrbproduct analysis is using the flight position for the mask-weighting calculation.
======================================================================
BAT GRB EVENT DATA PROCESSING REPORT
Process Script Ver: batgrbproduct v2.48
Process Start Time: Sun Oct 23 23:56:47 EDT 2022
Host Name: batproc1
Current Working Dir: /local/data/bat1/alien/Swift_3rdBATcatalog/event/batevent_reproc/trigger1091101
======================================================================
Trigger: 01091101 Segment: 000
BAT Trigger Time: 662340755.2 [s; MET]
Trigger Stop: 662340755.456 [s; MET]
UTC: 2021-12-27T23:32:06.866680 [includes UTCF correction]
Where From?: TDRSS position message
BAT
RA: 132.125661624793 Dec: -2.70188941470638 [deg; J2000]
Catalogged Source?: NO
Point Source?: YES
GRB Indicated?: YES [ by BAT flight software ]
Image S/N Ratio: 8.71
Image Trigger?: NO
Rate S/N Ratio: 18 [ if not an image trigger ]
Image S/N Ratio: 8.71
Analysis Position: [ source = BAT ]
RA: 132.125661624793 Dec: -2.70188941470638 [deg; J2000]
Refined Position: [ source = BAT pre-slew burst ]
RA: 132.144652538808 Dec: -2.73438817994132 [deg; J2000]
{ 08h 48m 34.7s , -02d 44' 03.8" }
+/- 1.35297091830622 [arcmin] (estimated 90% radius based on SNR)
+/- 0.489443873958747 [arcmin] (formal 1-sigma fit error)
SNR: 19.7498333209092
Angular difference between the analysis and refined position is 2.257797 arcmin
Partial Coding Fraction: 0.421875 [ including projection effects ]
Duration
T90: 83.5119999647141 +/- 7.55666084977894
Measured from: 1.15599989891052
to: 84.6679998636246 [s; relative to TRIGTIME]
T50: 28.8839999437332 +/- 1.21671690851927
Measured from: 16.663999915123
to: 45.5479998588562 [s; relative to TRIGTIME]
Fluence
Peak Flux (peak 1 second)
Measured from: 0.0640000104904175
to: 1.06400001049042 [s; relative to TRIGTIME]
Total Fluence
Measured from: 0.0399999618530273
to: 127.06400001049 [s; relative to TRIGTIME]
Band 1 Band 2 Band 3 Band 4
15-25 25-50 50-100 100-350 keV
Total 3.484521 4.969697 3.639093 0.805381
0.092164 0.098340 0.090036 0.081139 [error]
Peak 0.178746 0.247134 0.135571 0.023328
0.014626 0.016903 0.014287 0.011214 [error]
[ fluence units of on-axis counts / fully illuminated detector ]
======================================================================
====== Table of the duration information =============================
Value tstart tstop
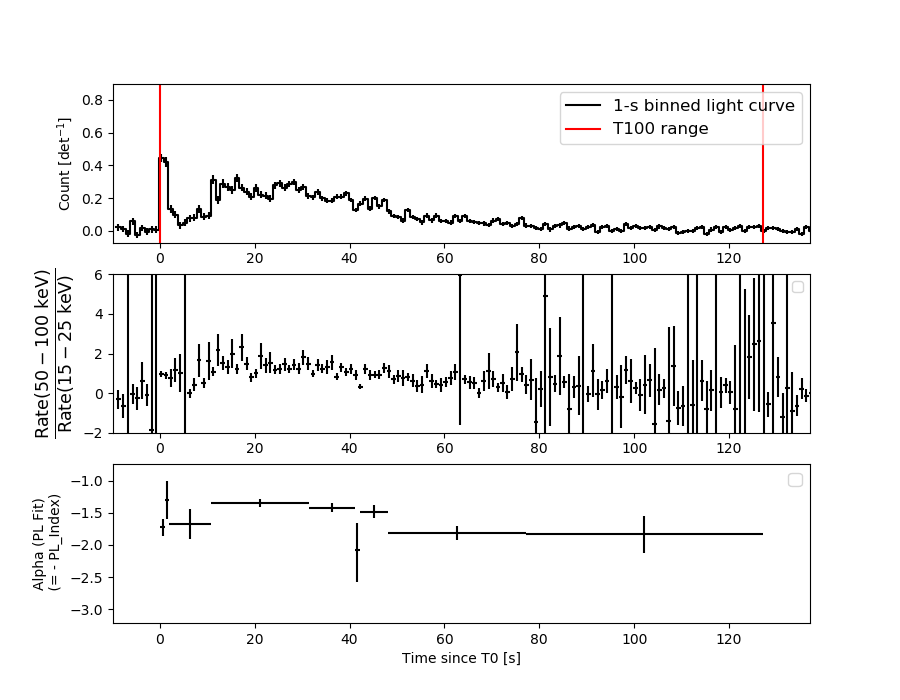
T100 127.024 0.040 127.064
T90 83.512 1.156 84.668
T50 28.884 16.664 45.548
Peak 1.000 0.064 1.064
====== Spectral Analysis Summary =====================================
Model : spectral model: simple power-law (PL) and cutoff power-law (CPL)
Ph_index : photon index: E^{Ph_index}
Ph_90err : 90% error of the photon index
Epeak : Epeak in keV
Epeak_90err: 90% error of Epeak
Norm : normalization at 50 keV in both the PL model and CPL model
Nomr_90err : 90% error of the normalization
chi2 : Chi-Squared
dof : degree of freedo
=== Time-averaged spectral analysis ===
(Best model with acceptable fit: N/A)
Model Ph_index Ph_90err_low Ph_90err_hi Epeak Epeak_90err_low Epeak_90err_hi Norm Nomr_90err_low Norm_90err_hi chi2 dof
PL -1.551 -0.051 0.051 - - - 6.78e-03 -1.78e-04 1.78e-04 59.730 57
CPL -1.279 -0.200 0.209 140.293 -38.991 219.190 9.11e-03 -1.73e-03 2.26e-03 54.270 56
=== 1-s peak spectral analysis ===
(Best model with acceptable fit: N/A)
Model Ph_index Ph_90err_low Ph_90err_hi Epeak Epeak_90err_low Epeak_90err_hi Norm Nomr_90err_low Norm_90err_hi chi2 dof
PL -1.754 -0.143 0.138 - - - 3.79e-02 -3.45e-03 3.40e-03 62.390 57
CPL -1.265 -0.539 0.641 69.390 -18.667 -69.390 6.99e-02 -3.33e-02 8.47e-02 60.110 56
=== Fluence/Peak Flux Summary ===
Model Band1 Band2 Band3 Band4 Band5 Total
15-25 25-50 50-100 100-350 15-150 15-350 keV
Fluence PL 1.15e-06 2.05e-06 2.80e-06 7.92e-06 8.11e-06 1.39e-05 erg/cm2
90%_error_low -5.88e-08 -6.05e-08 -9.50e-08 -5.96e-07 -2.27e-07 -6.53e-07 erg/cm2
90%_error_hi 6.00e-08 6.04e-08 9.48e-08 6.29e-07 2.28e-07 6.80e-07 erg/cm2
Peak flux PL 1.99e+00 1.73e+00 1.02e+00 9.11e-01 5.13e+00 5.65e+00 ph/cm2/s
90%_error_low -2.45e-01 -1.41e-01 -1.20e-01 -1.93e-01 -4.19e-01 -4.62e-01 ph/cm2/s
90%_error_hi 2.52e-01 1.41e-01 1.19e-01 2.20e-01 4.19e-01 4.62e-01 ph/cm2/s
Fluence CPL 1.08e-06 2.09e-06 2.85e-06 5.42e-06 7.93e-06 1.15e-05 erg/cm2
90%_error_low -7.52e-08 -6.64e-08 -1.03e-07 -1.25e-06 -2.62e-07 -1.28e-06 erg/cm2
90%_error_hi 7.65e-08 6.69e-08 1.03e-07 1.71e-06 2.61e-07 1.72e-06 erg/cm2
Peak flux CPL 1.87e+00 1.83e+00 1.05e+00 5.07e-01 5.05e+00 5.25e+00 ph/cm2/s
90%_error_low -2.83e-01 -1.81e-01 -1.30e-01 -2.49e-01 -4.30e-01 -2.68e-01 ph/cm2/s
90%_error_hi 2.86e-01 1.87e-01 1.32e-01 4.77e-01 4.29e-01 6.06e-01 ph/cm2/s
======================================================================
Image
Pre-slew 15.0-350.0 keV image (Event data)
#   RAcent    DECcent   POSerr    Theta     Phi              Peak Cts       SNR   Name
  132.1447    -2.7344   0.0097    32.0771    44.0417         1.5797072     19.750 TRIG_01091101

Foreground time interval of the image:
  0.040   9.501 (delta_t =   9.461 [sec])
Background time interval of the image:
-239.200   0.040 (delta_t = 239.240 [sec])
Light Curves
Note: The mask-weighted lightcurves have units of either count/det or counts/sec/det, where a det is 0.4 x 0.4 = 0.16 sq cm.
Full-time range; 1 s binning
Other quick-look light curves:
- 64 ms binning (zoomed)
- 16 ms binning (zoomed)
- 8 ms binning (zoomed)
- 2 ms binning (zoomed)
- SN=5 or 10 s binning (full-time range)
- Raw light curve
Spectra
- 64 ms binning (zoomed)
- 16 ms binning (zoomed)
- 8 ms binning (zoomed)
- 2 ms binning (zoomed)
- SN=5 or 10 s binning (full-time range)
- Raw light curve
Spectra
Notes:
- 1) The fitting includes the systematic errors.
- 2) When the burst includes telescope slew time periods, the fitting uses an average response file made from multiple 5-s response files through out the slew time plus single time preiod for the non-slew times, and weighted by the total counts in the corresponding time period using addrmf. An average response file is needed becuase a spectral fit using the pre-slew DRM will introduce some errors in both a spectral shape and a normalization if the PHA file contains a lot of the slew/post-slew time interval.
- 3) For fits to more complicated models (e.g. a power-law over a cutoff power-law), the BAT team has decided to require a chi-square improvement of more than 6 for each extra dof.
Time averaged spectrum fit using the average DRM
Power-law model
Time interval is from    0.040 sec. to  127.064 sec.

Spectral model in power-law:
------------------------------------------------------------
Parameters  : value       lower 90%   higher 90%
Photon index: -1.55074     ( -0.0506403   0.0505574 )
Norm@50keV  : 6.77972E-03    ( -0.000178422   0.000178355 )
------------------------------------------------------------
#Fit statistic  : Chi-Squared                   59.73     using 59 bins.
 Reduced chi-squared = 1.04789
# Null hypothesis probability of 3.77e-01 with 57 degrees of freedom

Photon flux (15-150 keV)    in 127 sec: 0.858482 ( -0.024497  0.024565 ) ph/cm2/s
Energy fluence (15-150 keV)             : 8.10594e-06 ( -2.27255e-07  2.27872e-07 ) ergs/cm2
Cutoff power-law model
Time interval is from    0.040 sec. to  127.064 sec.
Spectral model in the cutoff power-law:
------------------------------------------------------------
Parameters  : value       lower 90%   higher 90%
Photon index: -1.27927     ( -0.199762   0.209456 )
Epeak [keV] : 140.293      ( -38.9907 219.19 )
Norm@50keV  : 9.10639E-03    ( -0.00173382   0.00226315 )
------------------------------------------------------------
#Fit statistic  : Chi-Squared                   54.27     using 59 bins.
 Reduced chi-squared = 0.969107
# Null hypothesis probability of 5.41e-01 with 56 degrees of freedom

Photon flux (15-150 keV)    in 127 sec: 0.840793 ( -0.027429  0.027514 ) ph/cm2/s
Energy fluence (15-150 keV)             : 7.92855e-06 ( -2.62106e-07  2.61262e-07 ) ergs/cm2
1-s peak spectrum fit
Power-law model
Time interval is from    0.064 sec. to    1.064 sec.

Spectral model in power-law:
------------------------------------------------------------
Parameters  : value       lower 90%   higher 90%
Photon index: -1.75396     ( -0.142615   0.138468 )
Norm@50keV  : 3.79135E-02    ( -0.00344709   0.00340275 )
------------------------------------------------------------
#Fit statistic  : Chi-Squared                   62.39     using 59 bins.
 Reduced chi-squared = 1.09456
# Null hypothesis probability of 2.91e-01 with 57 degrees of freedom

Photon flux (15-150 keV)    in 1 sec: 5.13429 ( -0.41907  0.41925 ) ph/cm2/s
Energy fluence (15-150 keV)             : 3.49816e-07 ( -3.26694e-08  3.30087e-08 ) ergs/cm2
Cutoff power-law model
Time interval is from    0.064 sec. to    1.064 sec.
Spectral model in the cutoff power-law:
------------------------------------------------------------
Parameters  : value       lower 90%   higher 90%
Photon index: -1.26523     ( -0.538932   0.64077 )
Epeak [keV] : 69.3900      ( -18.6666 -69.39 )
Norm@50keV  : 6.98654E-02    ( -0.0332736   0.0846745 )
------------------------------------------------------------
#Fit statistic  : Chi-Squared                   60.11     using 59 bins.
 Reduced chi-squared = 1.07339
# Null hypothesis probability of 3.29e-01 with 56 degrees of freedom

Photon flux (15-150 keV)    in 1 sec: 5.05465 ( -0.4299  0.42909 ) ph/cm2/s
Energy fluence (15-150 keV)             : 3.37023e-07 ( -3.59443e-08  3.60983e-08 ) ergs/cm2
Time-resolved spectra
Distribution
T90 vs. Hardness ratio plot
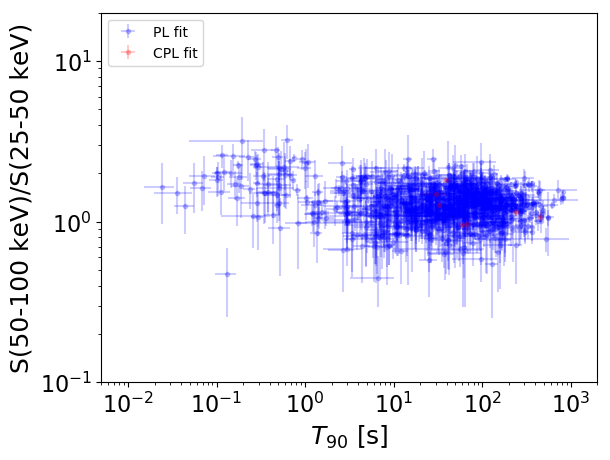
T90                                   = N/A sec.
Hardness ratio (energy fluence ratio) = N/A
S(15-50 keV) vs. S(50-150 keV) plot
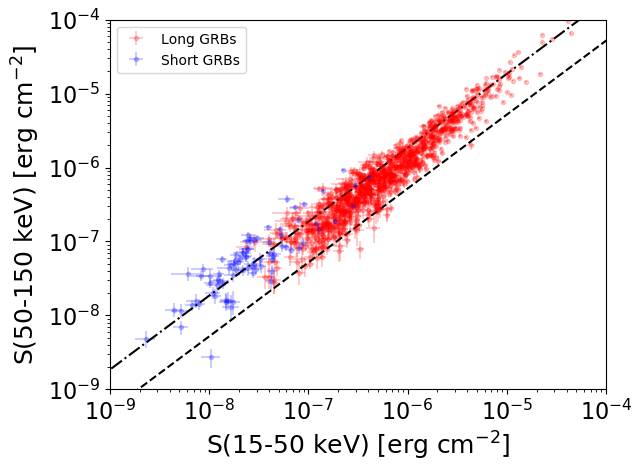
S(15-50 keV)  = N/A
S(50-150 keV) = N/A
The dash-dotted line and the dashed line traces the fluences calculated from the Band function with Epeak = 15 and 150 keV, respectively. Both lines assume a canonical values of alpha = -1 and beta = -2.5.
Mask shadow pattern
IMX = 4.505223046822464E-01, IMY = -4.356992036297798E-01
Spacecraft aspect plot
Bright source in the pre-burst/pre-slew/post-slew images
Pre-burst image of 15-350 keV band
Time interval of the image:
-239.200000 0.040000

# RAcent  DECcent POSerr Theta    Phi  PeakCts   SNR AngSep     Name
#  [deg]    [deg]    ['] [deg]  [deg]                   [']
135.5947 -40.6202    4.7  52.9   -5.1   1.7852   2.4    5.0	Vela X-1
171.7356  27.1869    2.7  22.8  169.1   1.2022   4.2 ------	UNKNOWN
182.1063 -16.0726    2.4  29.0  -71.5   1.9264   4.8 ------	UNKNOWN
203.5042  11.7172    3.3  40.3 -132.3   1.8794   3.5 ------	UNKNOWN
202.1803  -3.1794    3.3  40.1 -109.0   3.2973   3.5 ------	UNKNOWN
207.2200   3.8552    3.8  44.0 -120.6   3.2796   3.0 ------	UNKNOWN
177.2250 -43.0603    3.4  50.6  -44.5   4.1884   3.4 ------	UNKNOWN
211.4079   9.9405    2.6  48.0 -129.2   5.6089   4.3 ------	UNKNOWN
Pre-slew background subtracted image of 15-350 keV band
Time interval of the image:
0.040000 9.500600

# RAcent  DECcent POSerr Theta    Phi  PeakCts   SNR AngSep     Name
#  [deg]    [deg]    ['] [deg]  [deg]                   [']
135.7125 -40.5399    5.1  52.8   -5.1   0.2759   2.3    8.4	Vela X-1
132.1446  -2.7344    0.6  32.1   44.0   1.5797  19.7 ------	UNKNOWN
179.2322  -8.8029    2.1  21.8  -78.9   0.2914   5.4 ------	UNKNOWN
Post-slew image of 15-350 keV band
Time interval of the image:
62.500600 962.848000

# RAcent  DECcent POSerr Theta    Phi  PeakCts   SNR AngSep     Name
#  [deg]    [deg]    ['] [deg]  [deg]                   [']
135.5108 -40.5518    1.2  38.0  -43.1  13.7745   9.5    0.8	Vela X-1
 82.1267 -10.4518    4.6  50.2   39.7  11.8425   2.5 ------	UNKNOWN
141.8327  38.2125    2.7  41.9  152.4   7.1857   4.3 ------	UNKNOWN
 98.8663 -12.9474    3.2  34.5   31.9   3.9218   3.6 ------	UNKNOWN
148.2136  33.9681    2.9  39.7  162.1   5.3193   4.0 ------	UNKNOWN
100.6193 -24.3813    3.6  37.3   12.8   3.5490   3.2 ------	UNKNOWN
117.6347 -27.5996    3.3  28.5  -11.2   2.4751   3.5 ------	UNKNOWN
142.0859  -2.7091    3.5   9.9 -128.8   2.0712   3.3 ------	UNKNOWN
112.0431 -49.0286    2.8  49.4  -21.7   7.7356   4.2 ------	UNKNOWN