Analysis Summary
Notes:
- 1) No attempt has been made to eliminate the non-significant decimal places.
- 2) This batgrbproduct analysis is done using the HEASARC data.
- 3) This batgrbproduct analysis is using the flight position for the mask-weighting calculation.
======================================================================
                  BAT GRB EVENT DATA PROCESSING REPORT
    Process Script Ver: batgrbproduct v2.48
    Process Start Time: Sun Oct 23 23:51:03 EDT 2022
             Host Name: batproc1
   Current Working Dir: /local/data/bat1/alien/Swift_3rdBATcatalog/event/batevent_reproc/trigger1093592
======================================================================

  Trigger: 01093592      Segment: 000

  BAT Trigger Time: 664129160   [s; MET]
      Trigger Stop: 664129240   [s; MET]
               UTC: 2022-01-17T16:18:51.546080    [includes UTCF correction]
       Where From?: TDRSS position message

  BAT
    RA: 91.5781045785567   Dec: -28.409970599826  [deg; J2000]

     Catalogged Source?: NO
     Point Source?:      YES
     GRB Indicated?:     YES    [ by BAT flight software ]
     Image S/N Ratio:    11.06
     Image Trigger?:     YES
     Rate S/N Ratio:     0  [ if not an image trigger ]
     Image S/N Ratio:    11.06

  Analysis Position:   [ source = BAT ]
    RA: 91.5781045785567   Dec: -28.409970599826  [deg; J2000]

  Refined Position:   [ source = BAT pre-slew burst ]
    RA: 91.5917621108134   Dec: -28.4033190855485  [deg; J2000]
        { 06h 06m 22.0s , -28d 24' 11.9" }
         +/- 1.64446059610374 [arcmin] (estimated 90% radius based on SNR)
         +/- 1.17496256567935 [arcmin] (formal 1-sigma fit error)
    SNR: 14.945602267372

  Angular difference between the analysis and refined position is 0.823896 arcmin

  Partial Coding Fraction: 0.2695312    [ including projection effects ]

  Duration
     T90: 50.5600000619888 +/- 2.88111087077553
        Measured from: 15.3519999980927
                   to: 65.9120000600815     [s; relative to TRIGTIME]
     T50: 21.6480000019073 +/- 15.2017114753514
        Measured from: 25.8960000276566
                   to: 47.5440000295639     [s; relative to TRIGTIME]


  Fluence
     Peak Flux  (peak 1 second)
        Measured from: 14.8120000362396
                   to: 15.8120000362396     [s; relative to TRIGTIME]
     Total Fluence
        Measured from: 14.7920000553131
                   to: 68.1519999504089     [s; relative to TRIGTIME]

             Band 1     Band 2     Band 3     Band 4
              15-25      25-50     50-100    100-350     keV
 Total     1.013970   1.134931   0.692893   0.132148
           0.101075   0.104384   0.090042   0.076759 [error]
 Peak      0.049926   0.100443   0.078530   0.014166
           0.015935   0.016983   0.014527   0.011385 [error]

     [ fluence units of on-axis counts / fully illuminated detector ]

======================================================================


====== Table of the duration information =============================

        Value   tstart    tstop
T100   53.360   14.792   68.152
T90    50.560   15.352   65.912
T50    21.648   25.896   47.544
Peak    1.000   14.812   15.812


====== Spectral Analysis Summary =====================================

Model      : spectral model: simple power-law (PL) and cutoff power-law (CPL)
Ph_index   : photon index: E^{Ph_index}
Ph_90err   : 90% error of the photon index
Epeak      : Epeak in keV
Epeak_90err: 90% error of Epeak
Norm       : normalization at 50 keV in both the PL model and CPL model
Nomr_90err : 90% error of the normalization
chi2       : Chi-Squared
dof        : degree of freedo

=== Time-averaged spectral analysis ===
(Best model with acceptable fit: N/A)

Model Ph_index Ph_90err_low Ph_90err_hi  Epeak  Epeak_90err_low  Epeak_90err_hi  Norm       Nomr_90err_low    Norm_90err_hi    chi2    dof
PL      -1.856    -0.183      0.175       -           -               -         3.41e-03     -4.08e-04          4.00e-04      61.390   57
CPL     -1.184    -0.699      0.841       52.642     -13.897       -52.642      8.19e-03     -4.82e-03          1.61e-02      58.730   56


=== 1-s peak spectral analysis ===
(Best model with acceptable fit: N/A)

Model Ph_index Ph_90err_low Ph_90err_hi  Epeak  Epeak_90err_low  Epeak_90err_hi  Norm       Nomr_90err_low    Norm_90err_hi    chi2    dof
PL      -1.641     -0.324     0.306       -           -               -         1.44e-02     -3.13e-03          3.09e-03      61.430   57
CPL      0.160     -1.472     2.246       62.620     -14.417        50.500      1.10e-01     -1.10e-01          1.09e+00      56.800   56


=== Fluence/Peak Flux Summary ===

              Model    Band1     Band2     Band3     Band4     Band5     Total
                       15-25     25-50    50-100    100-350    15-150    15-350    keV
Fluence         PL   3.25e-07  4.81e-07  5.32e-07  1.11e-06  1.67e-06  2.44e-06   erg/cm2
      90%_error_low -4.73e-08 -4.87e-08 -8.45e-08 -3.15e-07 -1.98e-07 -4.13e-07   erg/cm2
      90%_error_hi   4.85e-08  4.87e-08  8.54e-08  3.88e-07  2.01e-07  4.67e-07   erg/cm2
Peak flux       PL   6.77e-01  6.27e-01  4.02e-01  3.97e-01  1.87e+00  2.10e+00   ph/cm2/s
      90%_error_low -2.03e-01 -1.34e-01 -1.06e-01 -1.70e-01 -3.94e-01 -4.38e-01   ph/cm2/s
      90%_error_hi   2.19e-01  1.34e-01  1.05e-01  2.20e-01  3.94e-01  4.39e-01   ph/cm2/s

Fluence        CPL   3.05e-07  5.23e-07  5.27e-07  3.83e-07  1.58e-06  1.74e-06   erg/cm2
      90%_error_low -5.33e-08 -6.52e-08 -9.83e-08 -2.49e-07 -2.17e-07 -3.38e-07   erg/cm2
      90%_error_hi   5.33e-08  6.75e-08  9.46e-08  7.81e-07  2.25e-07  7.89e-07   erg/cm2
Peak flux      CPL   4.75e-01  7.33e-01  4.88e-01  1.17e-01  1.79e+00  1.81e+00   ph/cm2/s
      90%_error_low -4.75e-01 -1.69e-01 -1.38e-01 -1.17e-01 -4.09e-01 -4.23e-01   ph/cm2/s
      90%_error_hi   2.72e-01  1.76e-01  1.45e-01  2.05e-01  4.06e-01  4.34e-01   ph/cm2/s

======================================================================
Image
Pre-slew 15.0-350.0 keV image (Event data)
#   RAcent    DECcent   POSerr    Theta     Phi              Peak Cts       SNR   Name
   91.5918   -28.4033   0.0129    32.7377    84.6852         3.2253790     14.946 TRIG_01093592

Foreground time interval of the image:
 14.792  68.152 (delta_t =  53.360 [sec])
Background time interval of the image:
-239.000  14.792 (delta_t = 253.792 [sec])
Light Curves
Note: The mask-weighted lightcurves have units of either count/det or counts/sec/det, where a det is 0.4 x 0.4 = 0.16 sq cm.
Full-time range; 1 s binning
Other quick-look light curves:
- 64 ms binning (zoomed)
- 16 ms binning (zoomed)
- 8 ms binning (zoomed)
- 2 ms binning (zoomed)
- SN=5 or 10 s binning (full-time range)
- Raw light curve
Spectra
- 64 ms binning (zoomed)
- 16 ms binning (zoomed)
- 8 ms binning (zoomed)
- 2 ms binning (zoomed)
- SN=5 or 10 s binning (full-time range)
- Raw light curve
Spectra
Notes:
- 1) The fitting includes the systematic errors.
- 2) When the burst includes telescope slew time periods, the fitting uses an average response file made from multiple 5-s response files through out the slew time plus single time preiod for the non-slew times, and weighted by the total counts in the corresponding time period using addrmf. An average response file is needed becuase a spectral fit using the pre-slew DRM will introduce some errors in both a spectral shape and a normalization if the PHA file contains a lot of the slew/post-slew time interval.
- 3) For fits to more complicated models (e.g. a power-law over a cutoff power-law), the BAT team has decided to require a chi-square improvement of more than 6 for each extra dof.
Time averaged spectrum fit using the average DRM
Power-law model
Time interval is from   14.792 sec. to   68.152 sec.

Spectral model in power-law:
------------------------------------------------------------
Parameters  : value       lower 90%   higher 90%
Photon index: -1.85637     ( -0.182555   0.175494 )
Norm@50keV  : 3.41335E-03    ( -0.000407733   0.000400489 )
------------------------------------------------------------
#Fit statistic  : Chi-Squared                   61.39     using 59 bins.
 Reduced chi-squared = 1.07702
# Null hypothesis probability of 3.22e-01 with 57 degrees of freedom

Photon flux (15-150 keV)    in 53.36 sec: 0.481057 ( -0.048964  0.048982 ) ph/cm2/s
Energy fluence (15-150 keV)             : 1.67489e-06 ( -1.98212e-07  2.01122e-07 ) ergs/cm2
Cutoff power-law model
Time interval is from   14.792 sec. to   68.152 sec.
Spectral model in the cutoff power-law:
------------------------------------------------------------
Parameters  : value       lower 90%   higher 90%
Photon index: -1.18433     ( -0.699248   0.840872 )
Epeak [keV] : 52.6424      ( -13.8972 -52.6424 )
Norm@50keV  : 8.18551E-03    ( -0.00482337   0.0161387 )
------------------------------------------------------------
#Fit statistic  : Chi-Squared                   58.73     using 59 bins.
 Reduced chi-squared = 1.04875
# Null hypothesis probability of 3.76e-01 with 56 degrees of freedom

Photon flux (15-150 keV)    in 53.36 sec: 0.470519 ( -0.05021  0.050205 ) ph/cm2/s
Energy fluence (15-150 keV)             : 1.57553e-06 ( -2.16697e-07  2.24568e-07 ) ergs/cm2
1-s peak spectrum fit
Power-law model
Time interval is from   14.812 sec. to   15.812 sec.

Spectral model in power-law:
------------------------------------------------------------
Parameters  : value       lower 90%   higher 90%
Photon index: -1.64085     ( -0.324437   0.305489 )
Norm@50keV  : 1.43609E-02    ( -0.00313282   0.00309387 )
------------------------------------------------------------
#Fit statistic  : Chi-Squared                   61.43     using 59 bins.
 Reduced chi-squared = 1.07772
# Null hypothesis probability of 3.20e-01 with 57 degrees of freedom

Photon flux (15-150 keV)    in 1 sec: 1.86961 ( -0.39357  0.39439 ) ph/cm2/s
Energy fluence (15-150 keV)             : 1.33712e-07 ( -3.02526e-08  3.05322e-08 ) ergs/cm2
Cutoff power-law model
Time interval is from   14.812 sec. to   15.812 sec.
Spectral model in the cutoff power-law:
------------------------------------------------------------
Parameters  : value       lower 90%   higher 90%
Photon index: 0.160401     ( -1.47259   2.24534 )
Epeak [keV] : 62.6202      ( -14.4123 50.5044 )
Norm@50keV  : 0.109674    ( -0.109764   1.08715 )
------------------------------------------------------------
#Fit statistic  : Chi-Squared                   56.80     using 59 bins.
 Reduced chi-squared = 1.01429
# Null hypothesis probability of 4.45e-01 with 56 degrees of freedom

Photon flux (15-150 keV)    in 1 sec: 1.79118 ( -0.40895  0.40556 ) ph/cm2/s
Energy fluence (15-150 keV)             : 1.28905e-07 ( -3.02225e-08  3.12056e-08 ) ergs/cm2
Time-resolved spectra
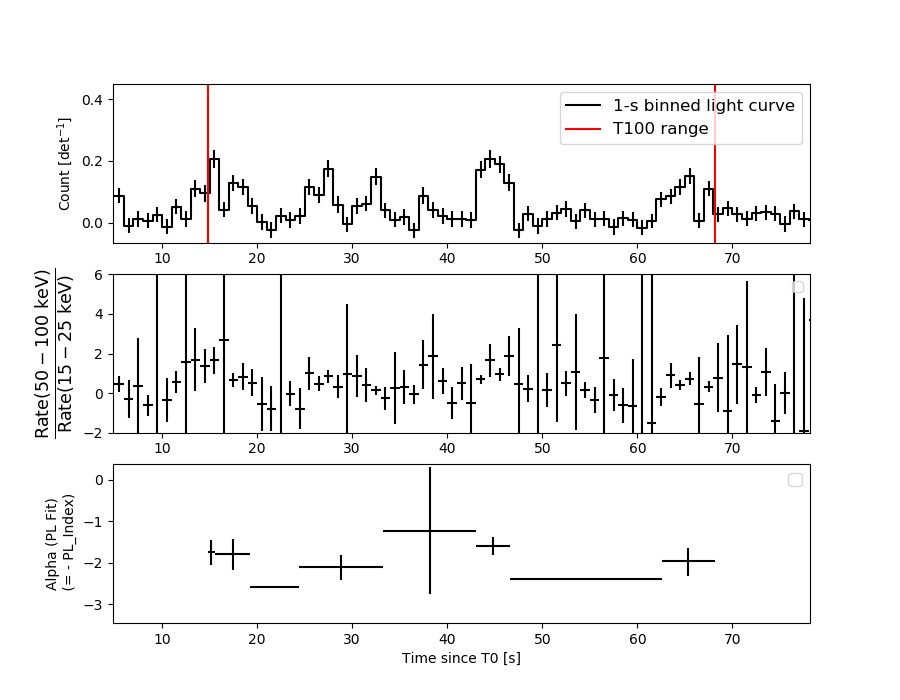
Distribution
T90 vs. Hardness ratio plot
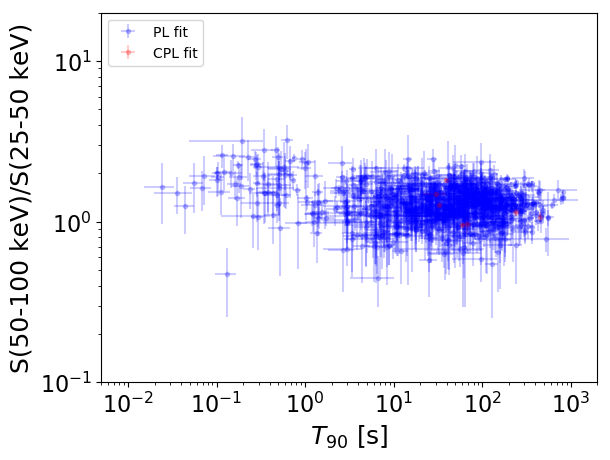
T90                                   = N/A sec.
Hardness ratio (energy fluence ratio) = N/A
S(15-50 keV) vs. S(50-150 keV) plot
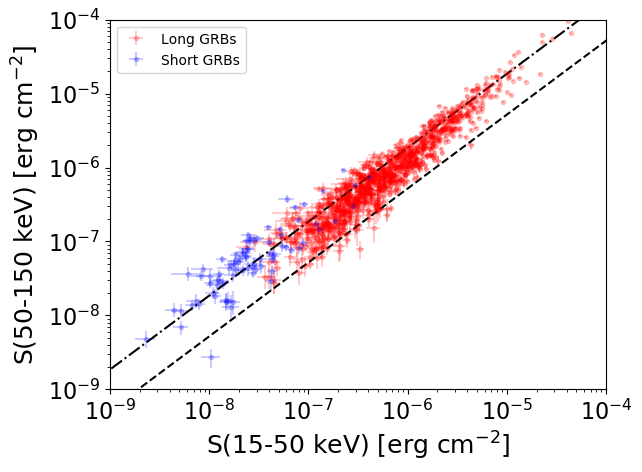
S(15-50 keV)  = N/A
S(50-150 keV) = N/A
The dash-dotted line and the dashed line traces the fluences calculated from the Band function with Epeak = 15 and 150 keV, respectively. Both lines assume a canonical values of alpha = -1 and beta = -2.5.
Mask shadow pattern
IMX = 5.955234194774257E-02, IMY = -6.401537666098231E-01
Spacecraft aspect plot
Bright source in the pre-burst/pre-slew/post-slew images
Pre-burst image of 15-350 keV band
Time interval of the image:
-239.000000 14.792000

# RAcent  DECcent POSerr Theta    Phi  PeakCts   SNR AngSep     Name
#  [deg]    [deg]    ['] [deg]  [deg]                   [']
135.5668 -40.5058    2.9  47.4  140.9   4.1817   3.9    3.4	Vela X-1
170.5129 -60.6628    5.7  50.4 -180.0   1.5475   2.0    6.3	Cen X-3
186.7783 -62.8738    6.5  53.9 -170.8   1.4116   1.8    7.0	GX 301-2
 92.8726 -58.4995    2.6  15.6  152.5   1.2586   4.5 ------	UNKNOWN
190.1925 -69.9340    3.1  49.1 -163.9   2.2299   3.7 ------	UNKNOWN
 22.9487  -9.7462    2.6  56.0  -14.9   4.2167   4.5 ------	UNKNOWN
 19.6298  -7.8781    2.5  59.2  -17.3   7.5161   4.6 ------	UNKNOWN
  9.9380 -26.5632    2.6  48.6  -39.7   3.8443   4.3 ------	UNKNOWN
Pre-slew background subtracted image of 15-350 keV band
Time interval of the image:
14.792000 68.152000

# RAcent  DECcent POSerr Theta    Phi  PeakCts   SNR AngSep     Name
#  [deg]    [deg]    ['] [deg]  [deg]                   [']
135.5805 -40.5539    3.0  47.4  141.0  -1.8738  -3.8    2.4	Vela X-1
170.4691 -60.5455   10.1  50.5  179.9  -0.3032  -1.1    6.5	Cen X-3
186.8055 -62.7570   18.2  54.0 -170.9  -0.1791  -0.6    4.2	GX 301-2
 91.5906 -28.4028    0.8  32.7   84.7   3.1573  14.6 ------	UNKNOWN
Post-slew image of 15-350 keV band
Time interval of the image:
141.300590 963.087500

# RAcent  DECcent POSerr Theta    Phi  PeakCts   SNR AngSep     Name
#  [deg]    [deg]    ['] [deg]  [deg]                   [']
135.5274 -40.5537    3.5  37.8  178.7   3.6719   3.3    0.1	Vela X-1
106.4721   8.4745    3.5  39.6   81.7   8.8685   3.3 ------	UNKNOWN
 91.5732  -1.2244    3.7  27.2   58.2   2.9170   3.1 ------	UNKNOWN
 49.4151 -10.3226    3.2  43.4  -15.8   4.5472   3.7 ------	UNKNOWN
 35.2226  -3.1199    3.0  59.2  -17.3  17.7075   3.8 ------	UNKNOWN
 36.7685 -11.2876    2.8  53.8  -24.9  13.1931   4.1 ------	UNKNOWN
138.9154 -70.6369    3.1  49.7 -140.5   8.8821   3.7 ------	UNKNOWN
158.0034 -69.1752    2.9  55.3 -145.2  16.7661   4.0 ------	UNKNOWN