Analysis Summary
Notes:
- 1) No attempt has been made to eliminate the non-significant decimal places.
- 2) This batgrbproduct analysis is done using the HEASARC data.
- 3) This batgrbproduct analysis is using the flight position for the mask-weighting calculation.
======================================================================
                  BAT GRB EVENT DATA PROCESSING REPORT
    Process Script Ver: batgrbproduct v2.48
    Process Start Time: Sun Oct 23 23:47:36 EDT 2022
             Host Name: batproc1
   Current Working Dir: /local/data/bat1/alien/Swift_3rdBATcatalog/event/batevent_reproc/trigger1093611
======================================================================

  Trigger: 01093611      Segment: 000

  BAT Trigger Time: 664142756.608   [s; MET]
      Trigger Stop: 664142760.704   [s; MET]
               UTC: 2022-01-17T20:05:28.153160    [includes UTCF correction]
       Where From?: TDRSS position message

  BAT
    RA: 191.946882570062   Dec: -28.7443931056232  [deg; J2000]

     Catalogged Source?: NO
     Point Source?:      YES
     GRB Indicated?:     YES    [ by BAT flight software ]
     Image S/N Ratio:    7.14
     Image Trigger?:     NO
     Rate S/N Ratio:     11.0453610171873  [ if not an image trigger ]
     Image S/N Ratio:    7.14

  Analysis Position:   [ source = BAT ]
    RA: 191.946882570062   Dec: -28.7443931056232  [deg; J2000]

  Refined Position:   [ source = BAT pre-slew burst ]
    RA: 191.989362907673   Dec: -28.7620350589319  [deg; J2000]
        { 12h 47m 57.4s , -28d 45' 43.3" }
         +/- 2.65528411558777 [arcmin] (estimated 90% radius based on SNR)
         +/- 1.63568835348977 [arcmin] (formal 1-sigma fit error)
    SNR: 7.53781590437778

  Angular difference between the analysis and refined position is 2.472584 arcmin

  Partial Coding Fraction: 0.96875    [ including projection effects ]

  Duration
     T90: 24.3680000305176 +/- 4.63344375680939
        Measured from: -1.89600002765656
                   to: 22.472000002861     [s; relative to TRIGTIME]
     T50: 12.8159999847412 +/- 7.21394208795047
        Measured from: 0.935999989509583
                   to: 13.7519999742508     [s; relative to TRIGTIME]


  Fluence
     Peak Flux  (peak 1 second)
        Measured from: -0.132000088691711
                   to: 0.867999911308289     [s; relative to TRIGTIME]
     Total Fluence
        Measured from: -2.72800004482269
                   to: 23.2879999876022     [s; relative to TRIGTIME]

             Band 1     Band 2     Band 3     Band 4
              15-25      25-50     50-100    100-350     keV
 Total     0.170706   0.267488   0.104353   0.005400
           0.035605   0.035782   0.030857   0.026619 [error]
 Peak      0.016933   0.029194   0.015479   0.002044
           0.007352   0.007116   0.006421   0.005142 [error]

     [ fluence units of on-axis counts / fully illuminated detector ]

======================================================================


====== Table of the duration information =============================

        Value   tstart    tstop
T100   26.016   -2.728   23.288
T90    24.368   -1.896   22.472
T50    12.816    0.936   13.752
Peak    1.000   -0.132    0.868


====== Spectral Analysis Summary =====================================

Model      : spectral model: simple power-law (PL) and cutoff power-law (CPL)
Ph_index   : photon index: E^{Ph_index}
Ph_90err   : 90% error of the photon index
Epeak      : Epeak in keV
Epeak_90err: 90% error of Epeak
Norm       : normalization at 50 keV in both the PL model and CPL model
Nomr_90err : 90% error of the normalization
chi2       : Chi-Squared
dof        : degree of freedo

=== Time-averaged spectral analysis ===
(Best model with acceptable fit: N/A)

Model Ph_index Ph_90err_low Ph_90err_hi  Epeak  Epeak_90err_low  Epeak_90err_hi  Norm       Nomr_90err_low    Norm_90err_hi    chi2    dof
PL      -1.944    -0.337      0.309       -           -               -         1.21e-03     -2.80e-04          2.73e-04      80.540   57
CPL     -0.637    -1.568      2.998       38.244     -38.142        80.364      7.97e-03     -7.97e-03          7.92e-01      78.740   56


=== 1-s peak spectral analysis ===
(Best model with acceptable fit: N/A)

Model Ph_index Ph_90err_low Ph_90err_hi  Epeak  Epeak_90err_low  Epeak_90err_hi  Norm       Nomr_90err_low    Norm_90err_hi    chi2    dof
PL      -1.412     -0.585     0.602       -           -               -         4.25e-03     -1.35e-03          1.32e-03      69.660   57
CPL     -1.423     -0.575     1.058     9999.300    -9999.300      -9999.300      4.24e-03     -1.33e-03          4.72e-02      69.660   56


=== Fluence/Peak Flux Summary ===

              Model    Band1     Band2     Band3     Band4     Band5     Total
                       15-25     25-50    50-100    100-350    15-150    15-350    keV
Fluence         PL   6.11e-08  8.58e-08  8.92e-08  1.70e-07  2.90e-07  4.06e-07   erg/cm2
      90%_error_low -1.40e-08 -1.54e-08 -2.69e-08 -8.24e-08 -6.29e-08 -1.19e-07   erg/cm2
      90%_error_hi   1.44e-08  1.53e-08  2.84e-08  1.24e-07  6.59e-08  1.52e-07   erg/cm2
Peak flux       PL   1.61e-01  1.71e-01  1.28e-01  1.56e-01  5.19e-01  6.16e-01   ph/cm2/s
      90%_error_low -8.25e-02 -5.83e-02 -5.15e-02 -9.87e-02 -1.60e-01 -1.92e-01   ph/cm2/s
      90%_error_hi   9.38e-02  5.55e-02  5.03e-02  1.80e-01  1.60e-01  2.00e-01   ph/cm2/s

Fluence        CPL   5.83e-08  9.99e-08  7.18e-08  1.73e-08  2.44e-07  2.47e-07   erg/cm2
      90%_error_low -1.55e-08 -2.33e-08 -4.57e-08 -1.70e-08 -6.46e-08 -6.79e-08   erg/cm2
      90%_error_hi   1.54e-08  2.48e-08  3.93e-08  1.40e-07  8.59e-08  2.07e-07   erg/cm2
Peak flux      CPL   1.66e-01  1.70e-01  1.27e-01  1.56e-01  5.21e-01  6.20e-01   ph/cm2/s
      90%_error_low -8.92e-02 -5.82e-02 -2.51e-02     N/A   -1.62e-01 -2.34e-01   ph/cm2/s
      90%_error_hi   8.85e-02  6.13e-02  5.24e-02     N/A    1.59e-01  1.78e-01   ph/cm2/s

======================================================================
Image
Pre-slew 15.0-350.0 keV image (Event data)

#   RAcent    DECcent   POSerr    Theta     Phi              Peak Cts       SNR   Name
  191.9894   -28.7620   0.0254    12.5029    30.9171         0.5312100      7.538 TRIG_01093611

Foreground time interval of the image:
 -2.728  23.288 (delta_t =  26.016 [sec])
Background time interval of the image:
-239.608  -2.728 (delta_t = 236.880 [sec])
Light Curves
Note: The mask-weighted lightcurves have units of either count/det or counts/sec/det, where a det is 0.4 x 0.4 = 0.16 sq cm.
Full-time range; 1 s binning
Other quick-look light curves:
- 64 ms binning (zoomed)
- 16 ms binning (zoomed)
- 8 ms binning (zoomed)
- 2 ms binning (zoomed)
- SN=5 or 10 s binning (full-time range)
- Raw light curve
Spectra
- 64 ms binning (zoomed)
- 16 ms binning (zoomed)
- 8 ms binning (zoomed)
- 2 ms binning (zoomed)
- SN=5 or 10 s binning (full-time range)
- Raw light curve
Spectra
Notes:
- 1) The fitting includes the systematic errors.
- 2) When the burst includes telescope slew time periods, the fitting uses an average response file made from multiple 5-s response files through out the slew time plus single time preiod for the non-slew times, and weighted by the total counts in the corresponding time period using addrmf. An average response file is needed becuase a spectral fit using the pre-slew DRM will introduce some errors in both a spectral shape and a normalization if the PHA file contains a lot of the slew/post-slew time interval.
- 3) For fits to more complicated models (e.g. a power-law over a cutoff power-law), the BAT team has decided to require a chi-square improvement of more than 6 for each extra dof.
Time averaged spectrum fit using the average DRM
Power-law model
Time interval is from   -2.728 sec. to   23.288 sec.

Spectral model in power-law:
------------------------------------------------------------
Parameters  : value       lower 90%   higher 90%
Photon index: -1.94384     ( -0.336631   0.309294 )
Norm@50keV  : 1.21028E-03    ( -0.000280404   0.000272533 )
------------------------------------------------------------
#Fit statistic  : Chi-Squared                   80.54     using 59 bins.
 Reduced chi-squared = 1.41298
# Null hypothesis probability of 2.18e-02 with 57 degrees of freedom

Photon flux (15-150 keV)    in 26.02 sec: 0.177023 ( -0.030979  0.030984 ) ph/cm2/s
Energy fluence (15-150 keV)             : 2.89806e-07 ( -6.29354e-08  6.58891e-08 ) ergs/cm2
Cutoff power-law model

Time interval is from   -2.728 sec. to   23.288 sec.
Spectral model in the cutoff power-law:
------------------------------------------------------------
Parameters  : value       lower 90%   higher 90%
Photon index: -0.637247     ( -1.58898   2.97674 )
Epeak [keV] : 38.2440      ( -37.9963 80.5102 )
Norm@50keV  : 7.96806E-03    ( -0.00847553   0.791566 )
------------------------------------------------------------
#Fit statistic  : Chi-Squared                   78.74     using 59 bins.
 Reduced chi-squared = 1.40607
# Null hypothesis probability of 2.42e-02 with 56 degrees of freedom

Photon flux (15-150 keV)    in 26.02 sec: 0.169720 ( -0.031603  0.032198 ) ph/cm2/s
Energy fluence (15-150 keV)             : 2.44145e-07 ( -6.46311e-08  8.5873e-08 ) ergs/cm2
1-s peak spectrum fit
Power-law model

Time interval is from   -0.132 sec. to    0.868 sec.

Spectral model in power-law:
------------------------------------------------------------
Parameters  : value       lower 90%   higher 90%
Photon index: -1.41181     ( -0.584754   0.60216 )
Norm@50keV  : 4.25328E-03    ( -0.00135168   0.00131658 )
------------------------------------------------------------
#Fit statistic  : Chi-Squared                   69.66     using 59 bins.
 Reduced chi-squared = 1.22211
# Null hypothesis probability of 1.21e-01 with 57 degrees of freedom

Photon flux (15-150 keV)    in 1 sec: 0.519384 ( -0.15975  0.160246 ) ph/cm2/s
Energy fluence (15-150 keV)             : 4.10053e-08 ( -1.42044e-08  1.48044e-08 ) ergs/cm2
Cutoff power-law model

Time interval is from   -0.132 sec. to    0.868 sec.
Spectral model in the cutoff power-law:
------------------------------------------------------------
Parameters  : value       lower 90%   higher 90%
Photon index: -1.4232     ( -0.577941   1.0543 )
Epeak [keV] : 9999.30      ( -9999.36 -9999.36 )
Norm@50keV  : 4.23822E-03    ( -0.00135583   0.0471917 )
------------------------------------------------------------
#Fit statistic  : Chi-Squared                   69.66     using 59 bins.
 Reduced chi-squared = 1.24393
# Null hypothesis probability of 1.04e-01 with 56 degrees of freedom

Photon flux (15-150 keV)    in 1 sec: 0.520802 ( -0.161533  0.159299 ) ph/cm2/s
Energy fluence (15-150 keV)             : 4.19411e-08 ( -1.62342e-08  1.35994e-08 ) ergs/cm2
Time-resolved spectra

Distribution
T90 vs. Hardness ratio plot
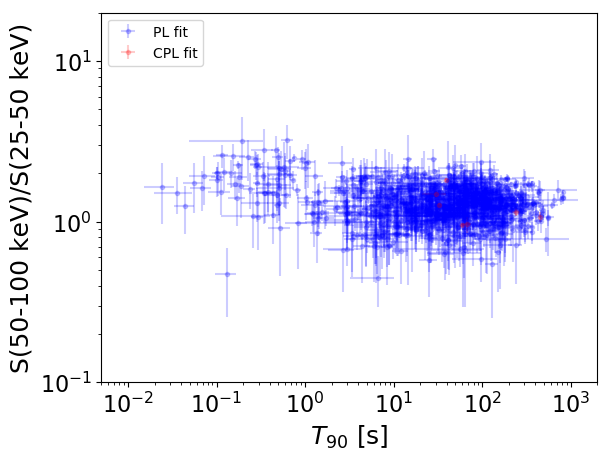
T90                                   = N/A sec.
Hardness ratio (energy fluence ratio) = N/A
S(15-50 keV) vs. S(50-150 keV) plot
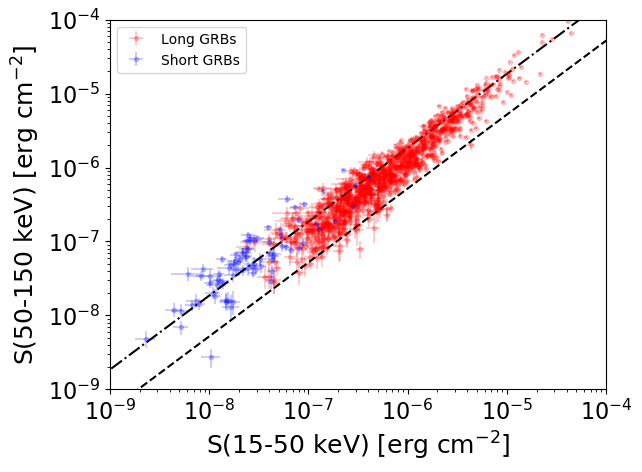
S(15-50 keV)  = N/A
S(50-150 keV) = N/A
The dash-dotted line and the dashed line traces the fluences calculated from the Band function with Epeak = 15 and 150 keV, respectively. Both lines assume a canonical values of alpha = -1 and beta = -2.5.
Mask shadow pattern

IMX = 1.902394694622780E-01, IMY = -1.139329220769786E-01
Spacecraft aspect plot
Bright source in the pre-burst/pre-slew/post-slew images
Pre-burst image of 15-350 keV band
Time interval of the image:
-239.608000 -2.728000

# RAcent  DECcent POSerr Theta    Phi  PeakCts   SNR AngSep     Name
#  [deg]    [deg]    ['] [deg]  [deg]                   [']
170.2684 -60.6251    4.0  45.0   -2.2   1.4277   2.9    1.4	Cen X-3
186.6297 -62.7046   17.8  42.2  -13.1   0.2920   0.6    4.0	GX 301-2
244.9459 -15.6451    1.1  39.4 -116.9   6.3811  10.4    2.0	Sco X-1
163.0911 -13.4384    3.0  39.6   70.9   3.9015   3.8 ------	UNKNOWN
192.5181 -30.0471    2.6  12.8   24.8   1.1671   4.5 ------	UNKNOWN
189.3391 -44.7288    2.5  25.5   -0.5   1.2987   4.6 ------	UNKNOWN
213.6585 -18.9264    3.2   9.8 -132.1   0.8618   3.6 ------	UNKNOWN
Pre-slew background subtracted image of 15-350 keV band
Time interval of the image:
-2.728000 23.288000

# RAcent  DECcent POSerr Theta    Phi  PeakCts   SNR AngSep     Name
#  [deg]    [deg]    ['] [deg]  [deg]                   [']
170.4796 -60.5203    4.7  44.8   -2.2   0.2838   2.4    7.8	Cen X-3
186.4822 -62.6895   21.2  42.2  -13.0   0.0580   0.5    6.8	GX 301-2
245.1265 -15.6702    8.1  39.6 -116.7   0.2358   1.4    8.7	Sco X-1
191.9891 -28.7619    1.5  12.5   30.9   0.5315   7.5 ------	UNKNOWN
Post-slew image of 15-350 keV band
Time interval of the image:
84.692590 306.292620

# RAcent  DECcent POSerr Theta    Phi  PeakCts   SNR AngSep     Name
#  [deg]    [deg]    ['] [deg]  [deg]                   [']
135.5998 -40.3534   23.0  47.0   33.7  -0.3465  -0.5   12.5	Vela X-1
170.0640 -60.5731    4.7  35.0   -7.8   0.8095   2.5    8.0	Cen X-3
186.6076 -62.6669    8.2  34.1  -22.1   0.4500   1.4    6.3	GX 301-2
207.3323 -86.5141    1.8  57.9  -27.5   9.0730   6.3 ------	UNKNOWN