Analysis Summary
Notes:
- 1) No attempt has been made to eliminate the non-significant decimal places.
- 2) This batgrbproduct analysis is done using the HEASARC data.
- 3) This batgrbproduct analysis is using the flight position for the mask-weighting calculation.
======================================================================
BAT GRB EVENT DATA PROCESSING REPORT
Process Script Ver: batgrbproduct v2.48
Process Start Time: Sun Oct 23 23:44:13 EDT 2022
Host Name: batproc1
Current Working Dir: /local/data/bat1/alien/Swift_3rdBATcatalog/event/batevent_reproc/trigger1093742
======================================================================
Trigger: 01093742 Segment: 000
BAT Trigger Time: 664222866.56 [s; MET]
Trigger Stop: 664222867.584 [s; MET]
UTC: 2022-01-18T18:20:38.099740 [includes UTCF correction]
Where From?: TDRSS position message
BAT
RA: 192.274400418694 Dec: 22.9093590537508 [deg; J2000]
Catalogged Source?: NO
Point Source?: YES
GRB Indicated?: YES [ by BAT flight software ]
Image S/N Ratio: 7.36
Image Trigger?: NO
Rate S/N Ratio: 16.4012194668567 [ if not an image trigger ]
Image S/N Ratio: 7.36
Analysis Position: [ source = BAT ]
RA: 192.274400418694 Dec: 22.9093590537508 [deg; J2000]
Refined Position: [ source = BAT pre-slew burst ]
RA: 192.276912171737 Dec: 22.9104792326595 [deg; J2000]
{ 12h 49m 06.5s , +22d 54' 37.7" }
+/- 1.3564416411626 [arcmin] (estimated 90% radius based on SNR)
+/- 0.666901727869427 [arcmin] (formal 1-sigma fit error)
SNR: 19.6776817294017
Angular difference between the analysis and refined position is 0.154232 arcmin
Partial Coding Fraction: 0.2265625 [ including projection effects ]
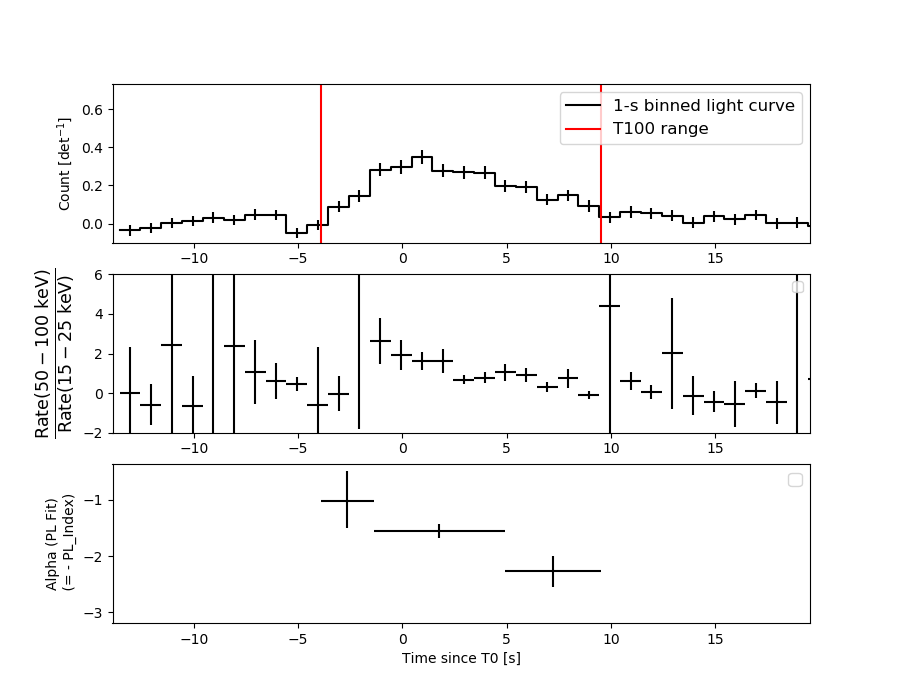
Duration
T90: 10.6080000400543 +/- 1.77952803014474
Measured from: -2.31199991703033
to: 8.29600012302399 [s; relative to TRIGTIME]
T50: 4.8639999628067 +/- 0.823222883716814
Measured from: -0.119999885559082
to: 4.74400007724762 [s; relative to TRIGTIME]
Fluence
Peak Flux (peak 1 second)
Measured from: 0.684000015258789
to: 1.68400001525879 [s; relative to TRIGTIME]
Total Fluence
Measured from: -3.89599990844727
to: 9.5440000295639 [s; relative to TRIGTIME]
Band 1 Band 2 Band 3 Band 4
15-25 25-50 50-100 100-350 keV
Total 0.712149 1.100912 0.783525 0.183637
0.061468 0.065637 0.060273 0.047571 [error]
Peak 0.093993 0.126883 0.135520 0.025227
0.017892 0.019042 0.018840 0.013314 [error]
[ fluence units of on-axis counts / fully illuminated detector ]
======================================================================
====== Table of the duration information =============================
Value tstart tstop
T100 13.440 -3.896 9.544
T90 10.608 -2.312 8.296
T50 4.864 -0.120 4.744
Peak 1.000 0.684 1.684
====== Spectral Analysis Summary =====================================
Model : spectral model: simple power-law (PL) and cutoff power-law (CPL)
Ph_index : photon index: E^{Ph_index}
Ph_90err : 90% error of the photon index
Epeak : Epeak in keV
Epeak_90err: 90% error of Epeak
Norm : normalization at 50 keV in both the PL model and CPL model
Nomr_90err : 90% error of the normalization
chi2 : Chi-Squared
dof : degree of freedo
=== Time-averaged spectral analysis ===
(Best model with acceptable fit: N/A)
Model Ph_index Ph_90err_low Ph_90err_hi Epeak Epeak_90err_low Epeak_90err_hi Norm Nomr_90err_low Norm_90err_hi chi2 dof
PL -1.667 -0.122 0.120 - - - 1.43e-02 -1.07e-03 1.06e-03 43.980 57
CPL -1.107 -0.484 0.543 77.628 -18.232 152.887 2.80e-02 -1.20e-02 2.47e-02 40.010 56
=== 1-s peak spectral analysis ===
(Best model with acceptable fit: N/A)
Model Ph_index Ph_90err_low Ph_90err_hi Epeak Epeak_90err_low Epeak_90err_hi Norm Nomr_90err_low Norm_90err_hi chi2 dof
PL -1.547 -0.254 0.243 - - - 2.60e-02 -4.01e-03 3.98e-03 46.140 57
CPL -1.299 -0.489 1.042 154.407 -154.407 -154.407 3.42e-02 -2.53e-02 7.01e-02 45.910 56
=== Fluence/Peak Flux Summary ===
Model Band1 Band2 Band3 Band4 Band5 Total
15-25 25-50 50-100 100-350 15-150 15-350 keV
Fluence PL 2.88e-07 4.78e-07 6.02e-07 1.51e-06 1.79e-06 2.88e-06 erg/cm2
90%_error_low -3.24e-08 -3.45e-08 -5.86e-08 -2.84e-07 -1.40e-07 -3.40e-07 erg/cm2
90%_error_hi 3.33e-08 3.45e-08 5.84e-08 3.24e-07 1.41e-07 3.69e-07 erg/cm2
Peak flux PL 1.12e+00 1.09e+00 7.49e-01 8.06e-01 3.28e+00 3.77e+00 ph/cm2/s
90%_error_low -2.70e-01 -1.76e-01 -1.43e-01 -2.72e-01 -5.05e-01 -5.68e-01 ph/cm2/s
90%_error_hi 2.89e-01 1.74e-01 1.40e-01 3.30e-01 5.06e-01 5.70e-01 ph/cm2/s
Fluence CPL 2.64e-07 5.08e-07 6.20e-07 6.89e-07 1.72e-06 2.08e-06 erg/cm2
90%_error_low -3.82e-08 -4.33e-08 -6.42e-08 -3.17e-07 -1.52e-07 -3.51e-07 erg/cm2
90%_error_hi 3.87e-08 4.43e-08 6.50e-08 6.54e-07 1.53e-07 6.51e-07 erg/cm2
Peak flux CPL 1.06e+00 1.12e+00 7.76e-01 6.36e-01 3.26e+00 3.59e+00 ph/cm2/s
90%_error_low -3.33e-01 -1.94e-01 -1.63e-01 -3.75e-01 -5.11e-01 -6.71e-01 ph/cm2/s
90%_error_hi 3.30e-01 2.04e-01 1.77e-01 2.58e-01 5.11e-01 7.03e-01 ph/cm2/s
======================================================================
Image
Pre-slew 15.0-350.0 keV image (Event data)
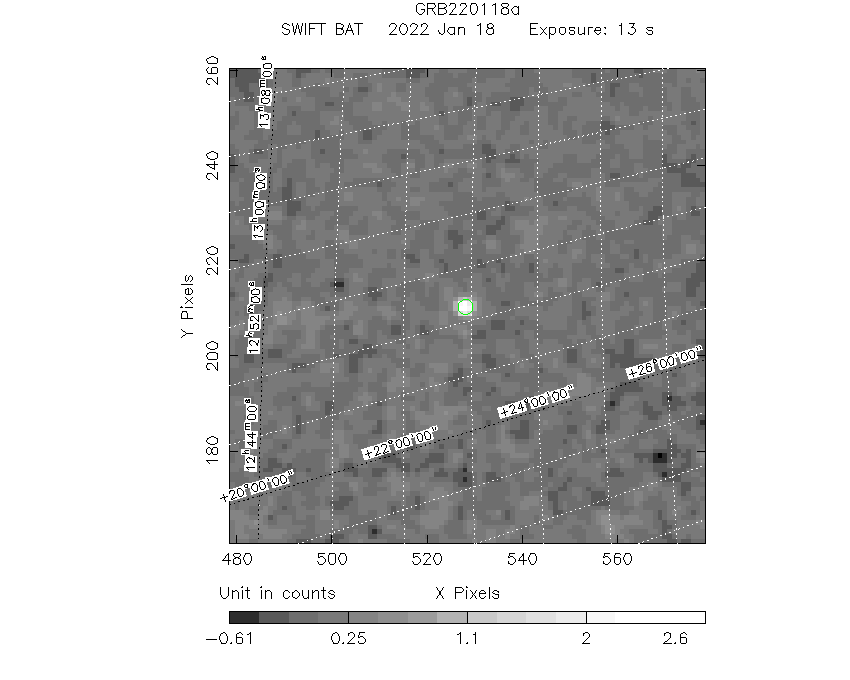
#   RAcent    DECcent   POSerr    Theta     Phi              Peak Cts       SNR   Name
  192.2769    22.9105   0.0097    42.8204    37.1462         2.8220343     19.678 TRIG_01093742

Foreground time interval of the image:
 -3.896   9.544 (delta_t =  13.440 [sec])
Background time interval of the image:
-114.859  -3.896 (delta_t = 110.963 [sec])
Light Curves
Note: The mask-weighted lightcurves have units of either count/det or counts/sec/det, where a det is 0.4 x 0.4 = 0.16 sq cm.
Full-time range; 1 s binning
Other quick-look light curves:
- 64 ms binning (zoomed)
- 16 ms binning (zoomed)
- 8 ms binning (zoomed)
- 2 ms binning (zoomed)
- SN=5 or 10 s binning (full-time range)
- Raw light curve
Spectra
- 64 ms binning (zoomed)
- 16 ms binning (zoomed)
- 8 ms binning (zoomed)
- 2 ms binning (zoomed)
- SN=5 or 10 s binning (full-time range)
- Raw light curve
Spectra
Notes:
- 1) The fitting includes the systematic errors.
- 2) When the burst includes telescope slew time periods, the fitting uses an average response file made from multiple 5-s response files through out the slew time plus single time preiod for the non-slew times, and weighted by the total counts in the corresponding time period using addrmf. An average response file is needed becuase a spectral fit using the pre-slew DRM will introduce some errors in both a spectral shape and a normalization if the PHA file contains a lot of the slew/post-slew time interval.
- 3) For fits to more complicated models (e.g. a power-law over a cutoff power-law), the BAT team has decided to require a chi-square improvement of more than 6 for each extra dof.
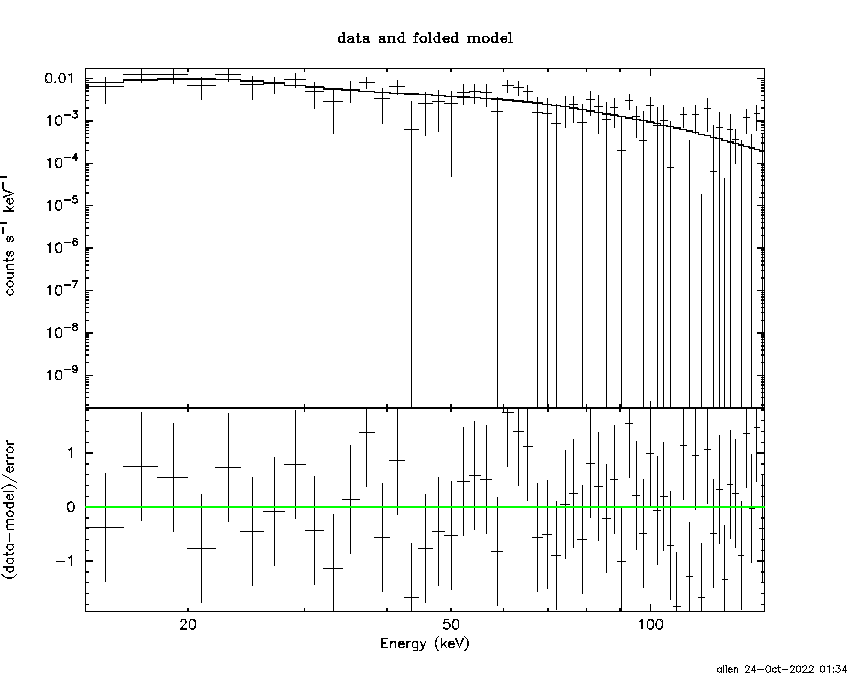
Time averaged spectrum fit using the average DRM
Power-law model
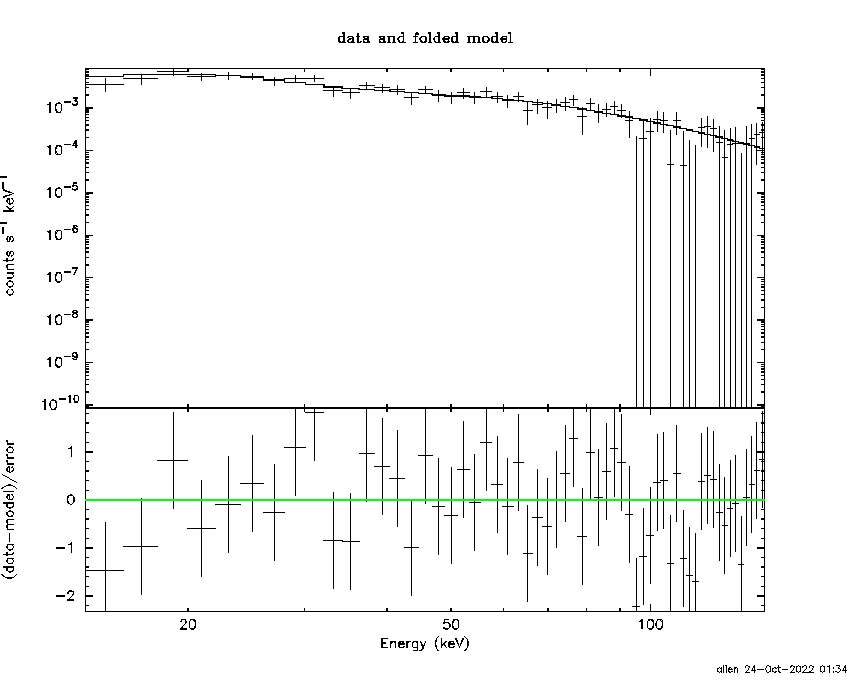
Time interval is from   -3.896 sec. to    9.544 sec.

Spectral model in power-law:
------------------------------------------------------------
Parameters  : value       lower 90%   higher 90%
Photon index: -1.66734     ( -0.122046   0.120095 )
Norm@50keV  : 1.43326E-02    ( -0.00106796   0.00106136 )
------------------------------------------------------------
#Fit statistic  : Chi-Squared                   43.98     using 59 bins.
 Reduced chi-squared = 0.771579
# Null hypothesis probability of 8.97e-01 with 57 degrees of freedom

Photon flux (15-150 keV)    in 13.44 sec: 1.88240 ( -0.13619  0.13636 ) ph/cm2/s
Energy fluence (15-150 keV)             : 1.78878e-06 ( -1.39902e-07  1.4087e-07 ) ergs/cm2
Cutoff power-law model
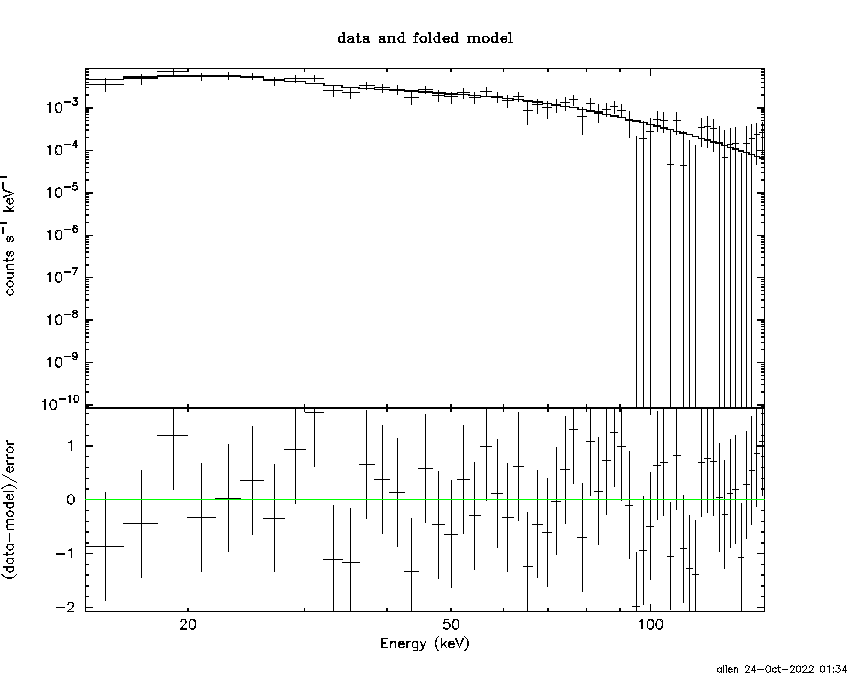
Time interval is from   -3.896 sec. to    9.544 sec.
Spectral model in the cutoff power-law:
------------------------------------------------------------
Parameters  : value       lower 90%   higher 90%
Photon index: -1.1071     ( -0.484191   0.543304 )
Epeak [keV] : 77.6276      ( -18.2321 152.887 )
Norm@50keV  : 2.79617E-02    ( -0.012035   0.0247284 )
------------------------------------------------------------
#Fit statistic  : Chi-Squared                   40.01     using 59 bins.
 Reduced chi-squared = 0.714464
# Null hypothesis probability of 9.47e-01 with 56 degrees of freedom

Photon flux (15-150 keV)    in 13.44 sec: 1.84061 ( -0.14103  0.14102 ) ph/cm2/s
Energy fluence (15-150 keV)             : 1.72211e-06 ( -1.52145e-07  1.52625e-07 ) ergs/cm2
1-s peak spectrum fit
Power-law model
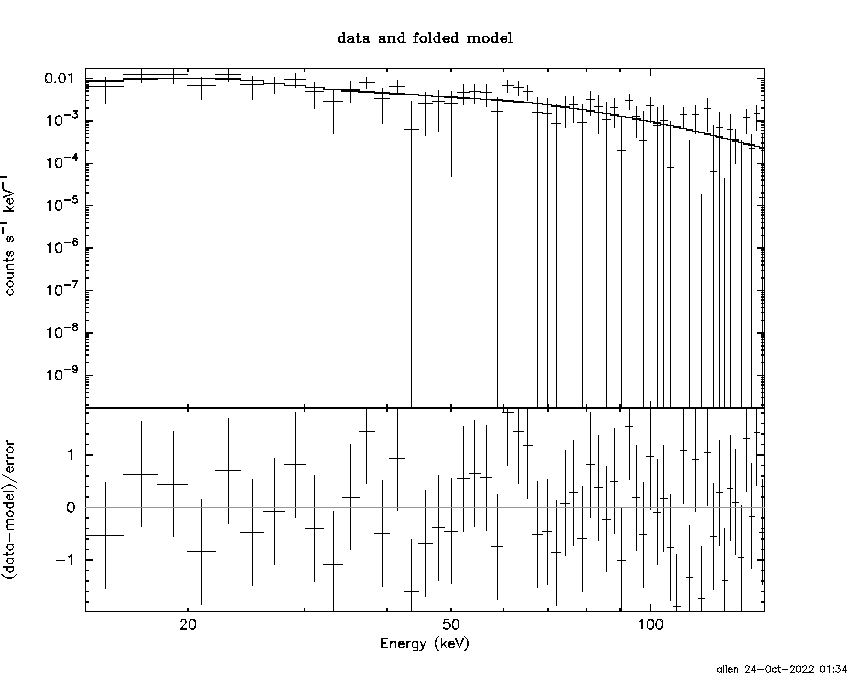
Time interval is from    0.684 sec. to    1.684 sec.

Spectral model in power-law:
------------------------------------------------------------
Parameters  : value       lower 90%   higher 90%
Photon index: -1.54691     ( -0.254002   0.24328 )
Norm@50keV  : 2.59553E-02    ( -0.0040113   0.00397818 )
------------------------------------------------------------
#Fit statistic  : Chi-Squared                   46.14     using 59 bins.
 Reduced chi-squared = 0.809474
# Null hypothesis probability of 8.48e-01 with 57 degrees of freedom

Photon flux (15-150 keV)    in 1 sec: 3.28295 ( -0.50522  0.50601 ) ph/cm2/s
Energy fluence (15-150 keV)             : 2.44489e-07 ( -4.03199e-08  4.0475e-08 ) ergs/cm2
Cutoff power-law model
Time interval is from    0.684 sec. to    1.684 sec.
Spectral model in the cutoff power-law:
------------------------------------------------------------
Parameters  : value       lower 90%   higher 90%
Photon index: -1.29927     ( -0.488773   1.04244 )
Epeak [keV] : 154.407      ( -154.406 -154.406 )
Norm@50keV  : 3.41761E-02    ( -0.025347   0.0701244 )
------------------------------------------------------------
#Fit statistic  : Chi-Squared                   45.91     using 59 bins.
 Reduced chi-squared = 0.819821
# Null hypothesis probability of 8.30e-01 with 56 degrees of freedom

Photon flux (15-150 keV)    in 1 sec: 3.26276 ( -0.51075  0.51114 ) ph/cm2/s
Energy fluence (15-150 keV)             : 2.43461e-07 ( -4.11218e-08  4.09e-08 ) ergs/cm2
Time-resolved spectra
Distribution
T90 vs. Hardness ratio plot
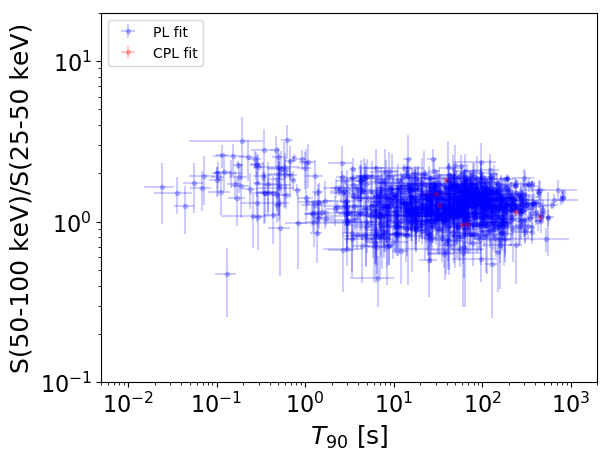
T90                                   = N/A sec.
Hardness ratio (energy fluence ratio) = N/A
S(15-50 keV) vs. S(50-150 keV) plot
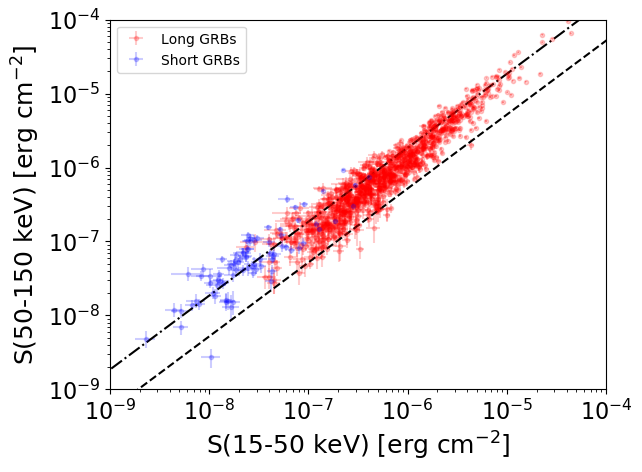
S(15-50 keV)  = N/A
S(50-150 keV) = N/A
The dash-dotted line and the dashed line traces the fluences calculated from the Band function with Epeak = 15 and 150 keV, respectively. Both lines assume a canonical values of alpha = -1 and beta = -2.5.
Mask shadow pattern
IMX = 7.386484562865351E-01, IMY = -5.595721947618852E-01
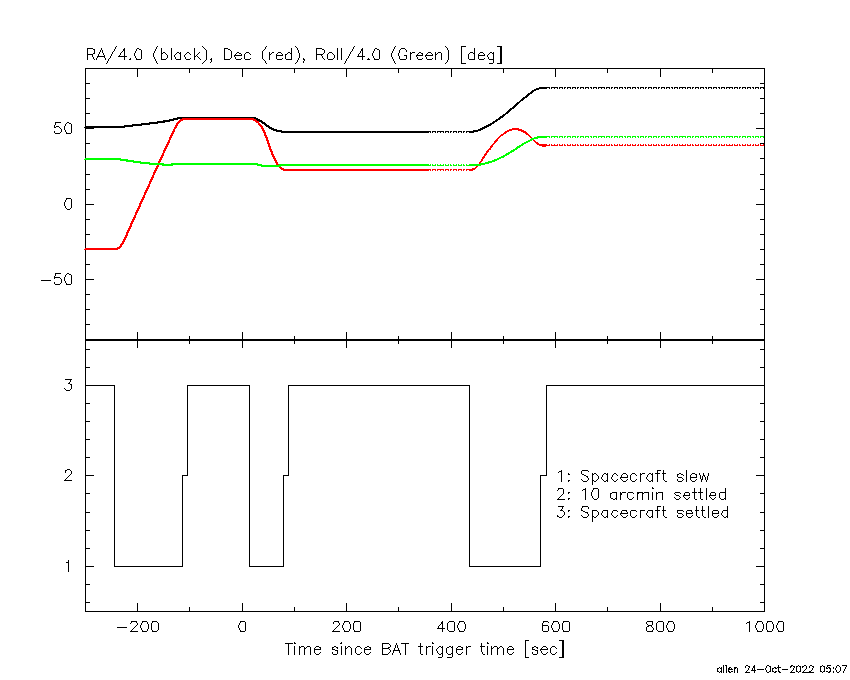
Spacecraft aspect plot
Bright source in the pre-burst/pre-slew/post-slew images
Pre-burst image of 15-350 keV band
Time interval of the image:
-114.859400 -3.896000

# RAcent  DECcent POSerr Theta    Phi  PeakCts   SNR AngSep     Name
#  [deg]    [deg]    ['] [deg]  [deg]                   [']
254.4323  35.3556    1.7  27.1  -67.2   1.4848   7.0    1.5	Her X-1
184.2484  27.7601    2.7  42.6   50.0   1.8258   4.3 ------	UNKNOWN
201.2413  26.1630    2.6  36.1   28.2   1.0829   4.5 ------	UNKNOWN
220.9009  12.3564    3.0  44.4   -5.6   1.0329   3.9 ------	UNKNOWN
259.7799  39.3587    2.7  26.3  -80.1   0.8815   4.2 ------	UNKNOWN
298.8954  51.2945    2.5  39.8 -130.4   1.3655   4.6 ------	UNKNOWN
Pre-slew background subtracted image of 15-350 keV band
Time interval of the image:
-3.896000 9.544000

# RAcent  DECcent POSerr Theta    Phi  PeakCts   SNR AngSep     Name
#  [deg]    [deg]    ['] [deg]  [deg]                   [']
254.4107  35.3709    3.4  27.1  -67.2  -0.2199  -3.4    2.9	Her X-1
192.2769  22.9105    0.6  42.8   37.1   2.8223  19.7 ------	UNKNOWN
252.8949  11.5701    2.1  48.4  -49.0   1.2005   5.4 ------	UNKNOWN
Post-slew image of 15-350 keV band
Time interval of the image:
79.140600 435.540600

# RAcent  DECcent POSerr Theta    Phi  PeakCts   SNR AngSep     Name
#  [deg]    [deg]    ['] [deg]  [deg]                   [']
182.9225 -34.5513    3.2  58.1   -3.8   7.6281   3.6 ------	UNKNOWN
186.1193 -33.5740    3.1  56.8   -6.8   5.7703   3.8 ------	UNKNOWN
255.6687  67.9346    2.3  59.0 -169.8  12.7674   5.1 ------	UNKNOWN
255.2395  47.0453    2.1  55.2 -145.2  11.6758   5.4 ------	UNKNOWN
248.1772  37.1645    2.3  49.7 -133.0   8.2131   5.0 ------	UNKNOWN