Analysis Summary
Notes:
- 1) No attempt has been made to eliminate the non-significant decimal places.
- 2) This batgrbproduct analysis is done using the HEASARC data.
- 3) This batgrbproduct analysis is using the flight position for the mask-weighting calculation.
======================================================================
                  BAT GRB EVENT DATA PROCESSING REPORT
    Process Script Ver: batgrbproduct v2.48
    Process Start Time: Sun Oct 23 23:41:18 EDT 2022
             Host Name: batproc1
   Current Working Dir: /local/data/bat1/alien/Swift_3rdBATcatalog/event/batevent_reproc/trigger1093860
======================================================================

  Trigger: 01093860      Segment: 000

  BAT Trigger Time: 666916168   [s; MET]
      Trigger Stop: 666916232   [s; MET]
               UTC: 2022-02-18T22:28:59.357780    [includes UTCF correction]
       Where From?: TDRSS position message

  BAT
    RA: 133.830146896997   Dec: 31.9839890538763  [deg; J2000]

     Catalogged Source?: NO
     Point Source?:      YES
     GRB Indicated?:     YES    [ by BAT flight software ]
     Image S/N Ratio:    10.61
     Image Trigger?:     YES
     Rate S/N Ratio:     0  [ if not an image trigger ]
     Image S/N Ratio:    10.61

  Analysis Position:   [ source = BAT ]
    RA: 133.830146896997   Dec: 31.9839890538763  [deg; J2000]

  Refined Position:   [ source = BAT pre-slew burst ]
    RA: 133.812141922825   Dec: 31.9677208094888  [deg; J2000]
        { 08h 55m 14.9s , +31d 58' 03.8" }
         +/- 1.56188374398342 [arcmin] (estimated 90% radius based on SNR)
         +/- 0.578133124362304 [arcmin] (formal 1-sigma fit error)
    SNR: 16.0870856144617

  Angular difference between the analysis and refined position is 1.338852 arcmin

  Partial Coding Fraction: 1.015625    [ including projection effects ]

  Duration
     T90: 270.840000033379 +/- 47.9247395934346
        Measured from: 43.3079999685287
                   to: 314.148000001907     [s; relative to TRIGTIME]
     T50: 131.939999938011 +/- 14.978436804039
        Measured from: 87.904000043869
                   to: 219.84399998188     [s; relative to TRIGTIME]


  Fluence
     Peak Flux  (peak 1 second)
        Measured from: 183.240000009537
                   to: 184.240000009537     [s; relative to TRIGTIME]
     Total Fluence
        Measured from: 25.404000043869
                   to: 366.603999972343     [s; relative to TRIGTIME]

             Band 1     Band 2     Band 3     Band 4
              15-25      25-50     50-100    100-350     keV
 Total     2.547016   2.764212   1.823480   0.442707
           0.131602   0.135573   0.117726   0.101643 [error]
 Peak      0.027993   0.040609   0.021192   0.011073
           0.007440   0.007518   0.007061   0.005954 [error]

     [ fluence units of on-axis counts / fully illuminated detector ]

======================================================================


====== Table of the duration information =============================

        Value   tstart    tstop
T100  341.200   25.404  366.604
T90   270.840   43.308  314.148
T50   131.940   87.904  219.844
Peak    1.000  183.240  184.240


====== Spectral Analysis Summary =====================================

Model      : spectral model: simple power-law (PL) and cutoff power-law (CPL)
Ph_index   : photon index: E^{Ph_index}
Ph_90err   : 90% error of the photon index
Epeak      : Epeak in keV
Epeak_90err: 90% error of Epeak
Norm       : normalization at 50 keV in both the PL model and CPL model
Nomr_90err : 90% error of the normalization
chi2       : Chi-Squared
dof        : degree of freedo

=== Time-averaged spectral analysis ===
(Best model with acceptable fit: N/A)

Model Ph_index Ph_90err_low Ph_90err_hi  Epeak  Epeak_90err_low  Epeak_90err_hi  Norm       Nomr_90err_low    Norm_90err_hi    chi2    dof
PL      -1.749    -0.108      0.106       -           -               -         1.32e-03     -8.14e-05          8.07e-05      46.270   57
CPL     -1.595    -0.248      0.426      123.127     -60.128      -123.127      1.60e-03     -3.46e-04          1.05e-03      45.830   56


=== 1-s peak spectral analysis ===
(Best model with acceptable fit: N/A)

Model Ph_index Ph_90err_low Ph_90err_hi  Epeak  Epeak_90err_low  Epeak_90err_hi  Norm       Nomr_90err_low    Norm_90err_hi    chi2    dof
PL      -1.668     -0.437     0.411       -           -               -         5.70e-03     -1.56e-03          1.50e-03      62.110   57
CPL     -1.556     -1.026     5.883      150.133    -150.133      -150.133      6.67e-03     -6.67e-03          4.46e+01      62.120   56


=== Fluence/Peak Flux Summary ===

              Model    Band1     Band2     Band3     Band4     Band5     Total
                       15-25     25-50    50-100    100-350    15-150    15-350    keV
Fluence         PL   7.29e-07  1.15e-06  1.37e-06  3.17e-06  4.17e-06  6.42e-06   erg/cm2
      90%_error_low -6.65e-08 -6.44e-08 -1.16e-07 -5.34e-07 -2.66e-07 -6.40e-07   erg/cm2
      90%_error_hi   6.82e-08  6.44e-08  1.16e-07  6.06e-07  2.68e-07  6.96e-07   erg/cm2
Peak flux       PL   2.76e-01  2.51e-01  1.58e-01  1.52e-01  7.49e-01  8.38e-01   ph/cm2/s
      90%_error_low -9.23e-02 -5.77e-02 -5.50e-02 -8.31e-02 -1.71e-01 -2.00e-01   ph/cm2/s
      90%_error_hi   9.76e-02  5.76e-02  5.61e-02  1.31e-01  1.71e-01  2.05e-01   ph/cm2/s

Fluence        CPL   7.13e-07  1.17e-06  1.37e-06  2.43e-06  4.10e-06  5.68e-06   erg/cm2
      90%_error_low -7.84e-08 -7.70e-08 -1.19e-07 -1.15e-06 -3.12e-07 -1.20e-06   erg/cm2
      90%_error_hi   7.39e-08  8.01e-08  1.20e-07  8.82e-07  3.11e-07  1.37e-06   erg/cm2
Peak flux      CPL   2.75e-01  2.53e-01  1.58e-01  1.41e-01  7.48e-01  8.16e-01   ph/cm2/s
      90%_error_low -1.01e-01 -5.91e-02 -5.47e-02 -1.41e-01 -2.00e-01 -2.68e-01   ph/cm2/s
      90%_error_hi   9.80e-02  1.25e-01  5.69e-02  8.00e-02  1.73e-01  2.23e-01   ph/cm2/s

======================================================================
Image
Pre-slew 15.0-350.0 keV image (Event data)
#   RAcent    DECcent   POSerr    Theta     Phi              Peak Cts       SNR   Name
  133.8121    31.9677   0.0120    13.1836    19.0118         5.9715616     16.087 TRIG_01093860

Foreground time interval of the image:
 25.404 366.604 (delta_t = 341.200 [sec])
Background time interval of the image:
-239.000  25.404 (delta_t = 264.404 [sec])
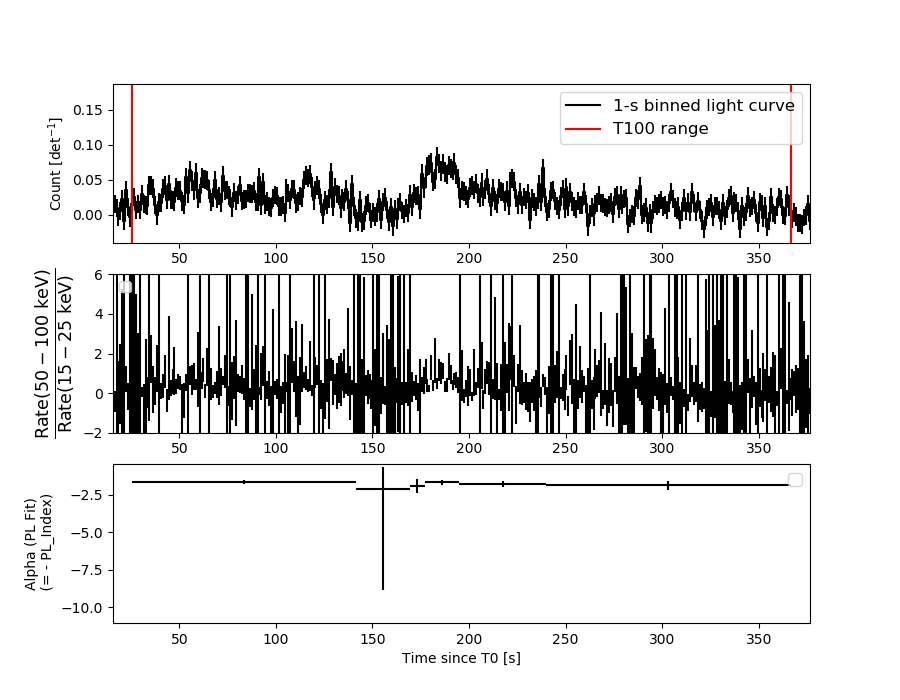
Light Curves
Note: The mask-weighted lightcurves have units of either count/det or counts/sec/det, where a det is 0.4 x 0.4 = 0.16 sq cm.
Full-time range; 1 s binning
Other quick-look light curves:
- 64 ms binning (zoomed)
- 16 ms binning (zoomed)
- 8 ms binning (zoomed)
- 2 ms binning (zoomed)
- SN=5 or 10 s binning (full-time range)
- Raw light curve
Spectra
- 64 ms binning (zoomed)
- 16 ms binning (zoomed)
- 8 ms binning (zoomed)
- 2 ms binning (zoomed)
- SN=5 or 10 s binning (full-time range)
- Raw light curve
Spectra
Notes:
- 1) The fitting includes the systematic errors.
- 2) When the burst includes telescope slew time periods, the fitting uses an average response file made from multiple 5-s response files through out the slew time plus single time preiod for the non-slew times, and weighted by the total counts in the corresponding time period using addrmf. An average response file is needed becuase a spectral fit using the pre-slew DRM will introduce some errors in both a spectral shape and a normalization if the PHA file contains a lot of the slew/post-slew time interval.
- 3) For fits to more complicated models (e.g. a power-law over a cutoff power-law), the BAT team has decided to require a chi-square improvement of more than 6 for each extra dof.
Time averaged spectrum fit using the average DRM
Power-law model
Time interval is from   25.404 sec. to  366.604 sec.

Spectral model in power-law:
------------------------------------------------------------
Parameters  : value       lower 90%   higher 90%
Photon index: -1.74904     ( -0.10782   0.106138 )
Norm@50keV  : 1.32357E-03    ( -8.14243e-05   8.06801e-05 )
------------------------------------------------------------
#Fit statistic  : Chi-Squared                   46.27     using 59 bins.
 Reduced chi-squared = 0.811754
# Null hypothesis probability of 8.44e-01 with 57 degrees of freedom

Photon flux (15-150 keV)    in 341.2 sec: 0.178914 ( -0.010132  0.010151 ) ph/cm2/s
Energy fluence (15-150 keV)             : 4.16793e-06 ( -2.65823e-07  2.68454e-07 ) ergs/cm2
Cutoff power-law model
Time interval is from   25.404 sec. to  366.604 sec.
Spectral model in the cutoff power-law:
------------------------------------------------------------
Parameters  : value       lower 90%   higher 90%
Photon index: -1.59489     ( -0.247881   0.425957 )
Epeak [keV] : 123.127      ( -60.1284 -123.127 )
Norm@50keV  : 1.59656E-03    ( -0.000345988   0.00105177 )
------------------------------------------------------------
#Fit statistic  : Chi-Squared                   45.83     using 59 bins.
 Reduced chi-squared = 0.818393
# Null hypothesis probability of 8.32e-01 with 56 degrees of freedom

Photon flux (15-150 keV)    in 341.2 sec: 0.177292 ( -0.010929  0.010914 ) ph/cm2/s
Energy fluence (15-150 keV)             : 4.10269e-06 ( -3.12344e-07  3.10564e-07 ) ergs/cm2
1-s peak spectrum fit
Power-law model

Time interval is from  183.240 sec. to  184.240 sec.

Spectral model in power-law:
------------------------------------------------------------
Parameters  : value       lower 90%   higher 90%
Photon index: -1.66808     ( -0.437334   0.411371 )
Norm@50keV  : 5.70302E-03    ( -0.00156235   0.0014979 )
------------------------------------------------------------
#Fit statistic  : Chi-Squared                   62.11     using 59 bins.
 Reduced chi-squared = 1.08965
# Null hypothesis probability of 2.99e-01 with 57 degrees of freedom

Photon flux (15-150 keV)    in 1 sec: 0.749203 ( -0.171452  0.171453 ) ph/cm2/s
Energy fluence (15-150 keV)             : 5.29578e-08 ( -1.48442e-08  1.561e-08 ) ergs/cm2
Cutoff power-law model
Time interval is from  183.240 sec. to  184.240 sec.
Spectral model in the cutoff power-law:
------------------------------------------------------------
Parameters  : value       lower 90%   higher 90%
Photon index: -1.55562     ( -1.00256   5.90668 )
Epeak [keV] : 150.133      ( -211.447 -211.447 )
Norm@50keV  : 6.66797E-03    ( -0.0062089   44.5662 )
------------------------------------------------------------
#Fit statistic  : Chi-Squared                   62.12     using 59 bins.
 Reduced chi-squared = 1.10929
# Null hypothesis probability of 2.67e-01 with 56 degrees of freedom

Photon flux (15-150 keV)    in 1 sec: 0.747865 ( -0.199512  0.172734 ) ph/cm2/s
Energy fluence (15-150 keV)             : 5.26393e-08 ( -2.45106e-08  1.57597e-08 ) ergs/cm2
Time-resolved spectra
Distribution
T90 vs. Hardness ratio plot
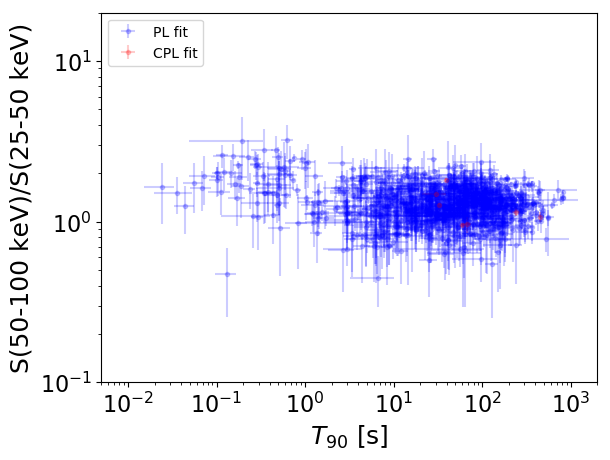
T90                                   = N/A sec.
Hardness ratio (energy fluence ratio) = N/A
S(15-50 keV) vs. S(50-150 keV) plot
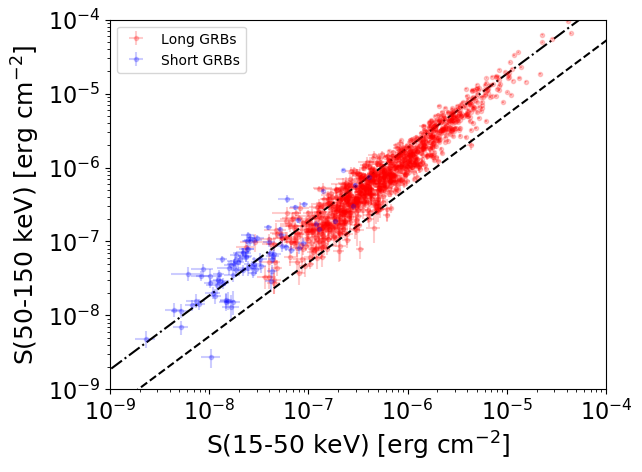
S(15-50 keV)  = N/A
S(50-150 keV) = N/A
The dash-dotted line and the dashed line traces the fluences calculated from the Band function with Epeak = 15 and 150 keV, respectively. Both lines assume a canonical values of alpha = -1 and beta = -2.5.
Mask shadow pattern
IMX = 2.214689011210084E-01, IMY = -7.630873196229848E-02
Spacecraft aspect plot
Bright source in the pre-burst/pre-slew/post-slew images
Pre-burst image of 15-350 keV band
Time interval of the image:
-239.000000 25.404000

# RAcent  DECcent POSerr Theta    Phi  PeakCts   SNR AngSep     Name
#  [deg]    [deg]    ['] [deg]  [deg]                   [']
 83.6436  22.0083    0.9  36.6 -107.0  10.7128  13.5    0.7	Crab
 91.6639  12.2427    3.3  31.8 -127.5   1.7310   3.5 ------	UNKNOWN
 88.8389   7.7731    2.8  36.3 -132.6   2.2338   4.1 ------	UNKNOWN
121.8695  79.5268    2.3  56.9  -24.1   8.7095   5.1 ------	UNKNOWN
 91.1068  71.1391    2.9  51.9  -36.5   6.0094   4.0 ------	UNKNOWN
Pre-slew background subtracted image of 15-350 keV band
Time interval of the image:
25.404000 366.604000

# RAcent  DECcent POSerr Theta    Phi  PeakCts   SNR AngSep     Name
#  [deg]    [deg]    ['] [deg]  [deg]                   [']
 83.6541  21.9774    5.3  36.6 -107.1   1.8453   2.2    2.5	Crab
133.8121  31.9677    0.7  13.2   19.0   5.9715  16.1 ------	UNKNOWN
135.1752  65.0662    1.9  43.1  -16.5   3.8441   6.1 ------	UNKNOWN
Post-slew image of 15-350 keV band
Time interval of the image:
744.500610 963.102200

# RAcent  DECcent POSerr Theta    Phi  PeakCts   SNR AngSep     Name
#  [deg]    [deg]    ['] [deg]  [deg]                   [']
244.9660 -15.6305    1.0  32.8   75.4   6.7615  12.1    1.0	Sco X-1
254.3690  35.3152    8.1  52.6  150.7   2.1973   1.4    4.6	Her X-1
256.1161 -38.0301    0.0  32.8   29.3  -0.4451  -0.9   12.7	4U 1700-377
256.4683 -36.4962   14.2  31.5   31.0   0.3692   0.8    4.7	GX 349+2
263.0663 -24.8142   12.2  19.5   42.4  -0.3178  -0.9    5.2	GX 1+4
264.6543 -44.3601    4.0  34.5   13.3   1.2741   2.9    6.6	4U 1735-44
268.3724  -1.4441  179.1  14.6  131.1  -0.0211  -0.1    0.6	SW J1753.5-0127
270.2026 -24.9187   21.8  15.1   26.0   0.1532   0.5   10.6	GX 5-1
270.1313 -25.8721   10.2  16.0   24.3   0.3289   1.1   12.1	GRS 1758-258
273.8441 -14.1055    9.5   5.1   60.6  -0.3651  -1.2   10.3	GX 17+2
275.9219 -30.3705   16.2  18.5    2.9   0.2333   0.7    0.3	H1820-303
285.1916 -25.0265   12.6  14.5  -29.1  -0.2897  -0.9   10.6	HT1900.1-2455
288.7847  10.9437   21.6  25.1 -160.1   0.1712   0.5    0.8	GRS 1915+105
299.5992  35.1998    1.1  51.2 -162.2   7.9103  10.2    0.5	Cyg X-1
308.1447  40.9203    9.0  59.6 -158.7  -3.3608  -1.3    2.5	Cyg X-3
262.9629 -33.7687    4.8  26.0   26.3   0.8452   2.4    4.2	GX 354-0
299.0015  15.9368    2.9  34.5 -148.0   1.6307   3.9 ------	UNKNOWN
299.0269  38.2628    3.8  53.8 -164.5   2.7250   3.0 ------	UNKNOWN
322.2335 -32.3400    2.8  44.8  -60.2   5.9867   4.1 ------	UNKNOWN