Analysis Summary
Notes:
- 1) No attempt has been made to eliminate the non-significant decimal places.
- 2) This batgrbproduct analysis is done using the HEASARC data.
- 3) This batgrbproduct analysis is using the flight position for the mask-weighting calculation.
======================================================================
BAT GRB EVENT DATA PROCESSING REPORT
Process Script Ver: batgrbproduct v2.48
Process Start Time: Sun Oct 23 23:39:57 EDT 2022
Host Name: batproc1
Current Working Dir: /local/data/bat1/alien/Swift_3rdBATcatalog/event/batevent_reproc/trigger1094950
======================================================================
Trigger: 01094950 Segment: 000
BAT Trigger Time: 667899648.192 [s; MET]
Trigger Stop: 667899652.288 [s; MET]
UTC: 2022-03-02T07:40:19.483320 [includes UTCF correction]
Where From?: TDRSS position message
BAT
RA: 301.431936947381 Dec: 49.3889348270439 [deg; J2000]
Catalogged Source?: NO
Point Source?: YES
GRB Indicated?: YES [ by BAT flight software ]
Image S/N Ratio: 7.47
Image Trigger?: NO
Rate S/N Ratio: 9.79795897113271 [ if not an image trigger ]
Image S/N Ratio: 7.47
Analysis Position: [ source = BAT ]
RA: 301.431936947381 Dec: 49.3889348270439 [deg; J2000]
Refined Position: [ source = BAT pre-slew burst ]
RA: 301.398540470341 Dec: 49.4074921603604 [deg; J2000]
{ 20h 05m 35.6s , +49d 24' 27.0" }
+/- 2.73845148288855 [arcmin] (estimated 90% radius based on SNR)
+/- 1.22395091858171 [arcmin] (formal 1-sigma fit error)
SNR: 7.2129208136069
Angular difference between the analysis and refined position is 1.714737 arcmin
Partial Coding Fraction: 0.4453125 [ including projection effects ]
Duration
T90: 6.59200000762939 +/- 2.09326531433751
Measured from: -1.56000006198883
to: 5.03199994564056 [s; relative to TRIGTIME]
T50: 2.73600006103516 +/- 1.3268428140899
Measured from: 0.615999937057495
to: 3.35199999809265 [s; relative to TRIGTIME]
Fluence
Peak Flux (peak 1 second)
Measured from: 0.363999962806702
to: 1.3639999628067 [s; relative to TRIGTIME]
Total Fluence
Measured from: -1.86400008201599
to: 5.38399994373322 [s; relative to TRIGTIME]
Band 1 Band 2 Band 3 Band 4
15-25 25-50 50-100 100-350 keV
Total 0.176902 0.154039 0.183094 0.030558
0.035265 0.036764 0.032858 0.029864 [error]
Peak 0.043073 0.038558 0.056087 0.021156
0.013544 0.014177 0.013025 0.010980 [error]
[ fluence units of on-axis counts / fully illuminated detector ]
======================================================================
====== Table of the duration information =============================
Value tstart tstop
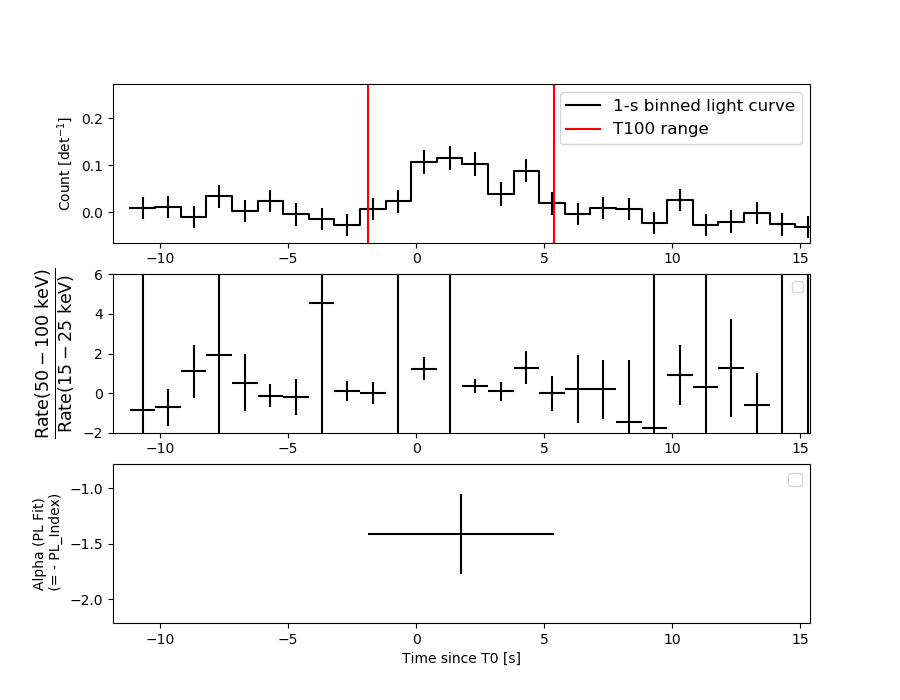
T100 7.248 -1.864 5.384
T90 6.592 -1.560 5.032
T50 2.736 0.616 3.352
Peak 1.000 0.364 1.364
====== Spectral Analysis Summary =====================================
Model : spectral model: simple power-law (PL) and cutoff power-law (CPL)
Ph_index : photon index: E^{Ph_index}
Ph_90err : 90% error of the photon index
Epeak : Epeak in keV
Epeak_90err: 90% error of Epeak
Norm : normalization at 50 keV in both the PL model and CPL model
Nomr_90err : 90% error of the normalization
chi2 : Chi-Squared
dof : degree of freedo
=== Time-averaged spectral analysis ===
(Best model with acceptable fit: N/A)
Model Ph_index Ph_90err_low Ph_90err_hi Epeak Epeak_90err_low Epeak_90err_hi Norm Nomr_90err_low Norm_90err_hi chi2 dof
PL -1.409 -0.361 0.362 - - - 5.21e-03 -1.04e-03 1.04e-03 49.180 57
CPL -1.347 -3.087 1.336 556.909 -556.909 -556.909 5.58e-03 -1.39e-03 -5.58e-03 49.210 56
=== 1-s peak spectral analysis ===
(Best model with acceptable fit: N/A)
Model Ph_index Ph_90err_low Ph_90err_hi Epeak Epeak_90err_low Epeak_90err_hi Norm Nomr_90err_low Norm_90err_hi chi2 dof
PL -1.322 -0.461 0.485 - - - 1.08e-02 -2.82e-03 2.83e-03 44.130 57
CPL -1.326 -0.457 0.495 9999.350 -9999.350 -9999.350 1.08e-02 -2.81e-03 2.86e-03 44.140 56
=== Fluence/Peak Flux Summary ===
Model Band1 Band2 Band3 Band4 Band5 Total
15-25 25-50 50-100 100-350 15-150 15-350 keV
Fluence PL 4.43e-08 8.61e-08 1.30e-07 4.23e-07 3.64e-07 6.83e-07 erg/cm2
90%_error_low -1.54e-08 -1.92e-08 -3.27e-08 -1.94e-07 -7.89e-08 -2.23e-07 erg/cm2
90%_error_hi 1.70e-08 1.86e-08 3.19e-08 2.82e-07 7.96e-08 2.94e-07 erg/cm2
Peak flux PL 3.75e-01 4.20e-01 3.36e-01 4.46e-01 1.30e+00 1.58e+00 ph/cm2/s
90%_error_low -1.78e-01 -1.36e-01 -1.01e-01 -2.30e-01 -3.61e-01 -4.15e-01 ph/cm2/s
90%_error_hi 2.06e-01 1.30e-01 9.79e-02 3.42e-01 3.64e-01 4.17e-01 ph/cm2/s
Fluence CPL 4.54e-08 8.58e-08 1.29e-07 4.33e-07 3.65e-07 6.42e-07 erg/cm2
90%_error_low -1.98e-08 -1.89e-08 -3.23e-08 -3.44e-07 -7.58e-08 -3.07e-07 erg/cm2
90%_error_hi 1.83e-08 2.14e-08 3.69e-08 1.42e-07 6.75e-08 3.20e-07 erg/cm2
Peak flux CPL 3.93e-01 4.11e-01 3.27e-01 4.43e-01 1.31e+00 1.66e+00 ph/cm2/s
90%_error_low N/A N/A -3.27e-01 N/A N/A -1.66e+00 ph/cm2/s
90%_error_hi N/A N/A 1.46e-01 N/A N/A 4.46e-01 ph/cm2/s
======================================================================
Image
Pre-slew 15.0-350.0 keV image (Event data)
#   RAcent    DECcent   POSerr    Theta     Phi              Peak Cts       SNR   Name
  301.3985    49.4075   0.0267    41.3484   -21.8456         0.5387006      7.213 TRIG_01094950

Foreground time interval of the image:
 -1.864   5.384 (delta_t =   7.248 [sec])
Background time interval of the image:
-239.192  -1.864 (delta_t = 237.328 [sec])
Light Curves
Note: The mask-weighted lightcurves have units of either count/det or counts/sec/det, where a det is 0.4 x 0.4 = 0.16 sq cm.
Full-time range; 1 s binning
Other quick-look light curves:
- 64 ms binning (zoomed)
- 16 ms binning (zoomed)
- 8 ms binning (zoomed)
- 2 ms binning (zoomed)
- SN=5 or 10 s binning (full-time range)
- Raw light curve
Spectra
- 64 ms binning (zoomed)
- 16 ms binning (zoomed)
- 8 ms binning (zoomed)
- 2 ms binning (zoomed)
- SN=5 or 10 s binning (full-time range)
- Raw light curve
Spectra
Notes:
- 1) The fitting includes the systematic errors.
- 2) When the burst includes telescope slew time periods, the fitting uses an average response file made from multiple 5-s response files through out the slew time plus single time preiod for the non-slew times, and weighted by the total counts in the corresponding time period using addrmf. An average response file is needed becuase a spectral fit using the pre-slew DRM will introduce some errors in both a spectral shape and a normalization if the PHA file contains a lot of the slew/post-slew time interval.
- 3) For fits to more complicated models (e.g. a power-law over a cutoff power-law), the BAT team has decided to require a chi-square improvement of more than 6 for each extra dof.
Time averaged spectrum fit using the average DRM
Power-law model

Time interval is from   -1.864 sec. to    5.384 sec.

Spectral model in power-law:
------------------------------------------------------------
Parameters  : value       lower 90%   higher 90%
Photon index: -1.40921     ( -0.360645   0.361643 )
Norm@50keV  : 5.21334E-03    ( -0.00103793   0.00103505 )
------------------------------------------------------------
#Fit statistic  : Chi-Squared                   49.18     using 59 bins.
 Reduced chi-squared = 0.862807
# Null hypothesis probability of 7.60e-01 with 57 degrees of freedom

Photon flux (15-150 keV)    in 7.248 sec: 0.636239 ( -0.131284  0.132025 ) ph/cm2/s
Energy fluence (15-150 keV)             : 3.64484e-07 ( -7.89032e-08  7.96439e-08 ) ergs/cm2
Cutoff power-law model
Time interval is from   -1.864 sec. to    5.384 sec.
Spectral model in the cutoff power-law:
------------------------------------------------------------
Parameters  : value       lower 90%   higher 90%
Photon index: -1.40635     ( -3.01609   1.40669 )
Epeak [keV] : 1.00000E+04      ( -10000 -10000 )
Norm@50keV  : 5.23176E-03    ( -0.00104327   -0.00523179 )
------------------------------------------------------------
#Fit statistic  : Chi-Squared                   49.18     using 59 bins.
 Reduced chi-squared = 0.878214
# Null hypothesis probability of 7.29e-01 with 56 degrees of freedom

Photon flux (15-150 keV)    in 7.248 sec: 0.639194 ( -0.145695  0.136288 ) ph/cm2/s
Energy fluence (15-150 keV)             : 3.65038e-07 ( -7.58054e-08  6.75136e-08 ) ergs/cm2
1-s peak spectrum fit
Power-law model
Time interval is from    0.364 sec. to    1.364 sec.

Spectral model in power-law:
------------------------------------------------------------
Parameters  : value       lower 90%   higher 90%
Photon index: -1.3224     ( -0.461171   0.484881 )
Norm@50keV  : 1.08146E-02    ( -0.00282423   0.00282662 )
------------------------------------------------------------
#Fit statistic  : Chi-Squared                   44.13     using 59 bins.
 Reduced chi-squared = 0.774211
# Null hypothesis probability of 8.94e-01 with 57 degrees of freedom

Photon flux (15-150 keV)    in 1 sec: 1.29570 ( -0.361279  0.36386 ) ph/cm2/s
Energy fluence (15-150 keV)             : 1.06309e-07 ( -2.94048e-08  2.95536e-08 ) ergs/cm2
Cutoff power-law model

Time interval is from    0.364 sec. to    1.364 sec.
Spectral model in the cutoff power-law:
------------------------------------------------------------
Parameters  : value       lower 90%   higher 90%
Photon index: -1.32582     ( -0.458369   0.493864 )
Epeak [keV] : 9999.35      ( -9999.36 -9999.36 )
Norm@50keV  : 1.08375E-02    ( -0.00283563   0.00283616 )
------------------------------------------------------------
#Fit statistic  : Chi-Squared                   44.14     using 59 bins.
 Reduced chi-squared = 0.788214
# Null hypothesis probability of 8.74e-01 with 56 degrees of freedom

Photon flux (15-150 keV)    in 1 sec: 1.30568 (    ) ph/cm2/s
Energy fluence (15-150 keV)             : 1.06574e-07 ( -3.08524e-08  2.55312e-08 ) ergs/cm2
Time-resolved spectra
Distribution
T90 vs. Hardness ratio plot
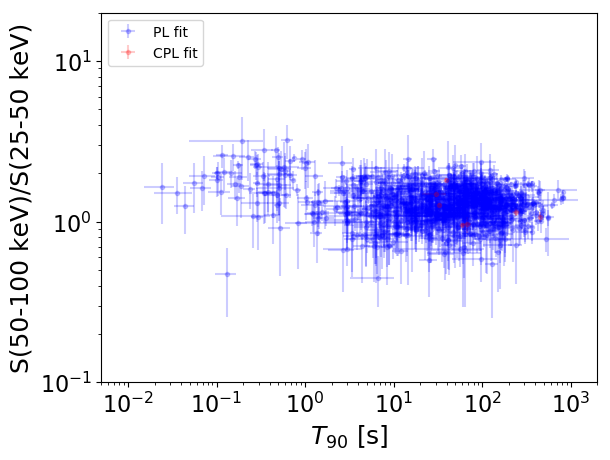
T90                                   = N/A sec.
Hardness ratio (energy fluence ratio) = N/A
S(15-50 keV) vs. S(50-150 keV) plot
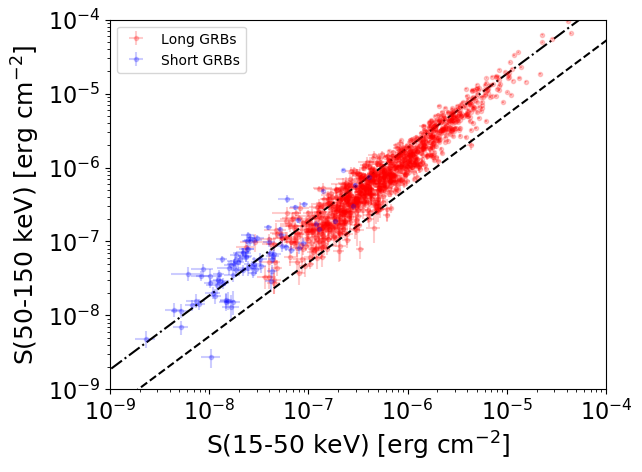
S(15-50 keV)  = N/A
S(50-150 keV) = N/A
The dash-dotted line and the dashed line traces the fluences calculated from the Band function with Epeak = 15 and 150 keV, respectively. Both lines assume a canonical values of alpha = -1 and beta = -2.5.
Mask shadow pattern
IMX = 8.168240404729624E-01, IMY = 3.274607089242439E-01
Spacecraft aspect plot
Bright source in the pre-burst/pre-slew/post-slew images
Pre-burst image of 15-350 keV band
Time interval of the image:
-239.192000 -1.864000

# RAcent  DECcent POSerr Theta    Phi  PeakCts   SNR AngSep     Name
#  [deg]    [deg]    ['] [deg]  [deg]                   [']
299.5900  35.1928    1.5  53.3  -32.4  13.0518   7.6    0.5	Cyg X-1
308.1752  40.8870    5.1  44.8  -35.3   1.6849   2.3    4.9	Cyg X-3
326.3636  38.1659    0.0  38.6  -54.7  -0.6885  -1.0   13.0	Cyg X-2
105.7542  59.6679    2.5  39.9  102.1   4.4357   4.5 ------	UNKNOWN
144.4215  73.1973    3.8  40.1   70.9   3.5548   3.1 ------	UNKNOWN
Pre-slew background subtracted image of 15-350 keV band
Time interval of the image:
-1.864000 5.384000

# RAcent  DECcent POSerr Theta    Phi  PeakCts   SNR AngSep     Name
#  [deg]    [deg]    ['] [deg]  [deg]                   [']
299.5327  35.1982    4.3  53.4  -32.4  -0.5719  -2.6    2.8	Cyg X-1
308.1377  40.8638    6.0  44.8  -35.2  -0.1799  -1.9    5.5	Cyg X-3
326.0590  38.3661    2.9  38.5  -54.2   0.3172   4.1    5.9	Cyg X-2
301.3990  49.4077    1.6  41.3  -21.8   0.5382   7.2 ------	UNKNOWN
342.2822  37.9208    2.3  32.1  -73.3   0.3430   5.1 ------	UNKNOWN
Post-slew image of 15-350 keV band
Time interval of the image:
621.108630 962.876000

# RAcent  DECcent POSerr Theta    Phi  PeakCts   SNR AngSep     Name
#  [deg]    [deg]    ['] [deg]  [deg]                   [']
 83.6418  22.0035    0.8  36.0  126.6  11.5168  13.7    0.8	Crab
348.1361  42.0443    2.5  43.4  -50.4   5.1995   4.6 ------	UNKNOWN