Analysis Summary
Notes:
- 1) No attempt has been made to eliminate the non-significant decimal places.
- 2) This batgrbproduct analysis is done using the HEASARC data.
- 3) This batgrbproduct analysis is using the flight position for the mask-weighting calculation.
======================================================================
BAT GRB EVENT DATA PROCESSING REPORT
Process Script Ver: batgrbproduct v2.48
Process Start Time: Sun Oct 23 23:38:29 EDT 2022
Host Name: batproc1
Current Working Dir: /local/data/bat1/alien/Swift_3rdBATcatalog/event/batevent_reproc/trigger1095215
======================================================================
Trigger: 01095215 Segment: 000
BAT Trigger Time: 668189617.344 [s; MET]
Trigger Stop: 668189618.368 [s; MET]
UTC: 2022-03-05T16:13:08.615740 [includes UTCF correction]
Where From?: TDRSS position message
BAT
RA: 107.584441518432 Dec: -37.708465082534 [deg; J2000]
Catalogged Source?: NO
Point Source?: YES
GRB Indicated?: YES [ by BAT flight software ]
Image S/N Ratio: 7.18
Image Trigger?: NO
Rate S/N Ratio: 14 [ if not an image trigger ]
Image S/N Ratio: 7.18
Analysis Position: [ source = BAT ]
RA: 107.584441518432 Dec: -37.708465082534 [deg; J2000]
Refined Position: [ source = BAT pre-slew burst ]
RA: 107.608224012885 Dec: -37.7006078126076 [deg; J2000]
{ 07h 10m 26.0s , -37d 42' 02.2" }
+/- 1.49808242785694 [arcmin] (estimated 90% radius based on SNR)
+/- 0.59284396395132 [arcmin] (formal 1-sigma fit error)
SNR: 17.074699930472
Angular difference between the analysis and refined position is 1.223445 arcmin
Partial Coding Fraction: 0.2539062 [ including projection effects ]
Duration
T90: 28 +/- 5.3851648071345
Measured from: -9.34399998188019
to: 18.6560000181198 [s; relative to TRIGTIME]
T50: 11 +/- 3.60555127546399
Measured from: -5.34399998188019
to: 5.65600001811981 [s; relative to TRIGTIME]
Fluence
Peak Flux (peak 1 second)
Measured from: -0.343999981880188
to: 0.656000018119812 [s; relative to TRIGTIME]
Total Fluence
Measured from: -10.3439999818802
to: 21.6560000181198 [s; relative to TRIGTIME]
Band 1 Band 2 Band 3 Band 4
15-25 25-50 50-100 100-350 keV
Total 0.964491 1.344452 0.891096 0.325929
0.093715 0.099411 0.086990 0.075447 [error]
Peak 0.052734 0.109153 0.063392 0.052349
0.017919 0.019970 0.018125 0.015663 [error]
[ fluence units of on-axis counts / fully illuminated detector ]
======================================================================
====== Table of the duration information =============================
Value tstart tstop
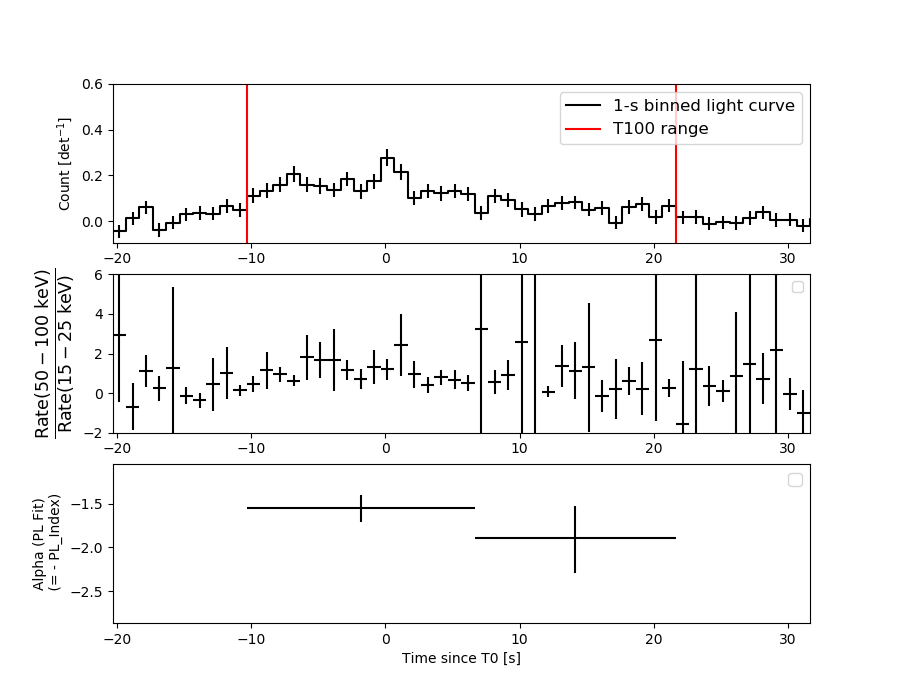
T100 32.000 -10.344 21.656
T90 28.000 -9.344 18.656
T50 11.000 -5.344 5.656
Peak 1.000 -0.344 0.656
====== Spectral Analysis Summary =====================================
Model : spectral model: simple power-law (PL) and cutoff power-law (CPL)
Ph_index : photon index: E^{Ph_index}
Ph_90err : 90% error of the photon index
Epeak : Epeak in keV
Epeak_90err: 90% error of Epeak
Norm : normalization at 50 keV in both the PL model and CPL model
Nomr_90err : 90% error of the normalization
chi2 : Chi-Squared
dof : degree of freedo
=== Time-averaged spectral analysis ===
(Best model with acceptable fit: N/A)
Model Ph_index Ph_90err_low Ph_90err_hi Epeak Epeak_90err_low Epeak_90err_hi Norm Nomr_90err_low Norm_90err_hi chi2 dof
PL -1.649 -0.151 0.149 - - - 7.35e-03 -6.52e-04 6.46e-04 51.770 57
CPL -1.581 -0.733 0.585 271.895 -271.895 -271.895 7.98e-03 -4.62e-03 7.87e-03 51.750 56
=== 1-s peak spectral analysis ===
(Best model with acceptable fit: N/A)
Model Ph_index Ph_90err_low Ph_90err_hi Epeak Epeak_90err_low Epeak_90err_hi Norm Nomr_90err_low Norm_90err_hi chi2 dof
PL -1.581 -0.401 0.376 - - - 1.47e-02 -3.88e-03 3.82e-03 73.310 57
CPL -0.043 -1.629 3.772 59.925 -19.418 -59.925 9.71e-02 -9.71e-02 1.62e+01 70.750 56
=== Fluence/Peak Flux Summary ===
Model Band1 Band2 Band3 Band4 Band5 Total
15-25 25-50 50-100 100-350 15-150 15-350 keV
Fluence PL 3.46e-07 5.80e-07 7.40e-07 1.89e-06 2.19e-06 3.56e-06 erg/cm2
90%_error_low -4.71e-08 -4.96e-08 -8.73e-08 -4.31e-07 -2.05e-07 -5.12e-07 erg/cm2
90%_error_hi 4.87e-08 4.95e-08 8.70e-08 5.10e-07 2.07e-07 5.73e-07 erg/cm2
Peak flux PL 6.56e-01 6.29e-01 4.21e-01 4.38e-01 1.88e+00 2.14e+00 ph/cm2/s
90%_error_low -2.35e-01 -1.61e-01 -1.35e-01 -2.21e-01 -4.71e-01 -5.39e-01 ph/cm2/s
90%_error_hi 2.57e-01 1.60e-01 1.34e-01 3.12e-01 4.72e-01 5.44e-01 ph/cm2/s
Fluence CPL 3.21e-07 4.37e-07 4.58e-07 1.08e-06 1.51e-06 2.29e-06 erg/cm2
90%_error_low -6.39e-08 -8.13e-08 -5.87e-08 -1.90e-07 -2.22e-07 -4.28e-07 erg/cm2
90%_error_hi 5.96e-08 6.87e-08 5.11e-08 1.66e-07 1.84e-07 3.98e-07 erg/cm2
Peak flux CPL 5.28e-01 7.44e-01 4.61e-01 1.09e-01 1.82e+00 1.84e+00 ph/cm2/s
90%_error_low -2.60e-01 -2.09e-01 -2.14e-01 -1.09e-01 -4.76e-01 -4.94e-01 ph/cm2/s
90%_error_hi 2.90e-01 2.51e-01 1.70e-01 4.00e-01 4.77e-01 5.40e-01 ph/cm2/s
======================================================================
Image
Pre-slew 15.0-350.0 keV image (Event data)
#   RAcent    DECcent   POSerr    Theta     Phi              Peak Cts       SNR   Name
  107.6082   -37.7006   0.0113    38.1023   -67.8705         3.7287540     17.075 TRIG_01095215

Foreground time interval of the image:
-10.344  21.656 (delta_t =  32.000 [sec])
Background time interval of the image:
-239.344 -10.344 (delta_t = 229.000 [sec])
Light Curves
Note: The mask-weighted lightcurves have units of either count/det or counts/sec/det, where a det is 0.4 x 0.4 = 0.16 sq cm.
Full-time range; 1 s binning
Other quick-look light curves:
- 64 ms binning (zoomed)
- 16 ms binning (zoomed)
- 8 ms binning (zoomed)
- 2 ms binning (zoomed)
- SN=5 or 10 s binning (full-time range)
- Raw light curve
Spectra
- 64 ms binning (zoomed)
- 16 ms binning (zoomed)
- 8 ms binning (zoomed)
- 2 ms binning (zoomed)
- SN=5 or 10 s binning (full-time range)
- Raw light curve
Spectra
Notes:
- 1) The fitting includes the systematic errors.
- 2) When the burst includes telescope slew time periods, the fitting uses an average response file made from multiple 5-s response files through out the slew time plus single time preiod for the non-slew times, and weighted by the total counts in the corresponding time period using addrmf. An average response file is needed becuase a spectral fit using the pre-slew DRM will introduce some errors in both a spectral shape and a normalization if the PHA file contains a lot of the slew/post-slew time interval.
- 3) For fits to more complicated models (e.g. a power-law over a cutoff power-law), the BAT team has decided to require a chi-square improvement of more than 6 for each extra dof.
Time averaged spectrum fit using the average DRM
Power-law model
Time interval is from  -10.344 sec. to   21.656 sec.

Spectral model in power-law:
------------------------------------------------------------
Parameters  : value       lower 90%   higher 90%
Photon index: -1.6495     ( -0.151307   0.148929 )
Norm@50keV  : 7.35413E-03    ( -0.000652369   0.00064636 )
------------------------------------------------------------
#Fit statistic  : Chi-Squared                   51.77     using 59 bins.
 Reduced chi-squared = 0.908246
# Null hypothesis probability of 6.71e-01 with 57 degrees of freedom

Photon flux (15-150 keV)    in 32 sec: 0.960149 ( -0.081933  0.082081 ) ph/cm2/s
Energy fluence (15-150 keV)             : 2.18907e-06 ( -2.05354e-07  2.07332e-07 ) ergs/cm2
Cutoff power-law model
Time interval is from  -10.344 sec. to   21.656 sec.
Spectral model in the cutoff power-law:
------------------------------------------------------------
Parameters  : value       lower 90%   higher 90%
Photon index: -1.58113     ( -0.731281   0.587016 )
Epeak [keV] : 271.895      ( -306.414 -306.414 )
Norm@50keV  : 7.98460E-03    ( -0.00458791   0.00789829 )
------------------------------------------------------------
#Fit statistic  : Chi-Squared                   51.75     using 59 bins.
 Reduced chi-squared = 0.924107
# Null hypothesis probability of 6.36e-01 with 56 degrees of freedom

Photon flux (15-150 keV)    in 32 sec: 0.957452 ( -0.084819  0.083808 ) ph/cm2/s
Energy fluence (15-150 keV)             : 1.51109e-06 ( -2.22364e-07  1.84108e-07 ) ergs/cm2
1-s peak spectrum fit
Power-law model
Time interval is from   -0.344 sec. to    0.656 sec.

Spectral model in power-law:
------------------------------------------------------------
Parameters  : value       lower 90%   higher 90%
Photon index: -1.58127     ( -0.400593   0.376793 )
Norm@50keV  : 1.47471E-02    ( -0.00388297   0.00382088 )
------------------------------------------------------------
#Fit statistic  : Chi-Squared                   73.31     using 59 bins.
 Reduced chi-squared = 1.28614
# Null hypothesis probability of 7.17e-02 with 57 degrees of freedom

Photon flux (15-150 keV)    in 1 sec: 1.88437 ( -0.47139  0.47223 ) ph/cm2/s
Energy fluence (15-150 keV)             : 1.38242e-07 ( -3.81222e-08  3.89606e-08 ) ergs/cm2
Cutoff power-law model
Time interval is from   -0.344 sec. to    0.656 sec.
Spectral model in the cutoff power-law:
------------------------------------------------------------
Parameters  : value       lower 90%   higher 90%
Photon index: -0.0433042     ( -1.62907   3.77147 )
Epeak [keV] : 59.9251      ( -19.4106 -59.9175 )
Norm@50keV  : 9.70587E-02    ( -0.0971181   16.2215 )
------------------------------------------------------------
#Fit statistic  : Chi-Squared                   70.75     using 59 bins.
 Reduced chi-squared = 1.26339
# Null hypothesis probability of 8.87e-02 with 56 degrees of freedom

Photon flux (15-150 keV)    in 1 sec: 1.82230 ( -0.47638  0.47748 ) ph/cm2/s
Energy fluence (15-150 keV)             : 1.26567e-07 ( -4.19788e-08  4.22943e-08 ) ergs/cm2
Time-resolved spectra
Distribution
T90 vs. Hardness ratio plot
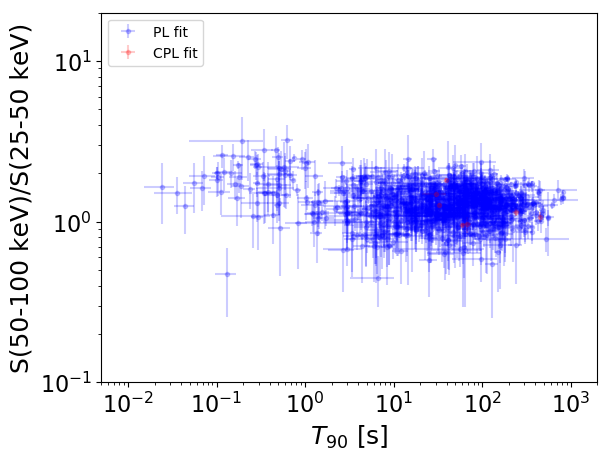
T90                                   = N/A sec.
Hardness ratio (energy fluence ratio) = N/A
S(15-50 keV) vs. S(50-150 keV) plot
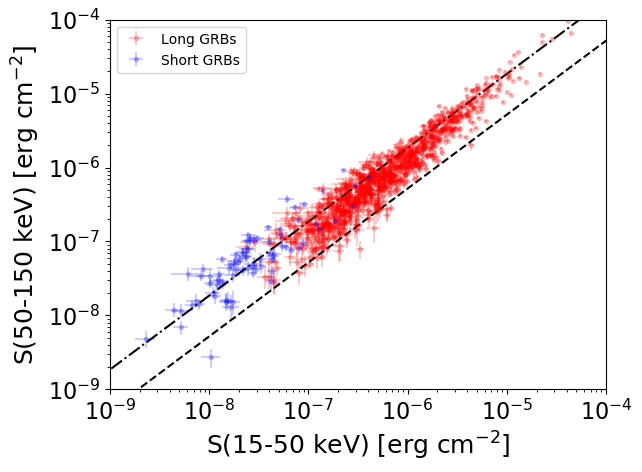
S(15-50 keV)  = N/A
S(50-150 keV) = N/A
The dash-dotted line and the dashed line traces the fluences calculated from the Band function with Epeak = 15 and 150 keV, respectively. Both lines assume a canonical values of alpha = -1 and beta = -2.5.
Mask shadow pattern
IMX = 2.953964282958187E-01, IMY = 7.263992495613288E-01
Spacecraft aspect plot
Bright source in the pre-burst/pre-slew/post-slew images
Pre-burst image of 15-350 keV band
Time interval of the image:
-239.344000 -10.344000

# RAcent  DECcent POSerr Theta    Phi  PeakCts   SNR AngSep     Name
#  [deg]    [deg]    ['] [deg]  [deg]                   [']
135.5348 -40.3591   55.0  19.1  -91.5   0.0749   0.2   11.7	Vela X-1
170.3072 -60.4836   86.9  36.9 -145.1   0.0642   0.1    8.4	Cen X-3
186.8894 -62.8966    0.0  43.8 -152.0   1.6260   2.7    9.9	GX 301-2
163.8102  11.5674    3.9  39.7   71.0   2.9821   3.0 ------	UNKNOWN
116.6887  19.1240    3.7  56.0   11.1   4.8555   3.1 ------	UNKNOWN
175.2085 -24.6262    2.8  22.1  142.5   1.4037   4.1 ------	UNKNOWN
133.3740 -20.2739    2.5  17.0  -23.0   1.3190   4.7 ------	UNKNOWN
Pre-slew background subtracted image of 15-350 keV band
Time interval of the image:
-10.344000 21.656000

# RAcent  DECcent POSerr Theta    Phi  PeakCts   SNR AngSep     Name
#  [deg]    [deg]    ['] [deg]  [deg]                   [']
135.4021 -40.6720   14.2  19.4  -91.9   0.0825   0.8    9.1	Vela X-1
170.2022 -60.4733    4.5  36.9 -145.0   0.3585   2.5    9.6	Cen X-3
186.5769 -62.7286    6.7  43.6 -152.1   0.2940   1.7    3.3	GX 301-2
178.0365 -22.4955    2.0  25.1  138.5   0.5784   5.6 ------	UNKNOWN
214.9254 -64.0008    2.4  55.5 -157.8   1.7096   4.7 ------	UNKNOWN
107.6082 -37.7006    0.7  38.1  -67.9   3.7286  17.0 ------	UNKNOWN
Post-slew image of 15-350 keV band
Time interval of the image:
295.756590 962.782400

# RAcent  DECcent POSerr Theta    Phi  PeakCts   SNR AngSep     Name
#  [deg]    [deg]    ['] [deg]  [deg]                   [']
170.3269 -60.7456   30.1  47.0   33.1  -0.7511  -0.4    7.4	Cen X-3
186.3251 -62.7465    7.0  39.2   34.0  -2.6850  -1.6    9.2	GX 301-2
244.9756 -15.6419    0.7  34.3  152.7  23.0228  17.0    0.2	Sco X-1
255.7729 -37.9706    0.0  10.8  171.5   0.6017   0.7   12.6	4U 1700-377
256.4310 -36.4291    8.5  12.4  173.9   1.1065   1.3    0.4	GX 349+2
263.0779 -24.8894   14.4  24.6 -172.5  -0.7436  -0.8    9.4	GX 1+4
264.6276 -44.5887    3.9   7.4 -130.1   2.4283   3.0    9.7	4U 1735-44
268.4718  -1.5840   38.1  48.5 -171.6  -0.5731  -0.3   10.0	SW J1753.5-0127
270.1260 -24.9264    0.0  26.4 -158.3  -0.7359  -0.8   12.6	GX 5-1
270.4561 -25.7593    6.5  25.8 -156.9  -1.6639  -1.8    8.4	GRS 1758-258
274.1024 -13.8944    7.9  38.1 -159.0   1.8417   1.5   10.2	GX 17+2
275.9214 -30.3653  255.2  24.0 -141.6  -0.0431  -0.0    0.2	H1820-303
285.1902 -24.9070    5.7  33.2 -134.1  -2.7302  -2.0    8.4	HT1900.1-2455
262.8170 -33.8195    3.9  15.9 -166.7   2.5385   3.0    8.6	GX 354-0
287.1208 -19.4272    4.6  38.7 -136.9   4.0017   2.5 ------	UNKNOWN
 17.9931 -71.9524    3.9  52.7  -28.0  11.4302   3.0 ------	UNKNOWN
302.8447 -30.1332    4.6  40.1 -108.8   8.8600   2.5 ------	UNKNOWN