Analysis Summary
Notes:
- 1) No attempt has been made to eliminate the non-significant decimal places.
- 2) This batgrbproduct analysis is done using the HEASARC data.
- 3) This batgrbproduct analysis is using the flight position for the mask-weighting calculation.
======================================================================
BAT GRB EVENT DATA PROCESSING REPORT
Process Script Ver: batgrbproduct v2.48
Process Start Time: Sun Oct 23 23:35:33 EDT 2022
Host Name: batproc1
Current Working Dir: /local/data/bat1/alien/Swift_3rdBATcatalog/event/batevent_reproc/trigger1098132
======================================================================
Trigger: 01098132 Segment: 000
BAT Trigger Time: 669404462.144 [s; MET]
Trigger Stop: 669404463.168 [s; MET]
UTC: 2022-03-19T17:40:33.333640 [includes UTCF correction]
Where From?: TDRSS position message
BAT
RA: 218.207242690197 Dec: 61.2888027725665 [deg; J2000]
Catalogged Source?: NO
Point Source?: YES
GRB Indicated?: YES [ by BAT flight software ]
Image S/N Ratio: 7.27
Image Trigger?: NO
Rate S/N Ratio: 15.556349186104 [ if not an image trigger ]
Image S/N Ratio: 7.27
Analysis Position: [ source = BAT ]
RA: 218.207242690197 Dec: 61.2888027725665 [deg; J2000]
Refined Position: [ source = BAT pre-slew burst ]
RA: 218.140183106739 Dec: 61.2893190597773 [deg; J2000]
{ 14h 32m 33.6s , +61d 17' 21.5" }
+/- 1.89777145799767 [arcmin] (estimated 90% radius based on SNR)
+/- 0.897821586871077 [arcmin] (formal 1-sigma fit error)
SNR: 12.1794332344774
Angular difference between the analysis and refined position is 1.933137 arcmin
Partial Coding Fraction: 0.4375 [ including projection effects ]
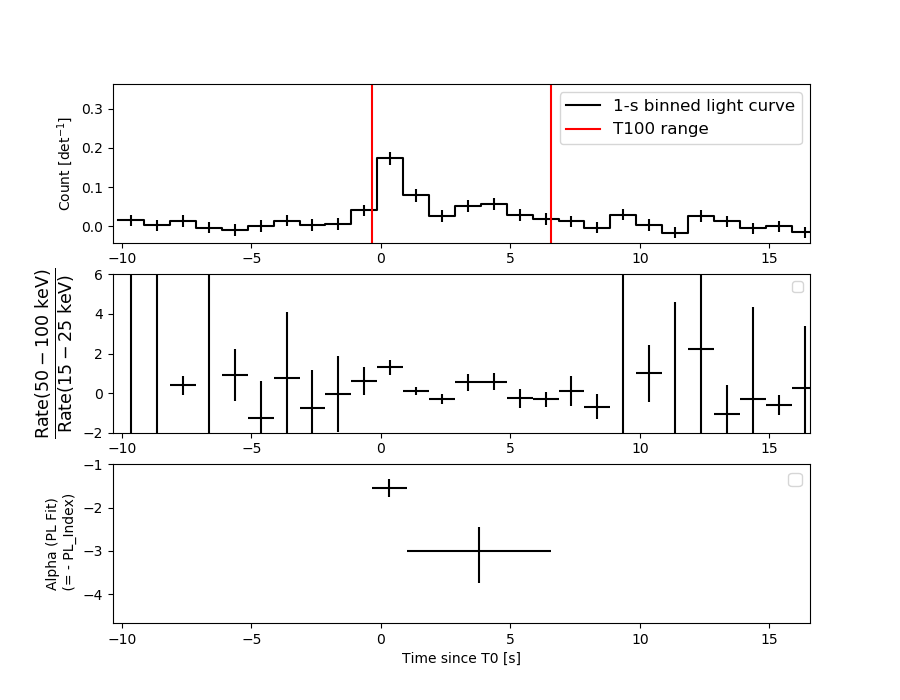
Duration
T90: 6.41999995708466 +/- 1.37503449978636
Measured from: -0.216000080108643
to: 6.20399987697601 [s; relative to TRIGTIME]
T50: 2.68799996376038 +/- 0.806367047513266
Measured from: 0.303999900817871
to: 2.99199986457825 [s; relative to TRIGTIME]
Fluence
Peak Flux (peak 1 second)
Measured from: -0.236000061035156
to: 0.763999938964844 [s; relative to TRIGTIME]
Total Fluence
Measured from: -0.364000082015991
to: 6.56399989128113 [s; relative to TRIGTIME]
Band 1 Band 2 Band 3 Band 4
15-25 25-50 50-100 100-350 keV
Total 0.189527 0.179525 0.075295 0.047042
0.022782 0.022852 0.019412 0.015633 [error]
Peak 0.041942 0.081822 0.053354 0.010549
0.009299 0.009580 0.008140 0.005884 [error]
[ fluence units of on-axis counts / fully illuminated detector ]
======================================================================
====== Table of the duration information =============================
Value tstart tstop
T100 6.928 -0.364 6.564
T90 6.420 -0.216 6.204
T50 2.688 0.304 2.992
Peak 1.000 -0.236 0.764
====== Spectral Analysis Summary =====================================
Model : spectral model: simple power-law (PL) and cutoff power-law (CPL)
Ph_index : photon index: E^{Ph_index}
Ph_90err : 90% error of the photon index
Epeak : Epeak in keV
Epeak_90err: 90% error of Epeak
Norm : normalization at 50 keV in both the PL model and CPL model
Nomr_90err : 90% error of the normalization
chi2 : Chi-Squared
dof : degree of freedo
=== Time-averaged spectral analysis ===
(Best model with acceptable fit: N/A)
Model Ph_index Ph_90err_low Ph_90err_hi Epeak Epeak_90err_low Epeak_90err_hi Norm Nomr_90err_low Norm_90err_hi chi2 dof
PL -2.154 -0.299 0.272 - - - 3.61e-03 -7.32e-04 7.07e-04 42.880 57
CPL -1.977 N/A N/A 5.283 N/A N/A 4.60e-03 N/A N/A 42.860 56
=== 1-s peak spectral analysis ===
(Best model with acceptable fit: N/A)
Model Ph_index Ph_90err_low Ph_90err_hi Epeak Epeak_90err_low Epeak_90err_hi Norm Nomr_90err_low Norm_90err_hi chi2 dof
PL -1.589 -0.226 0.221 - - - 1.18e-02 -1.78e-03 1.76e-03 56.580 57
CPL 0.137 -1.153 1.495 60.020 -10.698 27.872 9.28e-02 -9.28e-02 4.27e-01 49.480 56
=== Fluence/Peak Flux Summary ===
Model Band1 Band2 Band3 Band4 Band5 Total
15-25 25-50 50-100 100-350 15-150 15-350 keV
Fluence PL 5.91e-08 7.32e-08 6.58e-08 1.03e-07 2.33e-07 3.01e-07 erg/cm2
90%_error_low -1.11e-08 -1.08e-08 -1.77e-08 -4.52e-08 -4.06e-08 -6.93e-08 erg/cm2
90%_error_hi 1.13e-08 1.07e-08 1.85e-08 6.43e-08 4.19e-08 8.39e-08 erg/cm2
Peak flux PL 5.29e-01 5.05e-01 3.36e-01 3.48e-01 1.51e+00 1.72e+00 ph/cm2/s
90%_error_low -1.17e-01 -7.68e-02 -6.12e-02 -1.08e-01 -2.23e-01 -2.51e-01 ph/cm2/s
90%_error_hi 1.23e-01 7.63e-02 6.07e-02 1.32e-01 2.24e-01 2.51e-01 ph/cm2/s
Fluence CPL 5.90e-08 7.42e-08 6.50e-08 7.06e-08 2.29e-07 2.67e-07 erg/cm2
90%_error_low -1.21e-08 -1.00e-08 -2.01e-08 -4.91e-08 -4.36e-08 -8.41e-08 erg/cm2
90%_error_hi 1.15e-08 1.10e-08 1.88e-08 1.09e-07 4.64e-08 1.67e-07 erg/cm2
Peak flux CPL 4.02e-01 6.01e-01 3.80e-01 8.41e-02 1.45e+00 1.47e+00 ph/cm2/s
90%_error_low -1.40e-01 -1.01e-01 -7.78e-02 -5.44e-02 -2.28e-01 -2.36e-01 ph/cm2/s
90%_error_hi 1.48e-01 1.05e-01 7.86e-02 1.21e-01 2.29e-01 2.45e-01 ph/cm2/s
======================================================================
Image
Pre-slew 15.0-350.0 keV image (Event data)
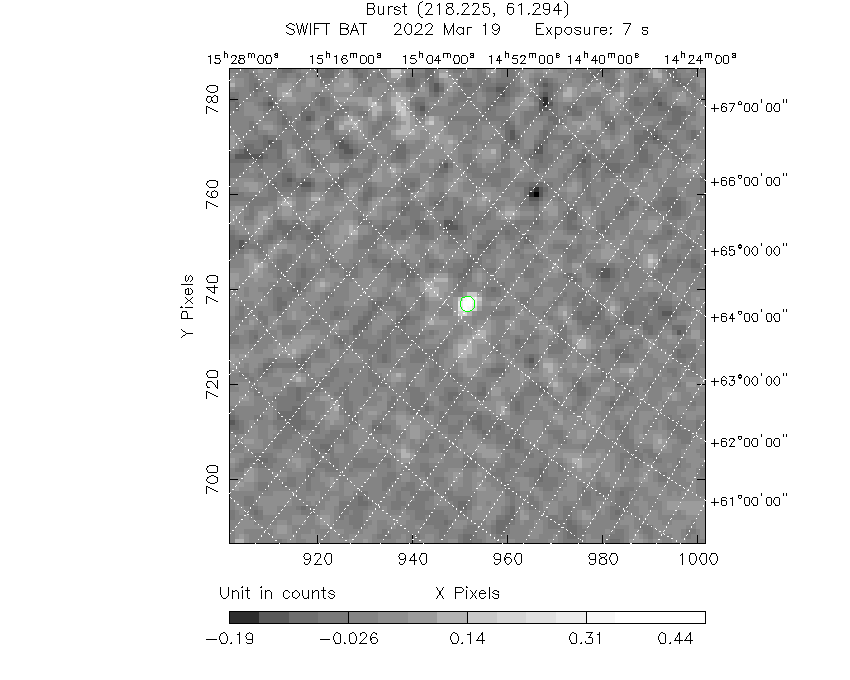
#   RAcent    DECcent   POSerr    Theta     Phi              Peak Cts       SNR   Name
  218.1402    61.2893   0.0157    29.5707  -105.4347         0.5277579     12.179 TRIG_01098132

Foreground time interval of the image:
 -0.364   6.564 (delta_t =   6.928 [sec])
Background time interval of the image:
-239.144  -0.364 (delta_t = 238.780 [sec])
Light Curves
Note: The mask-weighted lightcurves have units of either count/det or counts/sec/det, where a det is 0.4 x 0.4 = 0.16 sq cm.
Full-time range; 1 s binning
Other quick-look light curves:
- 64 ms binning (zoomed)
- 16 ms binning (zoomed)
- 8 ms binning (zoomed)
- 2 ms binning (zoomed)
- SN=5 or 10 s binning (full-time range)
- Raw light curve
Spectra
- 64 ms binning (zoomed)
- 16 ms binning (zoomed)
- 8 ms binning (zoomed)
- 2 ms binning (zoomed)
- SN=5 or 10 s binning (full-time range)
- Raw light curve
Spectra
Notes:
- 1) The fitting includes the systematic errors.
- 2) When the burst includes telescope slew time periods, the fitting uses an average response file made from multiple 5-s response files through out the slew time plus single time preiod for the non-slew times, and weighted by the total counts in the corresponding time period using addrmf. An average response file is needed becuase a spectral fit using the pre-slew DRM will introduce some errors in both a spectral shape and a normalization if the PHA file contains a lot of the slew/post-slew time interval.
- 3) For fits to more complicated models (e.g. a power-law over a cutoff power-law), the BAT team has decided to require a chi-square improvement of more than 6 for each extra dof.
Time averaged spectrum fit using the average DRM
Power-law model
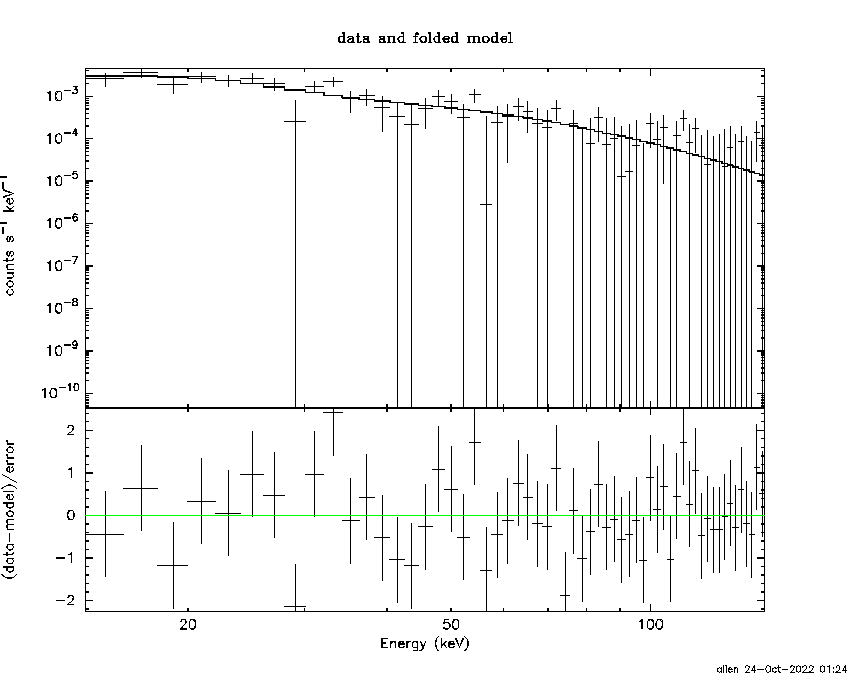
Time interval is from   -0.364 sec. to    6.564 sec.

Spectral model in power-law:
------------------------------------------------------------
Parameters  : value       lower 90%   higher 90%
Photon index: -2.15355     ( -0.299411   0.271917 )
Norm@50keV  : 3.60513E-03    ( -0.000732104   0.000707162 )
------------------------------------------------------------
#Fit statistic  : Chi-Squared                   42.88     using 59 bins.
 Reduced chi-squared = 0.752281
# Null hypothesis probability of 9.17e-01 with 57 degrees of freedom

Photon flux (15-150 keV)    in 6.928 sec: 0.582696 ( -0.081823  0.081824 ) ph/cm2/s
Energy fluence (15-150 keV)             : 2.33458e-07 ( -4.05907e-08  4.19258e-08 ) ergs/cm2
Cutoff power-law model
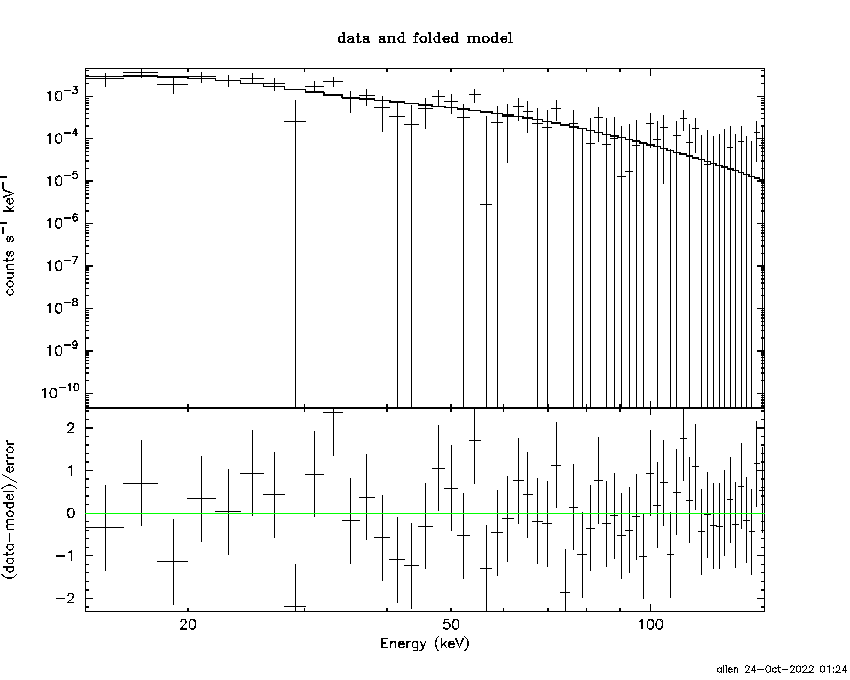
Time interval is from   -0.364 sec. to    6.564 sec.
Spectral model in the cutoff power-law:
------------------------------------------------------------
Parameters  : value       lower 90%   higher 90%
Photon index: -1.97658     (       )
Epeak [keV] : 5.28272      (   )
Norm@50keV  : 4.60262E-03    (     )
------------------------------------------------------------
#Fit statistic  : Chi-Squared                   42.86     using 59 bins.
 Reduced chi-squared = 0.765357
# Null hypothesis probability of 9.02e-01 with 56 degrees of freedom

Photon flux (15-150 keV)    in 6.928 sec: 0.582011 ( -0.081464  0.083493 ) ph/cm2/s
Energy fluence (15-150 keV)             : 2.29186e-07 ( -4.36329e-08  4.6445e-08 ) ergs/cm2
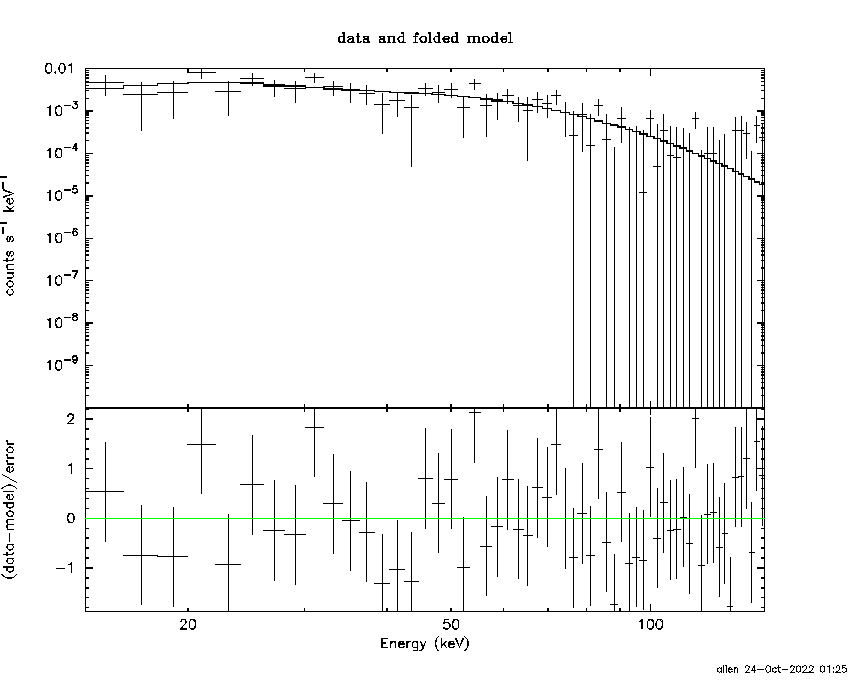
1-s peak spectrum fit
Power-law model

Time interval is from   -0.236 sec. to    0.764 sec.

Spectral model in power-law:
------------------------------------------------------------
Parameters  : value       lower 90%   higher 90%
Photon index: -1.58891     ( -0.225704   0.220829 )
Norm@50keV  : 1.18096E-02    ( -0.00177554   0.00176377 )
------------------------------------------------------------
#Fit statistic  : Chi-Squared                   56.58     using 59 bins.
 Reduced chi-squared = 0.992632
# Null hypothesis probability of 4.91e-01 with 57 degrees of freedom

Photon flux (15-150 keV)    in 1 sec: 1.51247 ( -0.22344  0.22381 ) ph/cm2/s
Energy fluence (15-150 keV)             : 1.10614e-07 ( -1.75118e-08  1.76574e-08 ) ergs/cm2
Cutoff power-law model
Time interval is from   -0.236 sec. to    0.764 sec.
Spectral model in the cutoff power-law:
------------------------------------------------------------
Parameters  : value       lower 90%   higher 90%
Photon index: 0.136759     ( -1.15329   1.49525 )
Epeak [keV] : 60.0203      ( -10.6977 27.8721 )
Norm@50keV  : 9.27983E-02    ( -0.0928   0.426892 )
------------------------------------------------------------
#Fit statistic  : Chi-Squared                   49.48     using 59 bins.
 Reduced chi-squared = 0.883571
# Null hypothesis probability of 7.18e-01 with 56 degrees of freedom

Photon flux (15-150 keV)    in 1 sec: 1.45291 ( -0.22826  0.22853 ) ph/cm2/s
Energy fluence (15-150 keV)             : 1.01986e-07 ( -1.77108e-08  1.8451e-08 ) ergs/cm2
Time-resolved spectra
Distribution
T90 vs. Hardness ratio plot
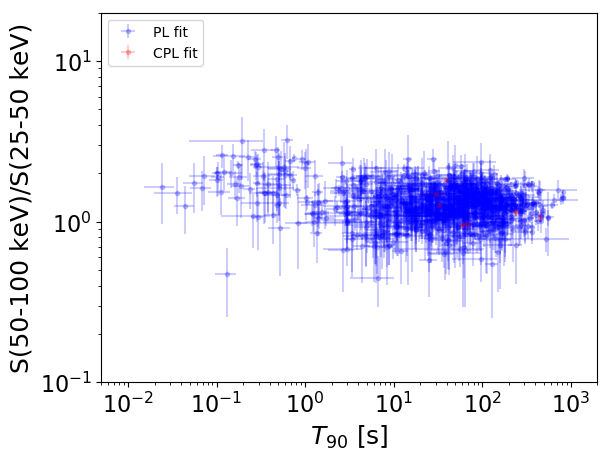
T90                                   = N/A sec.
Hardness ratio (energy fluence ratio) = N/A
S(15-50 keV) vs. S(50-150 keV) plot
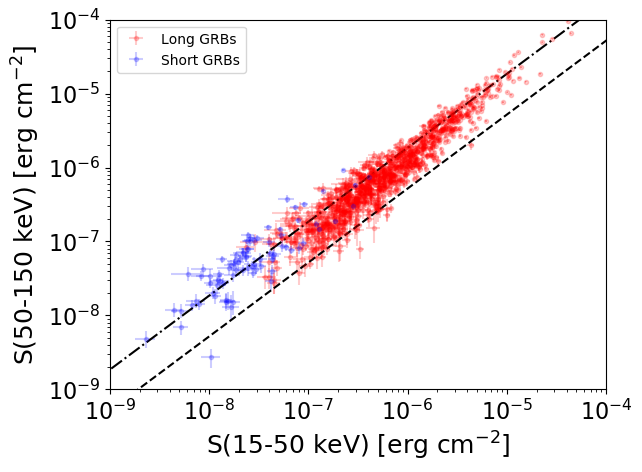
S(15-50 keV)  = N/A
S(50-150 keV) = N/A
The dash-dotted line and the dashed line traces the fluences calculated from the Band function with Epeak = 15 and 150 keV, respectively. Both lines assume a canonical values of alpha = -1 and beta = -2.5.
Mask shadow pattern
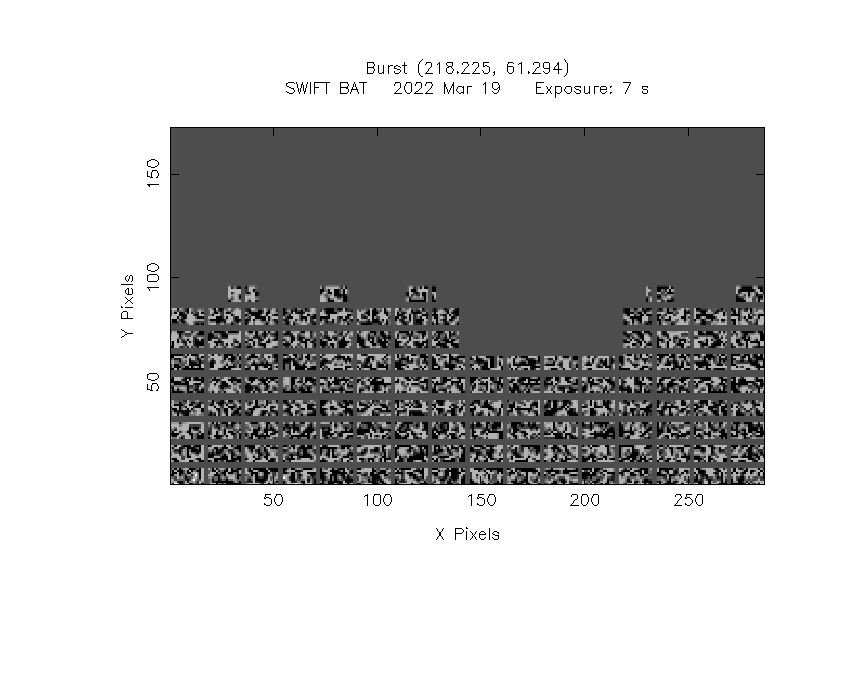
IMX = -1.510084145816508E-01, IMY = 5.469381589651889E-01
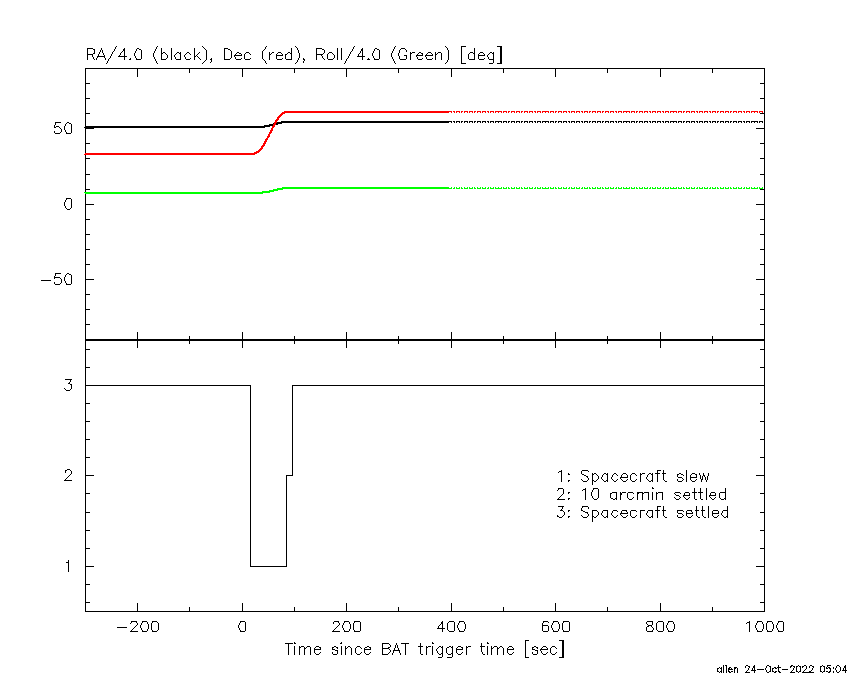
Spacecraft aspect plot
Bright source in the pre-burst/pre-slew/post-slew images
Pre-burst image of 15-350 keV band
Time interval of the image:
-239.144000 -0.364000

# RAcent  DECcent POSerr Theta    Phi  PeakCts   SNR AngSep     Name
#  [deg]    [deg]    ['] [deg]  [deg]                   [']
254.3785  35.1488    5.9  41.5  -46.9   0.9312   2.0   12.2	Her X-1
173.9007   9.9906    4.0  35.9  117.0   1.6405   2.9 ------	UNKNOWN
244.7998  -1.2003    2.6  51.8    3.7   2.1435   4.4 ------	UNKNOWN
250.5458  19.1225    2.6  44.0  -22.9   1.8042   4.5 ------	UNKNOWN
Pre-slew background subtracted image of 15-350 keV band
Time interval of the image:
-0.364000 6.564000

# RAcent  DECcent POSerr Theta    Phi  PeakCts   SNR AngSep     Name
#  [deg]    [deg]    ['] [deg]  [deg]                   [']
254.5944  35.3215    5.2  41.7  -47.2  -0.1316  -2.2    6.8	Her X-1
139.2371  31.7017    2.2  53.5  167.7   0.5580   5.1 ------	UNKNOWN
218.1401  61.2893    0.9  29.6 -105.4   0.5279  12.2 ------	UNKNOWN
Post-slew image of 15-350 keV band
Time interval of the image:
84.356590 962.922100

# RAcent  DECcent POSerr Theta    Phi  PeakCts   SNR AngSep     Name
#  [deg]    [deg]    ['] [deg]  [deg]                   [']
254.4788  35.3260    8.6  34.6  -10.9  -1.3884  -1.3    1.4	Her X-1
174.1658  37.7594    3.5  35.9  117.0   6.2625   3.3 ------	UNKNOWN
141.7559  44.0709    2.7  46.3  152.3  10.9356   4.3 ------	UNKNOWN
113.5844  45.9776    3.8  56.9  173.9   8.4027   3.0 ------	UNKNOWN
226.5933  44.0077    2.2  18.0   27.4   3.6043   5.2 ------	UNKNOWN
258.7257  12.4865    2.8  56.9   -1.9   9.4539   4.1 ------	UNKNOWN
278.6235  65.7368    2.7  26.2  -78.7   4.1734   4.3 ------	UNKNOWN
276.9083  41.4979    3.0  39.8  -40.6   4.2387   3.9 ------	UNKNOWN
 73.7167  57.5390    2.9  58.0 -154.2  18.1437   4.0 ------	UNKNOWN