Analysis Summary
Notes:
- 1) No attempt has been made to eliminate the non-significant decimal places.
- 2) This batgrbproduct analysis is done using the HEASARC data.
- 3) This batgrbproduct analysis is using the flight position for the mask-weighting calculation.
======================================================================
BAT GRB EVENT DATA PROCESSING REPORT
Process Script Ver: batgrbproduct v2.48
Process Start Time: Sun Oct 23 23:33:45 EDT 2022
Host Name: batproc1
Current Working Dir: /local/data/bat1/alien/Swift_3rdBATcatalog/event/batevent_reproc/trigger1099310
======================================================================
Trigger: 01099310 Segment: 000
BAT Trigger Time: 669921411.904 [s; MET]
Trigger Stop: 669921412.928 [s; MET]
UTC: 2022-03-25T17:16:23.058720 [includes UTCF correction]
Where From?: TDRSS position message
BAT
RA: 269.485349385526 Dec: -7.03074025444452 [deg; J2000]
Catalogged Source?: NO
Point Source?: YES
GRB Indicated?: YES [ by BAT flight software ]
Image S/N Ratio: 10.22
Image Trigger?: NO
Rate S/N Ratio: 15.8429795177549 [ if not an image trigger ]
Image S/N Ratio: 10.22
Analysis Position: [ source = BAT ]
RA: 269.485349385526 Dec: -7.03074025444452 [deg; J2000]
Refined Position: [ source = BAT pre-slew burst ]
RA: 269.469615017896 Dec: -7.0551317384227 [deg; J2000]
{ 17h 57m 52.7s , -07d 03' 18.5" }
+/- 1.46601907636884 [arcmin] (estimated 90% radius based on SNR)
+/- 0.734964046309979 [arcmin] (formal 1-sigma fit error)
SNR: 17.6106774789526
Angular difference between the analysis and refined position is 1.737715 arcmin
Partial Coding Fraction: 0.5234375 [ including projection effects ]
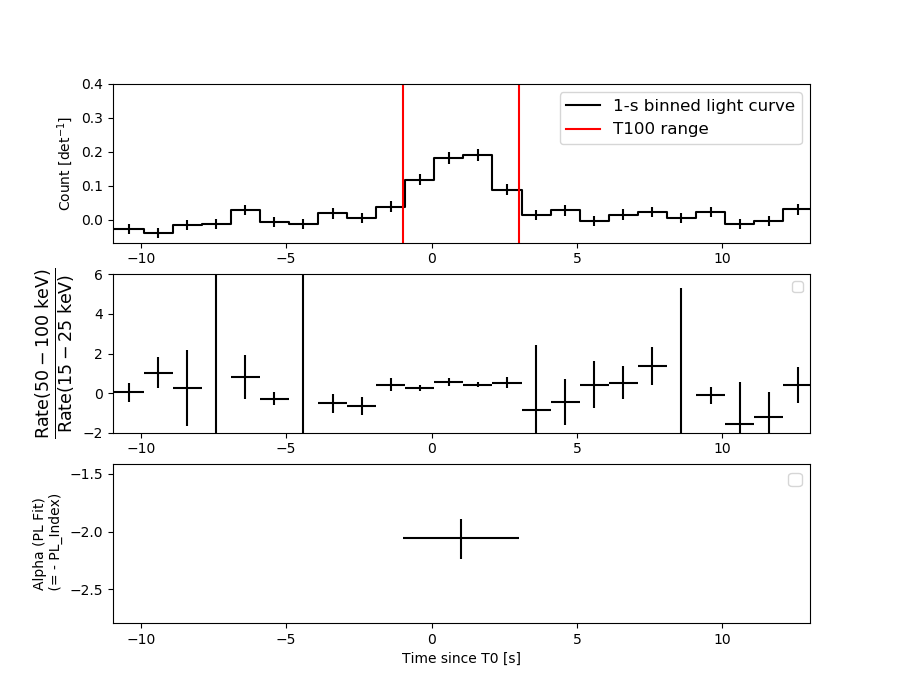
Duration
T90: 3.50399994850159 +/- 0.557641434486111
Measured from: -0.752000093460083
to: 2.7519998550415 [s; relative to TRIGTIME]
T50: 1.37999987602234 +/- 0.404969178192553
Measured from: 0.279999971389771
to: 1.65999984741211 [s; relative to TRIGTIME]
Fluence
Peak Flux (peak 1 second)
Measured from: 0.531999945640564
to: 1.53199994564056 [s; relative to TRIGTIME]
Total Fluence
Measured from: -0.972000002861023
to: 3.01599991321564 [s; relative to TRIGTIME]
Band 1 Band 2 Band 3 Band 4
15-25 25-50 50-100 100-350 keV
Total 0.206988 0.263250 0.091337 0.029800
0.019292 0.019099 0.015638 0.012862 [error]
Peak 0.057730 0.111384 0.035044 0.012827
0.010089 0.010426 0.008792 0.006574 [error]
[ fluence units of on-axis counts / fully illuminated detector ]
======================================================================
====== Table of the duration information =============================
Value tstart tstop
T100 3.988 -0.972 3.016
T90 3.504 -0.752 2.752
T50 1.380 0.280 1.660
Peak 1.000 0.532 1.532
====== Spectral Analysis Summary =====================================
Model : spectral model: simple power-law (PL) and cutoff power-law (CPL)
Ph_index : photon index: E^{Ph_index}
Ph_90err : 90% error of the photon index
Epeak : Epeak in keV
Epeak_90err: 90% error of Epeak
Norm : normalization at 50 keV in both the PL model and CPL model
Nomr_90err : 90% error of the normalization
chi2 : Chi-Squared
dof : degree of freedo
=== Time-averaged spectral analysis ===
(Best model with acceptable fit: N/A)
Model Ph_index Ph_90err_low Ph_90err_hi Epeak Epeak_90err_low Epeak_90err_hi Norm Nomr_90err_low Norm_90err_hi chi2 dof
PL -2.059 -0.175 0.167 - - - 8.85e-03 -1.03e-03 1.01e-03 69.740 57
CPL -0.701 -0.951 1.283 39.290 -9.312 8.674 5.41e-02 -5.41e-02 2.55e-01 63.170 56
=== 1-s peak spectral analysis ===
(Best model with acceptable fit: N/A)
Model Ph_index Ph_90err_low Ph_90err_hi Epeak Epeak_90err_low Epeak_90err_hi Norm Nomr_90err_low Norm_90err_hi chi2 dof
PL -1.849 -0.232 0.221 - - - 1.42e-02 -2.16e-03 2.12e-03 78.740 57
CPL 0.477 -1.869 3.429 43.505 -6.436 19.780 3.12e-01 -3.12e-01 3.20e+01 73.580 56
=== Fluence/Peak Flux Summary ===
Model Band1 Band2 Band3 Band4 Band5 Total
15-25 25-50 50-100 100-350 15-150 15-350 keV
Fluence PL 7.64e-08 1.00e-07 9.61e-08 1.64e-07 3.27e-07 4.37e-07 erg/cm2
90%_error_low -1.02e-08 -9.50e-09 -1.49e-08 -4.52e-08 -3.52e-08 -6.36e-08 erg/cm2
90%_error_hi 1.05e-08 9.51e-09 1.51e-08 5.51e-08 3.56e-08 7.04e-08 erg/cm2
Peak flux PL 8.16e-01 6.69e-01 3.71e-01 3.03e-01 1.99e+00 2.16e+00 ph/cm2/s
90%_error_low -1.59e-01 -9.01e-02 -7.15e-02 -9.94e-02 -2.70e-01 -2.90e-01 ph/cm2/s
90%_error_hi 1.66e-01 9.00e-02 7.16e-02 1.24e-01 2.70e-01 2.90e-01 ph/cm2/s
Fluence CPL 6.77e-08 1.16e-07 8.85e-08 2.54e-08 2.92e-07 2.98e-07 erg/cm2
90%_error_low -1.23e-08 -1.44e-08 -2.15e-08 -1.90e-08 -3.87e-08 -4.33e-08 erg/cm2
90%_error_hi 1.22e-08 1.52e-08 1.92e-08 5.90e-08 4.17e-08 6.87e-08 erg/cm2
Peak flux CPL 6.41e-01 8.41e-01 3.34e-01 2.66e-02 1.84e+00 1.85e+00 ph/cm2/s
90%_error_low -2.33e-01 -1.64e-01 -1.33e-01 -2.66e-02 -3.11e-01 -3.15e-01 ph/cm2/s
90%_error_hi 2.20e-01 1.76e-01 1.09e-01 1.48e-01 3.05e-01 3.17e-01 ph/cm2/s
======================================================================
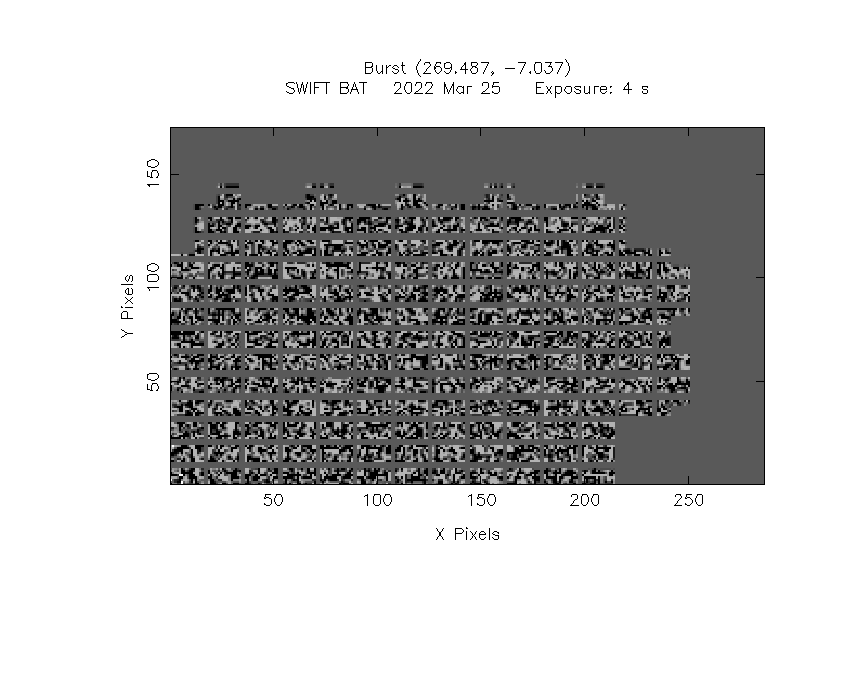
Image
Pre-slew 15.0-350.0 keV image (Event data)
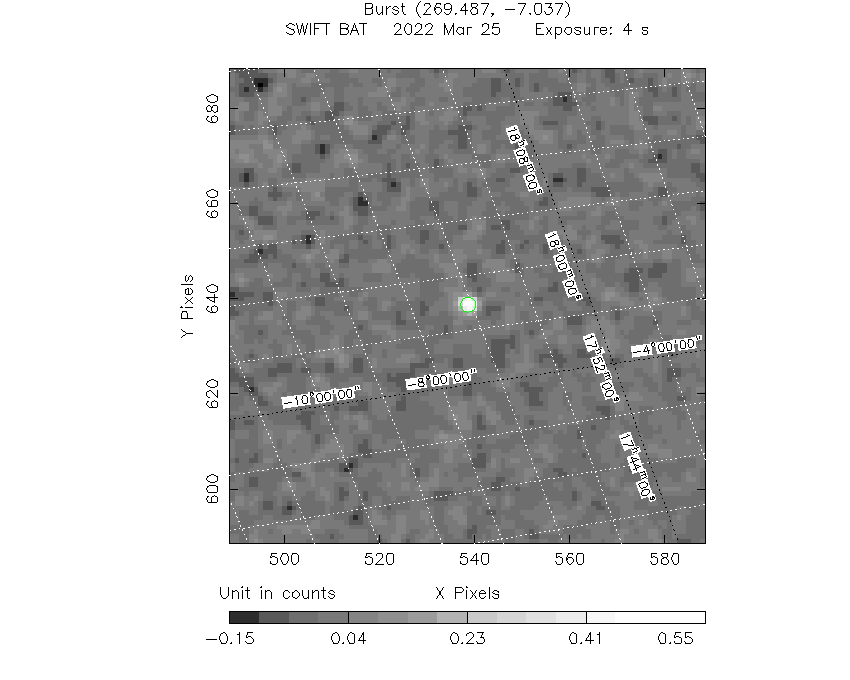
#   RAcent    DECcent   POSerr    Theta     Phi              Peak Cts       SNR   Name
  269.4696    -7.0551   0.0109    38.4231   -25.4348         0.5910721     17.611 TRIG_01099310

Foreground time interval of the image:
 -0.972   3.016 (delta_t =   3.988 [sec])
Background time interval of the image:
-239.904  -0.972 (delta_t = 238.932 [sec])
Light Curves
Note: The mask-weighted lightcurves have units of either count/det or counts/sec/det, where a det is 0.4 x 0.4 = 0.16 sq cm.
Full-time range; 1 s binning
Other quick-look light curves:
- 64 ms binning (zoomed)
- 16 ms binning (zoomed)
- 8 ms binning (zoomed)
- 2 ms binning (zoomed)
- SN=5 or 10 s binning (full-time range)
- Raw light curve
Spectra
- 64 ms binning (zoomed)
- 16 ms binning (zoomed)
- 8 ms binning (zoomed)
- 2 ms binning (zoomed)
- SN=5 or 10 s binning (full-time range)
- Raw light curve
Spectra
Notes:
- 1) The fitting includes the systematic errors.
- 2) When the burst includes telescope slew time periods, the fitting uses an average response file made from multiple 5-s response files through out the slew time plus single time preiod for the non-slew times, and weighted by the total counts in the corresponding time period using addrmf. An average response file is needed becuase a spectral fit using the pre-slew DRM will introduce some errors in both a spectral shape and a normalization if the PHA file contains a lot of the slew/post-slew time interval.
- 3) For fits to more complicated models (e.g. a power-law over a cutoff power-law), the BAT team has decided to require a chi-square improvement of more than 6 for each extra dof.
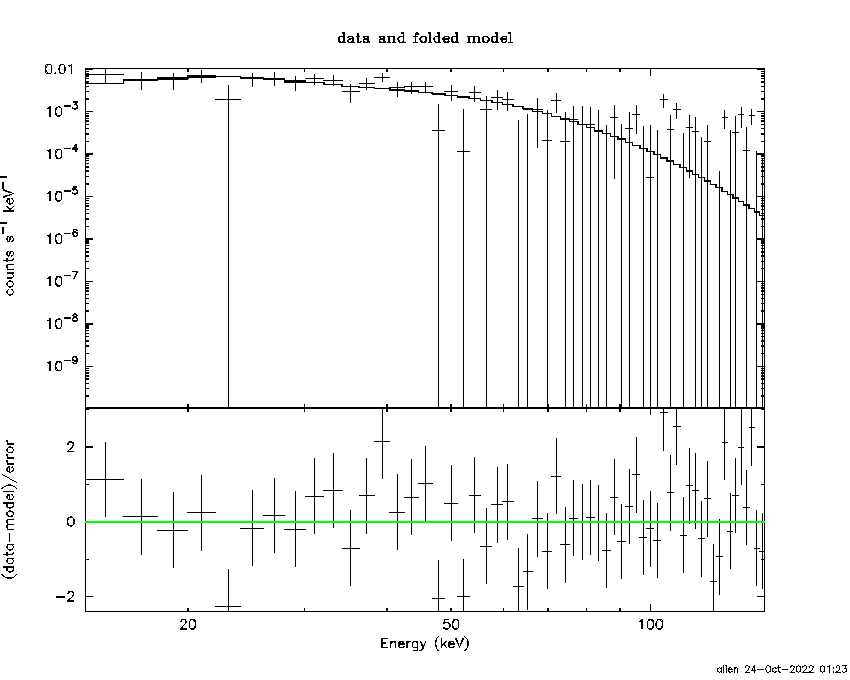
Time averaged spectrum fit using the average DRM
Power-law model
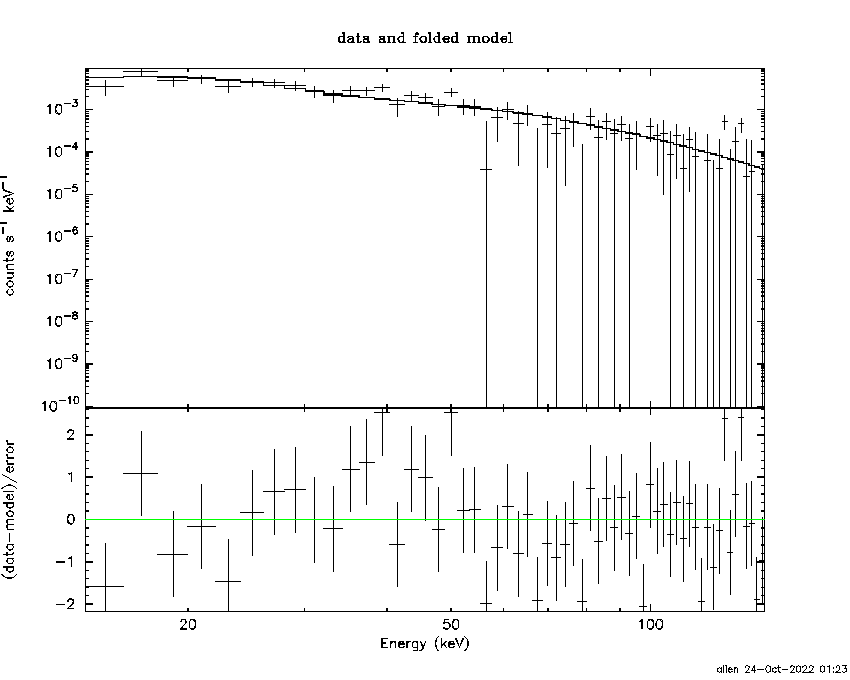
Time interval is from   -0.972 sec. to    3.016 sec.

Spectral model in power-law:
------------------------------------------------------------
Parameters  : value       lower 90%   higher 90%
Photon index: -2.05882     ( -0.175524   0.167354 )
Norm@50keV  : 8.85397E-03    ( -0.00103028   0.00101239 )
------------------------------------------------------------
#Fit statistic  : Chi-Squared                   69.74     using 59 bins.
 Reduced chi-squared = 1.22351
# Null hypothesis probability of 1.20e-01 with 57 degrees of freedom

Photon flux (15-150 keV)    in 3.988 sec: 1.36543 ( -0.13143  0.13155 ) ph/cm2/s
Energy fluence (15-150 keV)             : 3.26945e-07 ( -3.51522e-08  3.55772e-08 ) ergs/cm2
Cutoff power-law model
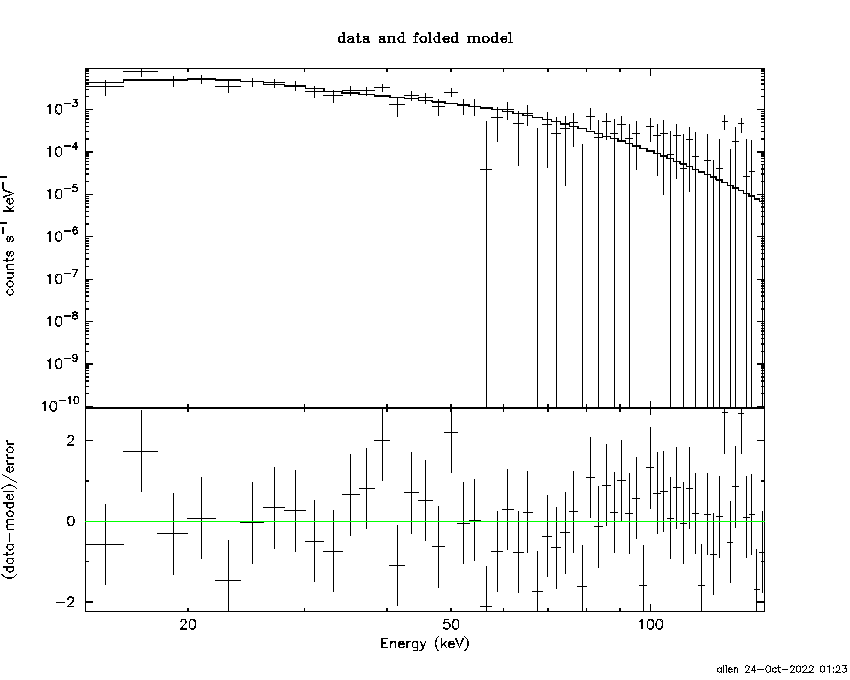
Time interval is from   -0.972 sec. to    3.016 sec.
Spectral model in the cutoff power-law:
------------------------------------------------------------
Parameters  : value       lower 90%   higher 90%
Photon index: -0.700801     ( -0.951991   1.2825 )
Epeak [keV] : 39.2903      ( -9.31124 8.67474 )
Norm@50keV  : 5.41372E-02    ( -0.0542169   0.254605 )
------------------------------------------------------------
#Fit statistic  : Chi-Squared                   63.17     using 59 bins.
 Reduced chi-squared = 1.12804
# Null hypothesis probability of 2.38e-01 with 56 degrees of freedom

Photon flux (15-150 keV)    in 3.988 sec: 1.30149 ( -0.13976  0.13917 ) ph/cm2/s
Energy fluence (15-150 keV)             : 2.92284e-07 ( -3.86982e-08  4.16535e-08 ) ergs/cm2
1-s peak spectrum fit
Power-law model
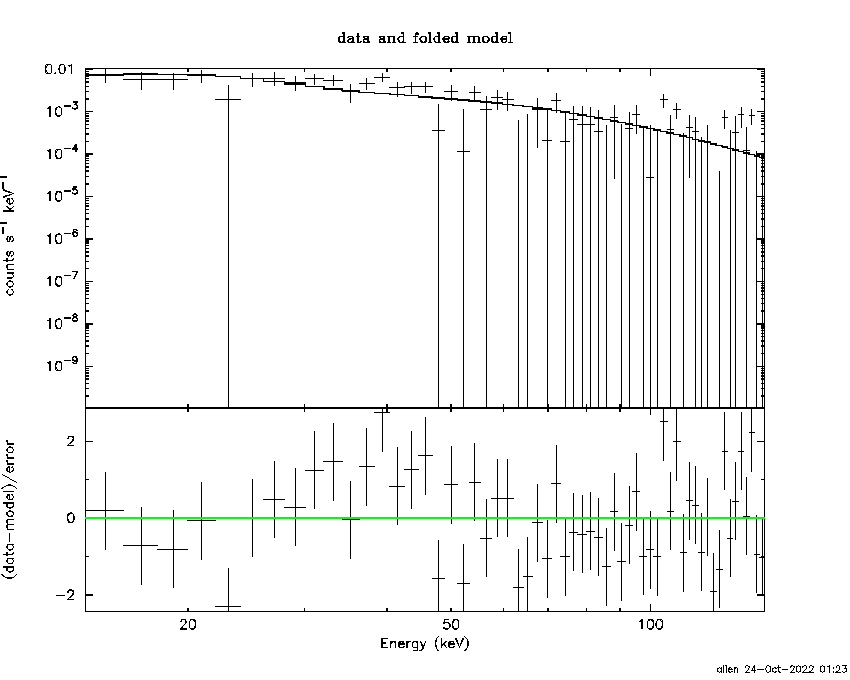
Time interval is from    0.532 sec. to    1.532 sec.

Spectral model in power-law:
------------------------------------------------------------
Parameters  : value       lower 90%   higher 90%
Photon index: -1.84901     ( -0.232339   0.221014 )
Norm@50keV  : 1.41730E-02    ( -0.00215606   0.00211571 )
------------------------------------------------------------
#Fit statistic  : Chi-Squared                   78.74     using 59 bins.
 Reduced chi-squared = 1.3814
# Null hypothesis probability of 2.98e-02 with 57 degrees of freedom

Photon flux (15-150 keV)    in 1 sec: 1.99147 ( -0.26961  0.26991 ) ph/cm2/s
Energy fluence (15-150 keV)             : 1.30341e-07 ( -1.96531e-08  1.99213e-08 ) ergs/cm2
Cutoff power-law model
Time interval is from    0.532 sec. to    1.532 sec.
Spectral model in the cutoff power-law:
------------------------------------------------------------
Parameters  : value       lower 90%   higher 90%
Photon index: 0.477153     ( -1.88774   3.41005 )
Epeak [keV] : 43.5052      ( -6.34818 19.8681 )
Norm@50keV  : 0.312166    ( -0.33181   32.0057 )
------------------------------------------------------------
#Fit statistic  : Chi-Squared                   73.58     using 59 bins.
 Reduced chi-squared = 1.31393
# Null hypothesis probability of 5.76e-02 with 56 degrees of freedom

Photon flux (15-150 keV)    in 1 sec: 1.84143 ( -0.31086  0.30455 ) ph/cm2/s
Energy fluence (15-150 keV)             : 1.07406e-07 ( -2.156e-08  2.69014e-08 ) ergs/cm2
Time-resolved spectra
Distribution
T90 vs. Hardness ratio plot
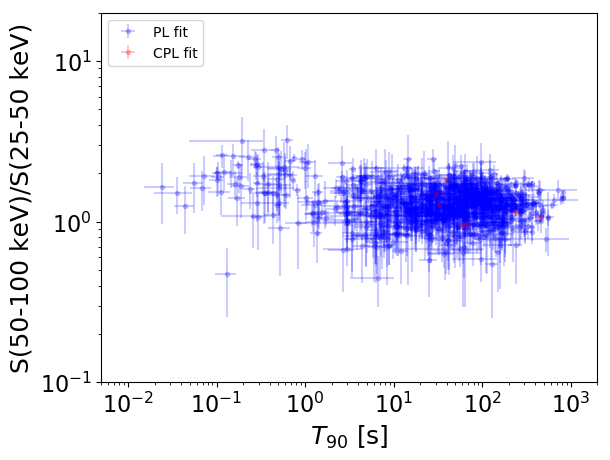
T90                                   = N/A sec.
Hardness ratio (energy fluence ratio) = N/A
S(15-50 keV) vs. S(50-150 keV) plot
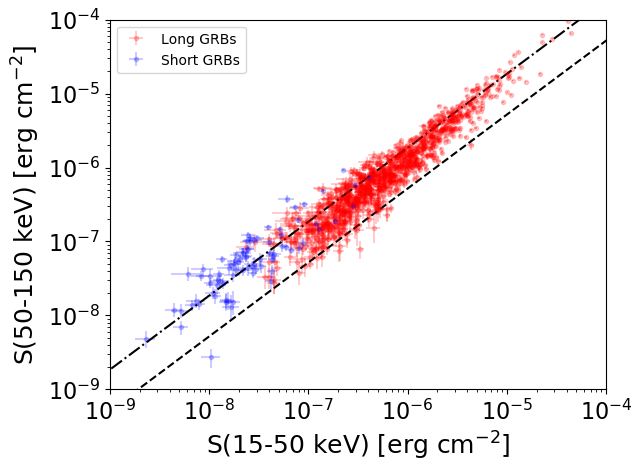
S(15-50 keV)  = N/A
S(50-150 keV) = N/A
The dash-dotted line and the dashed line traces the fluences calculated from the Band function with Epeak = 15 and 150 keV, respectively. Both lines assume a canonical values of alpha = -1 and beta = -2.5.
Mask shadow pattern
IMX = 7.163621731427516E-01, IMY = 3.406869026124374E-01
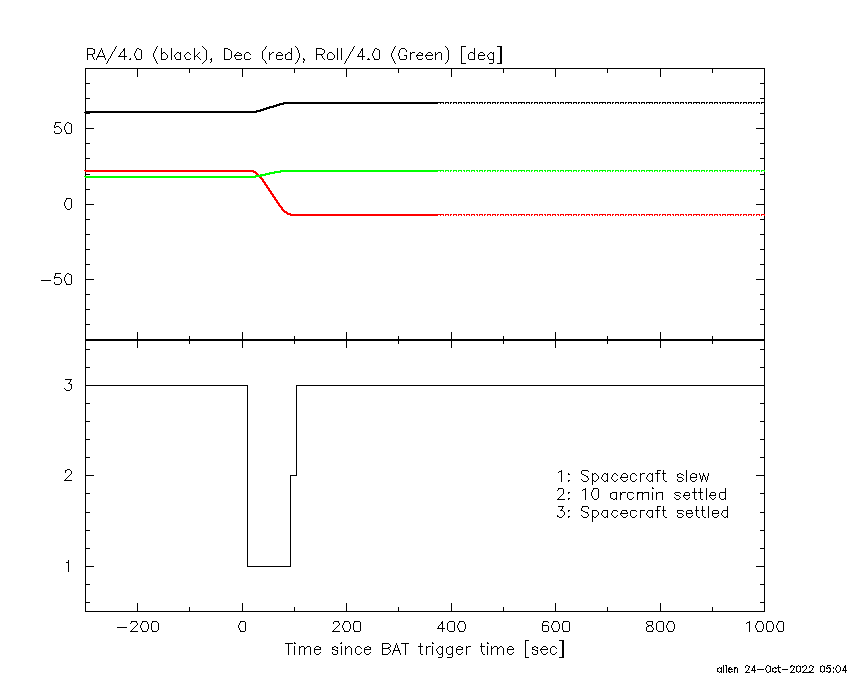
Spacecraft aspect plot
Bright source in the pre-burst/pre-slew/post-slew images
Pre-burst image of 15-350 keV band
Time interval of the image:
-239.904000 -0.972000

# RAcent  DECcent POSerr Theta    Phi  PeakCts   SNR AngSep     Name
#  [deg]    [deg]    ['] [deg]  [deg]                   [']
244.9543 -15.6469    0.6  37.9   16.4   8.6682  19.3    1.5	Sco X-1
254.5921  35.5146    0.0  16.2 -129.8   0.2091   0.7   12.2	Her X-1
263.1260 -24.7694    4.0  50.5   -4.8   1.6145   2.9    6.5	GX 1+4
268.2625  -1.6373    0.0  33.6  -30.0   0.5379   1.6   12.8	SW J1753.5-0127
270.3673 -24.9810    6.2  53.7  -12.1   1.2980   1.9    7.4	GX 5-1
270.3225 -25.6952    6.1  54.3  -11.6   1.3587   1.9    3.1	GRS 1758-258
274.0851 -13.9854    4.9  46.7  -24.1   1.2991   2.3    5.5	GX 17+2
186.6016  66.1629    2.5  56.8  173.8   6.2865   4.7 ------	UNKNOWN
251.2314  59.6020    2.7  37.7 -156.2   1.7744   4.3 ------	UNKNOWN
271.7056 -12.3798    3.5  43.9  -22.9   1.6273   3.3 ------	UNKNOWN
275.1228  -5.6985    2.2  41.3  -33.3   2.4173   5.3 ------	UNKNOWN
272.4614  22.6329    2.6  26.2  -78.6   1.7243   4.5 ------	UNKNOWN
271.5312  51.0681    2.3  35.9 -132.5   2.1166   4.9 ------	UNKNOWN
289.1928  33.6605    4.0  41.2  -98.4   3.7579   3.0 ------	UNKNOWN
Pre-slew background subtracted image of 15-350 keV band
Time interval of the image:
-0.972000 3.016000

# RAcent  DECcent POSerr Theta    Phi  PeakCts   SNR AngSep     Name
#  [deg]    [deg]    ['] [deg]  [deg]                   [']
245.0700 -15.6916   17.2  37.9   16.2  -0.0239  -0.7    6.1	Sco X-1
254.2855  35.4631   18.8  16.0 -130.4   0.0143   0.6   11.1	Her X-1
263.0317 -24.7650    9.2  50.5   -4.7   0.0661   1.2    1.7	GX 1+4
268.2229  -1.3761    5.1  33.4  -30.3  -0.0646  -2.2    9.8	SW J1753.5-0127
270.1872 -25.1110    4.5  53.7  -11.8  -0.1686  -2.6    5.6	GX 5-1
270.2834 -25.7653    4.2  54.3  -11.5  -0.2001  -2.8    1.7	GRS 1758-258
273.9381 -13.9996    5.3  46.6  -23.9  -0.1059  -2.2    4.5	GX 17+2
238.0251 -27.4805    2.5  50.0   24.8   0.3753   4.6 ------	UNKNOWN
248.7964 -10.5766    2.4  33.1    9.3   0.1432   4.8 ------	UNKNOWN
269.4696  -7.0551    0.7  38.4  -25.4   0.5909  17.6 ------	UNKNOWN
Post-slew image of 15-350 keV band
Time interval of the image:
92.996630 962.128400

# RAcent  DECcent POSerr Theta    Phi  PeakCts   SNR AngSep     Name
#  [deg]    [deg]    ['] [deg]  [deg]                   [']
244.9848 -15.6514    0.5  25.5   69.7  33.8706  24.3    0.7	Sco X-1
254.5922  35.2123    0.0  44.5  164.1   6.9152   2.5   10.2	Her X-1
256.1500 -37.7951    6.4  33.1   21.1   2.7184   1.8    8.3	4U 1700-377
256.5122 -36.4178    3.9  31.7   21.7   4.3089   3.0    3.7	GX 349+2
262.8538 -24.8915    0.0  19.0   20.4   1.6493   1.6   12.2	GX 1+4
264.7489 -44.4490   36.2  37.6    7.1   0.4912   0.3    0.3	4U 1735-44
268.2840  -1.6048    7.4   5.6  169.1   1.5892   1.6   10.4	SW J1753.5-0127
270.3962 -25.0902    3.3  18.1   -1.1   3.4583   3.5    6.1	GX 5-1
270.4652 -25.8883    0.0  18.9   -1.2   0.5153   0.5   12.4	GRS 1758-258
273.9717 -14.0692    4.7   8.3  -30.1   2.4213   2.5    2.8	GX 17+2
275.7753 -30.4905   37.8  24.2  -11.8   0.3373   0.3   10.7	H1820-303
284.8835 -24.9881    5.1  23.2  -36.0  -2.4012  -2.3    9.2	HT1900.1-2455
288.8096  10.9801    5.3  26.3 -131.4   2.8725   2.2    2.2	GRS 1915+105
299.5758  35.1899    0.9  50.9 -146.5  40.0145  13.3    1.0	Cyg X-1
263.1507 -33.8510    2.8  27.5   13.0   4.3536   4.1    8.1	GX 354-0
252.5791 -13.0605    3.7  17.7   70.3   3.6145   3.1 ------	UNKNOWN
259.6617  49.1904    3.2  56.9  173.9  14.8197   3.7 ------	UNKNOWN
301.2600 -58.5733    2.8  57.0  -17.5  13.6949   4.0 ------	UNKNOWN
312.0692 -21.7689    2.7  43.6  -64.1  22.0018   4.3 ------	UNKNOWN