Analysis Summary
Notes:
- 1) No attempt has been made to eliminate the non-significant decimal places.
- 2) This batgrbproduct analysis is done using the HEASARC data.
- 3) This batgrbproduct analysis is using the flight position for the mask-weighting calculation.
======================================================================
                  BAT GRB EVENT DATA PROCESSING REPORT
    Process Script Ver: batgrbproduct v2.48
    Process Start Time: Sun Oct 23 23:32:01 EDT 2022
             Host Name: batproc1
   Current Working Dir: /local/data/bat1/alien/Swift_3rdBATcatalog/event/batevent_reproc/trigger1101053
======================================================================

  Trigger: 01101053      Segment: 000

  BAT Trigger Time: 670711391.552   [s; MET]
      Trigger Stop: 670711392.576   [s; MET]
               UTC: 2022-04-03T20:42:42.653340    [includes UTCF correction]
       Where From?: TDRSS position message

  BAT
    RA: 191.025474789219   Dec: 89.1703529424159  [deg; J2000]

     Catalogged Source?: NO
     Point Source?:      YES
     GRB Indicated?:     YES    [ by BAT flight software ]
     Image S/N Ratio:    12.67
     Image Trigger?:     NO
     Rate S/N Ratio:     18.6815416922694  [ if not an image trigger ]
     Image S/N Ratio:    12.67

  Analysis Position:   [ source = BAT ]
    RA: 191.025474789219   Dec: 89.1703529424159  [deg; J2000]

  Refined Position:   [ source = BAT pre-slew burst ]
    RA: 190.972801809065   Dec: 89.1802973949976  [deg; J2000]
        { 12h 43m 53.5s , +89d 10' 49.1" }
         +/- 0.75388602154877 [arcmin] (estimated 90% radius based on SNR)
         +/- 0.20013550709882 [arcmin] (formal 1-sigma fit error)
    SNR: 45.5403081144335

  Angular difference between the analysis and refined position is 0.598398 arcmin

  Partial Coding Fraction: 0.6015625    [ including projection effects ]

  Duration
     T90: 26.9679999351501 +/- 3.27635160401706
        Measured from: -8.78400003910065
                   to: 18.1839998960495     [s; relative to TRIGTIME]
     T50: 11.9199999570847 +/- 0.647715993420679
        Measured from: -1.4760000705719
                   to: 10.4439998865128     [s; relative to TRIGTIME]


  Fluence
     Peak Flux  (peak 1 second)
        Measured from: 1.06400001049042
                   to: 2.06400001049042     [s; relative to TRIGTIME]
     Total Fluence
        Measured from: -14.4200000762939
                   to: 27.3959999084473     [s; relative to TRIGTIME]

             Band 1     Band 2     Band 3     Band 4
              15-25      25-50     50-100    100-350     keV
 Total     2.085297   2.571823   1.381745   0.276325
           0.058422   0.060903   0.052796   0.045607 [error]
 Peak      0.098469   0.118589   0.075569   0.036168
           0.010034   0.010250   0.008962   0.007194 [error]

     [ fluence units of on-axis counts / fully illuminated detector ]

======================================================================


====== Table of the duration information =============================

        Value   tstart    tstop
T100   41.816  -14.420   27.396
T90    26.968   -8.784   18.184
T50    11.920   -1.476   10.444
Peak    1.000    1.064    2.064


====== Spectral Analysis Summary =====================================

Model      : spectral model: simple power-law (PL) and cutoff power-law (CPL)
Ph_index   : photon index: E^{Ph_index}
Ph_90err   : 90% error of the photon index
Epeak      : Epeak in keV
Epeak_90err: 90% error of Epeak
Norm       : normalization at 50 keV in both the PL model and CPL model
Nomr_90err : 90% error of the normalization
chi2       : Chi-Squared
dof        : degree of freedo

=== Time-averaged spectral analysis ===
(Best model with acceptable fit: N/A)

Model Ph_index Ph_90err_low Ph_90err_hi  Epeak  Epeak_90err_low  Epeak_90err_hi  Norm       Nomr_90err_low    Norm_90err_hi    chi2    dof
PL      -1.930    -0.065      0.064       -           -               -         9.63e-03     -3.39e-04          3.38e-04      60.560   57
CPL     -1.642    -0.256      0.274       59.248     -11.573        78.014      1.35e-02     -3.47e-03          5.08e-03      56.860   56


=== 1-s peak spectral analysis ===
(Best model with acceptable fit: N/A)

Model Ph_index Ph_90err_low Ph_90err_hi  Epeak  Epeak_90err_low  Epeak_90err_hi  Norm       Nomr_90err_low    Norm_90err_hi    chi2    dof
PL      -1.664     -0.171     0.169       -           -               -         2.05e-02     -2.10e-03          2.08e-03      58.450   57
CPL     -1.667     -0.169     0.173     9999.340    -9999.330      -9999.340      2.04e-02     -1.09e-02          1.96e-02      58.460   56


=== Fluence/Peak Flux Summary ===

              Model    Band1     Band2     Band3     Band4     Band5     Total
                       15-25     25-50    50-100    100-350    15-150    15-350    keV
Fluence         PL   7.71e-07  1.09e-06  1.15e-06  2.22e-06  3.70e-06  5.22e-06   erg/cm2
      90%_error_low -4.42e-08 -3.69e-08 -5.53e-08 -2.22e-07 -1.28e-07 -2.67e-07   erg/cm2
      90%_error_hi   4.51e-08  3.69e-08  5.53e-08  2.39e-07  1.29e-07  2.79e-07   erg/cm2
Peak flux       PL   9.87e-01  9.02e-01  5.69e-01  5.50e-01  2.69e+00  3.01e+00   ph/cm2/s
      90%_error_low -1.55e-01 -9.03e-02 -7.47e-02 -1.33e-01 -2.64e-01 -2.90e-01   ph/cm2/s
      90%_error_hi   1.60e-01  8.98e-02  7.41e-02  1.56e-01  2.64e-01  2.90e-01   ph/cm2/s

Fluence        CPL   7.34e-07  1.12e-06  1.15e-06  1.43e-06  3.61e-06  4.43e-06   erg/cm2
      90%_error_low -5.43e-08 -4.36e-08 -5.76e-08 -4.40e-07 -1.54e-07 -4.73e-07   erg/cm2
      90%_error_hi   5.51e-08  4.41e-08  5.79e-08  6.77e-07  1.54e-07  6.94e-07   erg/cm2
Peak flux      CPL   9.95e-01  9.01e-01  5.68e-01  5.65e-01  2.69e+00  3.01e+00   ph/cm2/s
      90%_error_low -1.70e-01 -8.84e-02 -7.36e-02 -3.03e-01 -2.75e-01 -2.95e-01   ph/cm2/s
      90%_error_hi   1.54e-01  1.03e-01  7.67e-02  6.84e-02  2.68e-01  2.82e-01   ph/cm2/s

======================================================================
Image
Pre-slew 15.0-350.0 keV image (Event data)
#   RAcent    DECcent   POSerr    Theta     Phi              Peak Cts       SNR   Name
  190.9728    89.1803   0.0042    34.2555  -144.9794         5.1340339     45.540 TRIG_01101053

Foreground time interval of the image:
-14.420  11.949 (delta_t =  26.369 [sec])
Background time interval of the image:
-239.552 -14.420 (delta_t = 225.132 [sec])
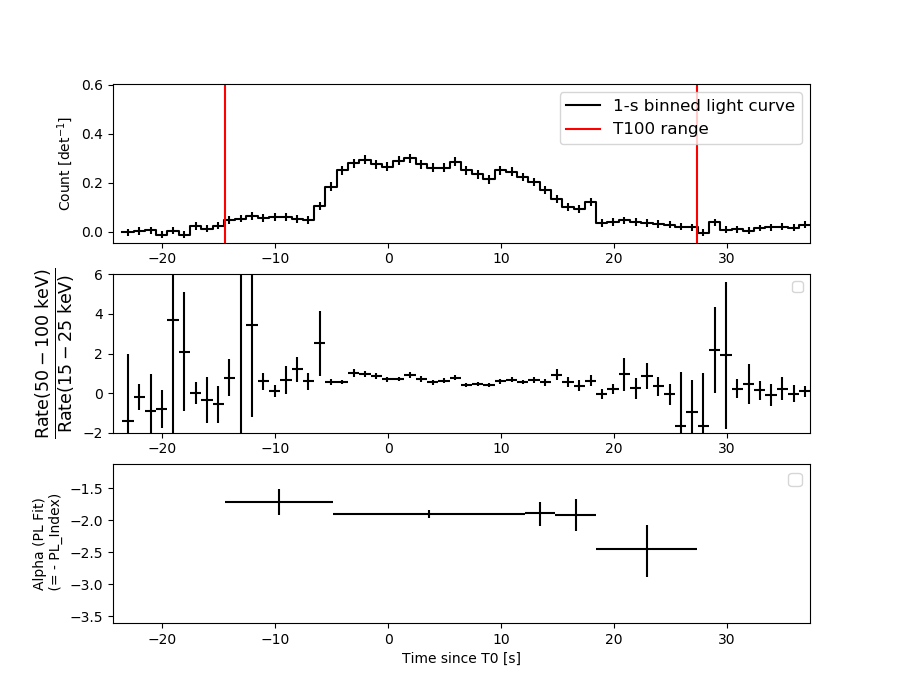
Light Curves
Note: The mask-weighted lightcurves have units of either count/det or counts/sec/det, where a det is 0.4 x 0.4 = 0.16 sq cm.
Full-time range; 1 s binning
Other quick-look light curves:
- 64 ms binning (zoomed)
- 16 ms binning (zoomed)
- 8 ms binning (zoomed)
- 2 ms binning (zoomed)
- SN=5 or 10 s binning (full-time range)
- Raw light curve
Spectra
- 64 ms binning (zoomed)
- 16 ms binning (zoomed)
- 8 ms binning (zoomed)
- 2 ms binning (zoomed)
- SN=5 or 10 s binning (full-time range)
- Raw light curve
Spectra
Notes:
- 1) The fitting includes the systematic errors.
- 2) When the burst includes telescope slew time periods, the fitting uses an average response file made from multiple 5-s response files through out the slew time plus single time preiod for the non-slew times, and weighted by the total counts in the corresponding time period using addrmf. An average response file is needed becuase a spectral fit using the pre-slew DRM will introduce some errors in both a spectral shape and a normalization if the PHA file contains a lot of the slew/post-slew time interval.
- 3) For fits to more complicated models (e.g. a power-law over a cutoff power-law), the BAT team has decided to require a chi-square improvement of more than 6 for each extra dof.
Time averaged spectrum fit using the average DRM
Power-law model
Time interval is from  -14.420 sec. to   27.396 sec.

Spectral model in power-law:
------------------------------------------------------------
Parameters  : value       lower 90%   higher 90%
Photon index: -1.93037     ( -0.0647122   0.0641229 )
Norm@50keV  : 9.62971E-03    ( -0.000339221   0.000337821 )
------------------------------------------------------------
#Fit statistic  : Chi-Squared                   60.56     using 59 bins.
 Reduced chi-squared = 1.06246
# Null hypothesis probability of 3.49e-01 with 57 degrees of freedom

Photon flux (15-150 keV)    in 41.82 sec: 1.40022 ( -0.05004  0.05023 ) ph/cm2/s
Energy fluence (15-150 keV)             : 3.70479e-06 ( -1.28162e-07  1.28519e-07 ) ergs/cm2
Cutoff power-law model
Time interval is from  -14.420 sec. to   27.396 sec.
Spectral model in the cutoff power-law:
------------------------------------------------------------
Parameters  : value       lower 90%   higher 90%
Photon index: -1.64218     ( -0.256366   0.273615 )
Epeak [keV] : 59.2477      ( -11.5735 78.0145 )
Norm@50keV  : 1.35480E-02    ( -0.00346826   0.00508178 )
------------------------------------------------------------
#Fit statistic  : Chi-Squared                   56.86     using 59 bins.
 Reduced chi-squared = 1.01536
# Null hypothesis probability of 4.43e-01 with 56 degrees of freedom

Photon flux (15-150 keV)    in 41.82 sec: 1.37067 ( -0.05601  0.0562 ) ph/cm2/s
Energy fluence (15-150 keV)             : 3.60657e-06 ( -1.5446e-07  1.53835e-07 ) ergs/cm2
1-s peak spectrum fit
Power-law model

Time interval is from    1.064 sec. to    2.064 sec.

Spectral model in power-law:
------------------------------------------------------------
Parameters  : value       lower 90%   higher 90%
Photon index: -1.66439     ( -0.171316   0.168726 )
Norm@50keV  : 2.04833E-02    ( -0.0021028   0.00207983 )
------------------------------------------------------------
#Fit statistic  : Chi-Squared                   58.45     using 59 bins.
 Reduced chi-squared = 1.02544
# Null hypothesis probability of 4.22e-01 with 57 degrees of freedom

Photon flux (15-150 keV)    in 1 sec: 2.68755 ( -0.26388  0.26427 ) ph/cm2/s
Energy fluence (15-150 keV)             : 1.90265e-07 ( -2.05579e-08  2.07192e-08 ) ergs/cm2
Cutoff power-law model
Time interval is from    1.064 sec. to    2.064 sec.
Spectral model in the cutoff power-law:
------------------------------------------------------------
Parameters  : value       lower 90%   higher 90%
Photon index: -1.66663     ( -0.169888   0.172253 )
Epeak [keV] : 9999.34      ( -9999.35 -9999.36 )
Norm@50keV  : 2.04297E-02    ( -0.0110125   0.0194697 )
------------------------------------------------------------
#Fit statistic  : Chi-Squared                   58.46     using 59 bins.
 Reduced chi-squared = 1.04393
# Null hypothesis probability of 3.85e-01 with 56 degrees of freedom

Photon flux (15-150 keV)    in 1 sec: 2.69099 ( -0.27459  0.26764 ) ph/cm2/s
Energy fluence (15-150 keV)             : 1.90687e-07 ( -1.21945e-08  2.08274e-08 ) ergs/cm2
Time-resolved spectra
Distribution
T90 vs. Hardness ratio plot
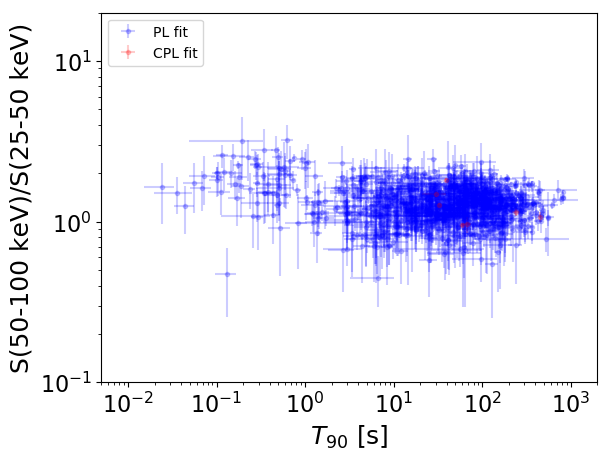
T90                                   = N/A sec.
Hardness ratio (energy fluence ratio) = N/A
S(15-50 keV) vs. S(50-150 keV) plot
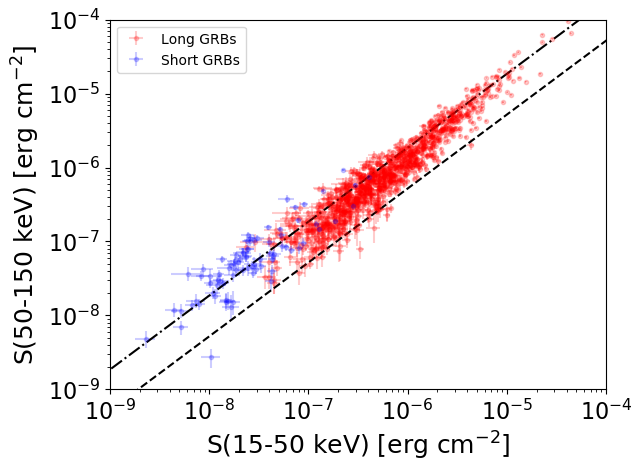
S(15-50 keV)  = N/A
S(50-150 keV) = N/A
The dash-dotted line and the dashed line traces the fluences calculated from the Band function with Epeak = 15 and 150 keV, respectively. Both lines assume a canonical values of alpha = -1 and beta = -2.5.
Mask shadow pattern
IMX = -5.577144555556388E-01, IMY = 3.908152373076193E-01
Spacecraft aspect plot
Bright source in the pre-burst/pre-slew/post-slew images
Pre-burst image of 15-350 keV band
Time interval of the image:
-239.552000 -14.420000

# RAcent  DECcent POSerr Theta    Phi  PeakCts   SNR AngSep     Name
#  [deg]    [deg]    ['] [deg]  [deg]                   [']
254.4401  35.3844    2.8  21.1   12.6   1.2651   4.2    2.7	Her X-1
288.7860  10.9194    3.3  56.3  -19.6   3.4671   3.5    1.7	GRS 1915+105
299.6157  35.2150    1.0  42.4  -49.3   7.7473  11.1    1.5	Cyg X-1
308.2631  40.8563   27.5  43.4  -62.2   0.4978   0.4    9.0	Cyg X-3
252.3759   2.6894    4.0  53.0   26.0   3.2551   2.9 ------	UNKNOWN
218.9846  40.2576    2.4  22.5   94.8   1.7622   4.8 ------	UNKNOWN
179.4802  54.9803    2.7  35.7  153.3   1.9719   4.4 ------	UNKNOWN
127.0683  71.7576    2.7  45.7 -166.7   2.2950   4.2 ------	UNKNOWN
300.0947  34.3563    3.0  43.3  -48.8   2.6209   3.9 ------	UNKNOWN
 22.0912  73.6895    2.6  47.9 -129.1   5.8130   4.5 ------	UNKNOWN
Pre-slew background subtracted image of 15-350 keV band
Time interval of the image:
-14.420000 11.948600

# RAcent  DECcent POSerr Theta    Phi  PeakCts   SNR AngSep     Name
#  [deg]    [deg]    ['] [deg]  [deg]                   [']
254.3434  35.4243   18.7  21.0   12.8   0.0509   0.6    7.4	Her X-1
288.7525  11.0173    4.2  56.2  -19.6   0.9064   2.7    5.1	GRS 1915+105
299.7838  35.2817   61.1  42.4  -49.5  -0.0403  -0.2   10.6	Cyg X-1
308.0482  40.8627    4.1  43.3  -62.0   0.9868   2.9    6.1	Cyg X-3
284.3199   5.9781    2.1  58.7  -12.3   2.7572   5.5 ------	UNKNOWN
284.5508   6.1482    2.4  58.6  -12.6   2.6392   5.3 ------	UNKNOWN
190.9732  89.1803    0.3  34.3 -145.0   5.1337  45.5 ------	UNKNOWN
Post-slew image of 15-350 keV band
Time interval of the image:
83.948600 962.479900

# RAcent  DECcent POSerr Theta    Phi  PeakCts   SNR AngSep     Name
#  [deg]    [deg]    ['] [deg]  [deg]                   [']
299.5862  35.1984    0.9  55.1  -17.0  31.7397  13.1    0.3	Cyg X-1
308.2970  40.9619    7.5  49.4  -25.8  -3.3352  -1.5    8.5	Cyg X-3
257.6382  39.8537    2.7  49.8   24.9   8.1328   4.3 ------	UNKNOWN
188.3550  66.7495    3.0  22.4   94.9   4.8727   3.8 ------	UNKNOWN
109.8627  33.0489    2.8  56.8  173.8  14.6252   4.1 ------	UNKNOWN
106.2693  33.0364    3.1  56.9  177.4  14.3876   3.7 ------	UNKNOWN
 68.9251  35.2414    4.4  55.2 -145.3  13.9234   2.7 ------	UNKNOWN