Analysis Summary
Notes:
- 1) No attempt has been made to eliminate the non-significant decimal places.
- 2) This batgrbproduct analysis is done using the HEASARC data.
- 3) This batgrbproduct analysis is using the flight position for the mask-weighting calculation.
======================================================================
BAT GRB EVENT DATA PROCESSING REPORT
Process Script Ver: batgrbproduct v2.48
Process Start Time: Sun Oct 23 23:30:13 EDT 2022
Host Name: batproc1
Current Working Dir: /local/data/bat1/alien/Swift_3rdBATcatalog/event/batevent_reproc/trigger1101133
======================================================================
Trigger: 01101133 Segment: 000
BAT Trigger Time: 670766099.328 [s; MET]
Trigger Stop: 670766103.424 [s; MET]
UTC: 2022-04-04T11:54:30.425640 [includes UTCF correction]
Where From?: TDRSS position message
BAT
RA: 50.4479028747465 Dec: 10.0045665363642 [deg; J2000]
Catalogged Source?: NO
Point Source?: YES
GRB Indicated?: YES [ by BAT flight software ]
Image S/N Ratio: 7.5
Image Trigger?: NO
Rate S/N Ratio: 10.5830052442584 [ if not an image trigger ]
Image S/N Ratio: 7.5
Analysis Position: [ source = BAT ]
RA: 50.4479028747465 Dec: 10.0045665363642 [deg; J2000]
Refined Position: [ source = BAT pre-slew burst ]
RA: 50.4282334137913 Dec: 10.0076209502814 [deg; J2000]
{ 03h 21m 42.8s , +10d 00' 27.4" }
+/- 2.89031843701255 [arcmin] (estimated 90% radius based on SNR)
+/- 1.3680853052548 [arcmin] (formal 1-sigma fit error)
SNR: 6.6776635335837
Angular difference between the analysis and refined position is 1.176577 arcmin
Partial Coding Fraction: 0.4726562 [ including projection effects ]
Duration
T90: 5.28000009059906 +/- 0.946707916396232
Measured from: 0.368000030517578
to: 5.64800012111664 [s; relative to TRIGTIME]
T50: 3.08800005912781 +/- 2.05405350304355
Measured from: 1.39200007915497
to: 4.48000013828278 [s; relative to TRIGTIME]
Fluence
Peak Flux (peak 1 second)
Measured from: 1.15600001811981
to: 2.15600001811981 [s; relative to TRIGTIME]
Total Fluence
Measured from: 0.160000085830688
to: 5.98400008678436 [s; relative to TRIGTIME]
Band 1 Band 2 Band 3 Band 4
15-25 25-50 50-100 100-350 keV
Total 0.097886 0.145983 0.091488 -0.007296
0.022609 0.023439 0.020851 0.019770 [error]
Peak 0.039030 0.046900 0.034368 0.003357
0.009711 0.010178 0.008846 0.008473 [error]
[ fluence units of on-axis counts / fully illuminated detector ]
======================================================================
====== Table of the duration information =============================
Value tstart tstop
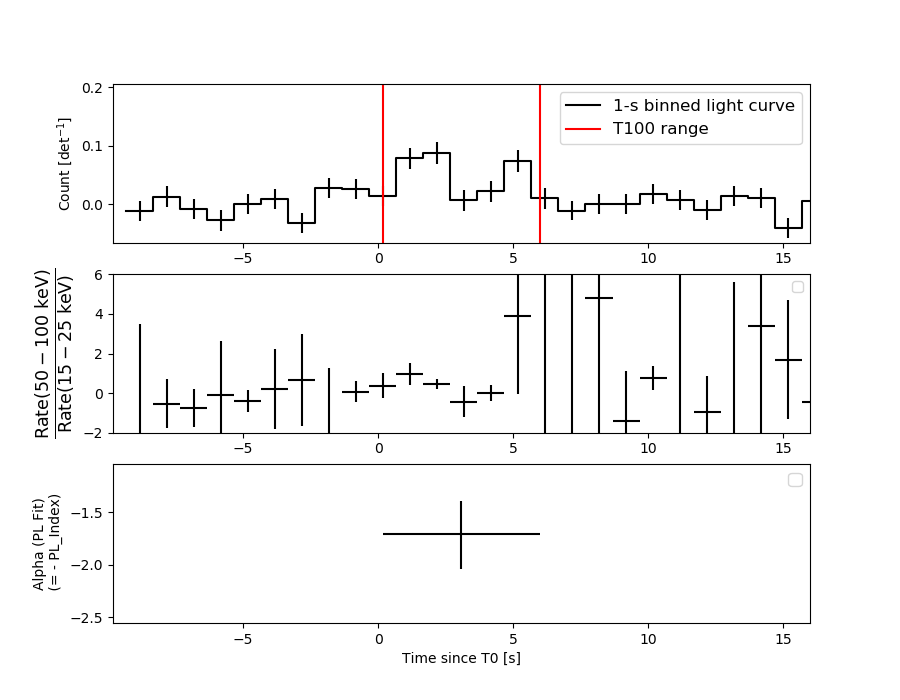
T100 5.824 0.160 5.984
T90 5.280 0.368 5.648
T50 3.088 1.392 4.480
Peak 1.000 1.156 2.156
====== Spectral Analysis Summary =====================================
Model : spectral model: simple power-law (PL) and cutoff power-law (CPL)
Ph_index : photon index: E^{Ph_index}
Ph_90err : 90% error of the photon index
Epeak : Epeak in keV
Epeak_90err: 90% error of Epeak
Norm : normalization at 50 keV in both the PL model and CPL model
Nomr_90err : 90% error of the normalization
chi2 : Chi-Squared
dof : degree of freedo
=== Time-averaged spectral analysis ===
(Best model with acceptable fit: N/A)
Model Ph_index Ph_90err_low Ph_90err_hi Epeak Epeak_90err_low Epeak_90err_hi Norm Nomr_90err_low Norm_90err_hi chi2 dof
PL -1.712 -0.333 0.316 - - - 4.02e-03 -8.61e-04 8.41e-04 46.030 57
CPL -0.133 -1.635 2.663 51.636 -12.652 -51.636 3.03e-02 -3.03e-02 8.42e-01 43.400 56
=== 1-s peak spectral analysis ===
(Best model with acceptable fit: N/A)
Model Ph_index Ph_90err_low Ph_90err_hi Epeak Epeak_90err_low Epeak_90err_hi Norm Nomr_90err_low Norm_90err_hi chi2 dof
PL -1.735 -0.424 0.401 - - - 7.96e-03 -2.17e-03 2.10e-03 45.730 57
CPL -1.178 -1.040 2.366 62.443 -51.711 -62.443 1.67e-02 -1.67e-02 5.11e-01 45.310 56
=== Fluence/Peak Flux Summary ===
Model Band1 Band2 Band3 Band4 Band5 Total
15-25 25-50 50-100 100-350 15-150 15-350 keV
Fluence PL 3.65e-08 5.90e-08 7.20e-08 1.73e-07 2.17e-07 3.40e-07 erg/cm2
90%_error_low -9.96e-09 -1.12e-08 -2.00e-08 -8.02e-08 -4.75e-08 -1.04e-07 erg/cm2
90%_error_hi 1.05e-08 1.12e-08 2.03e-08 1.16e-07 4.88e-08 1.32e-07 erg/cm2
Peak flux PL 4.10e-01 3.60e-01 2.16e-01 1.96e-01 1.07e+00 1.18e+00 ph/cm2/s
90%_error_low -1.40e-01 -8.55e-02 -7.35e-02 -1.04e-01 -2.53e-01 -2.84e-01 ph/cm2/s
90%_error_hi 1.49e-01 8.53e-02 7.46e-02 1.59e-01 2.54e-01 2.86e-01 ph/cm2/s
Fluence CPL 3.07e-08 7.04e-08 6.97e-08 2.31e-08 1.89e-07 1.94e-07 erg/cm2
90%_error_low -1.26e-08 -1.64e-08 -2.66e-08 -2.08e-08 -4.70e-08 -5.16e-08 erg/cm2
90%_error_hi 1.24e-08 1.75e-08 2.46e-08 1.67e-07 5.56e-08 1.69e-07 erg/cm2
Peak flux CPL 3.92e-01 3.87e-01 2.16e-01 9.04e-02 1.05e+00 1.09e+00 ph/cm2/s
90%_error_low -1.51e-01 -1.06e-01 -1.02e-01 -9.04e-02 -2.57e-01 -2.81e-01 ph/cm2/s
90%_error_hi 1.56e-01 1.23e-01 8.20e-02 1.45e-01 2.57e-01 3.19e-01 ph/cm2/s
======================================================================
Image
Pre-slew 15.0-350.0 keV image (Event data)
#   RAcent    DECcent   POSerr    Theta     Phi              Peak Cts       SNR   Name
   50.4282    10.0076   0.0288    36.0172   -44.8161         0.3083608      6.678 TRIG_01101133

Foreground time interval of the image:
  0.160   5.984 (delta_t =   5.824 [sec])
Background time interval of the image:
-79.027   0.160 (delta_t =  79.187 [sec])
Light Curves
Note: The mask-weighted lightcurves have units of either count/det or counts/sec/det, where a det is 0.4 x 0.4 = 0.16 sq cm.
Full-time range; 1 s binning
Other quick-look light curves:
- 64 ms binning (zoomed)
- 16 ms binning (zoomed)
- 8 ms binning (zoomed)
- 2 ms binning (zoomed)
- SN=5 or 10 s binning (full-time range)
- Raw light curve
Spectra
- 64 ms binning (zoomed)
- 16 ms binning (zoomed)
- 8 ms binning (zoomed)
- 2 ms binning (zoomed)
- SN=5 or 10 s binning (full-time range)
- Raw light curve
Spectra
Notes:
- 1) The fitting includes the systematic errors.
- 2) When the burst includes telescope slew time periods, the fitting uses an average response file made from multiple 5-s response files through out the slew time plus single time preiod for the non-slew times, and weighted by the total counts in the corresponding time period using addrmf. An average response file is needed becuase a spectral fit using the pre-slew DRM will introduce some errors in both a spectral shape and a normalization if the PHA file contains a lot of the slew/post-slew time interval.
- 3) For fits to more complicated models (e.g. a power-law over a cutoff power-law), the BAT team has decided to require a chi-square improvement of more than 6 for each extra dof.
Time averaged spectrum fit using the average DRM
Power-law model
Time interval is from    0.160 sec. to    5.984 sec.

Spectral model in power-law:
------------------------------------------------------------
Parameters  : value       lower 90%   higher 90%
Photon index: -1.71215     ( -0.333339   0.316365 )
Norm@50keV  : 4.02356E-03    ( -0.000861351   0.000840867 )
------------------------------------------------------------
#Fit statistic  : Chi-Squared                   46.03     using 59 bins.
 Reduced chi-squared = 0.807544
# Null hypothesis probability of 8.50e-01 with 57 degrees of freedom

Photon flux (15-150 keV)    in 5.824 sec: 0.536685 ( -0.102165  0.10224 ) ph/cm2/s
Energy fluence (15-150 keV)             : 2.16796e-07 ( -4.74514e-08  4.87509e-08 ) ergs/cm2
Cutoff power-law model
Time interval is from    0.160 sec. to    5.984 sec.
Spectral model in the cutoff power-law:
------------------------------------------------------------
Parameters  : value       lower 90%   higher 90%
Photon index: -0.133208     ( -1.65337   2.64544 )
Epeak [keV] : 51.6355      ( -12.5116 -51.4948 )
Norm@50keV  : 3.02942E-02    ( -0.0314152   0.840997 )
------------------------------------------------------------
#Fit statistic  : Chi-Squared                   43.40     using 59 bins.
 Reduced chi-squared = 0.775
# Null hypothesis probability of 8.90e-01 with 56 degrees of freedom

Photon flux (15-150 keV)    in 5.824 sec: 0.507251 ( -0.107432  0.107293 ) ph/cm2/s
Energy fluence (15-150 keV)             : 1.8893e-07 ( -4.69617e-08  5.56447e-08 ) ergs/cm2
1-s peak spectrum fit
Power-law model
Time interval is from    1.156 sec. to    2.156 sec.

Spectral model in power-law:
------------------------------------------------------------
Parameters  : value       lower 90%   higher 90%
Photon index: -1.73461     ( -0.424281   0.400682 )
Norm@50keV  : 7.95755E-03    ( -0.0021662   0.00209577 )
------------------------------------------------------------
#Fit statistic  : Chi-Squared                   45.73     using 59 bins.
 Reduced chi-squared = 0.802281
# Null hypothesis probability of 8.58e-01 with 57 degrees of freedom

Photon flux (15-150 keV)    in 1 sec: 1.07000 ( -0.253469  0.25361 ) ph/cm2/s
Energy fluence (15-150 keV)             : 7.35072e-08 ( -2.0127e-08  2.08772e-08 ) ergs/cm2
Cutoff power-law model
Time interval is from    1.156 sec. to    2.156 sec.
Spectral model in the cutoff power-law:
------------------------------------------------------------
Parameters  : value       lower 90%   higher 90%
Photon index: -1.17783     ( -1.04014   2.36601 )
Epeak [keV] : 62.4434      ( -51.7153 -62.4475 )
Norm@50keV  : 1.67324E-02    ( -0.0167291   0.510946 )
------------------------------------------------------------
#Fit statistic  : Chi-Squared                   45.31     using 59 bins.
 Reduced chi-squared = 0.809107
# Null hypothesis probability of 8.46e-01 with 56 degrees of freedom

Photon flux (15-150 keV)    in 1 sec: 1.05304 ( -0.256637  0.25722 ) ph/cm2/s
Energy fluence (15-150 keV)             : 6.90987e-08 ( -2.2867e-08  2.34009e-08 ) ergs/cm2
Time-resolved spectra
Distribution
T90 vs. Hardness ratio plot
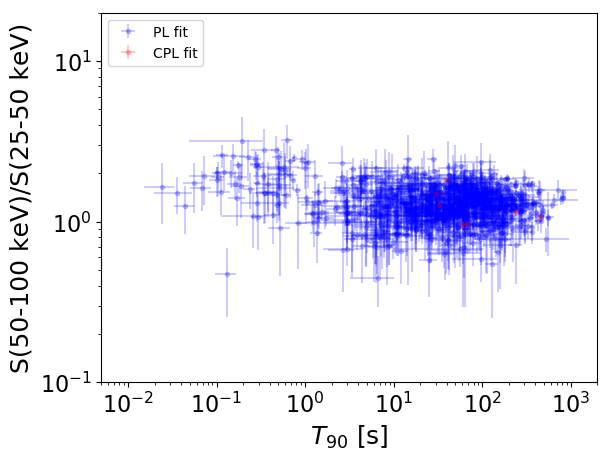
T90                                   = N/A sec.
Hardness ratio (energy fluence ratio) = N/A
S(15-50 keV) vs. S(50-150 keV) plot
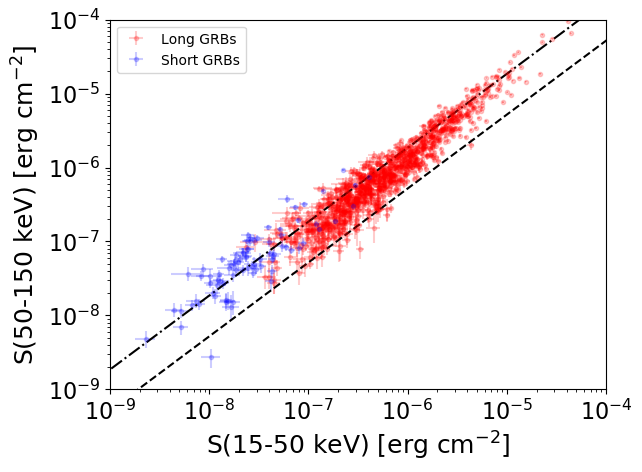
S(15-50 keV)  = N/A
S(50-150 keV) = N/A
The dash-dotted line and the dashed line traces the fluences calculated from the Band function with Epeak = 15 and 150 keV, respectively. Both lines assume a canonical values of alpha = -1 and beta = -2.5.
Mask shadow pattern
IMX = 5.157150162567080E-01, IMY = 5.124147426178338E-01
Spacecraft aspect plot
Bright source in the pre-burst/pre-slew/post-slew images
Pre-burst image of 15-350 keV band
Time interval of the image:
-79.027410 0.160000

# RAcent  DECcent POSerr Theta    Phi  PeakCts   SNR AngSep     Name
#  [deg]    [deg]    ['] [deg]  [deg]                   [']
 83.6393  22.0199    0.9  44.8    7.2   3.2857  12.9    0.5	Crab
 96.7568 -18.2928    1.8  25.6   78.2   1.2565   6.5 ------	UNKNOWN
 87.7215 -55.8113    2.0  37.7  152.2   1.5252   5.7 ------	UNKNOWN
 65.2019  20.0533    2.7  40.9  -17.7   0.8975   4.3 ------	UNKNOWN
Pre-slew background subtracted image of 15-350 keV band
Time interval of the image:
0.160000 5.984000

# RAcent  DECcent POSerr Theta    Phi  PeakCts   SNR AngSep     Name
#  [deg]    [deg]    ['] [deg]  [deg]                   [']
 83.7633  22.0954    7.9  44.9    7.3  -0.0827  -1.4    8.7	Crab
 84.3811 -67.5624    2.1  47.8  161.2   0.4228   5.5 ------	UNKNOWN
 83.9876 -34.6690    2.3  18.9  129.8   0.1593   5.1 ------	UNKNOWN
 70.6306   5.7615    2.6  26.4   -9.2   0.1378   4.5 ------	UNKNOWN
 66.5511   2.3224    2.3  23.2  -19.3   0.1441   5.0 ------	UNKNOWN
 50.4282  10.0076    1.7  36.0  -44.8   0.3082   6.7 ------	UNKNOWN
Post-slew image of 15-350 keV band
Time interval of the image:
817.972600 962.737200

# RAcent  DECcent POSerr Theta    Phi  PeakCts   SNR AngSep     Name
#  [deg]    [deg]    ['] [deg]  [deg]                   [']
 83.6231  22.0110    1.2  51.7 -159.1   5.4430   9.6    0.6	Crab