Analysis Summary
Notes:
- 1) No attempt has been made to eliminate the non-significant decimal places.
- 2) This batgrbproduct analysis is done using the HEASARC data.
- 3) This batgrbproduct analysis is using the flight position for the mask-weighting calculation.
======================================================================
                  BAT GRB EVENT DATA PROCESSING REPORT
    Process Script Ver: batgrbproduct v2.48
    Process Start Time: Sun Oct 23 23:29:05 EDT 2022
             Host Name: batproc1
   Current Working Dir: /local/data/bat1/alien/Swift_3rdBATcatalog/event/batevent_reproc/trigger1101675
======================================================================

  Trigger: 01101675      Segment: 000

  BAT Trigger Time: 671089593.152   [s; MET]
      Trigger Stop: 671089593.664   [s; MET]
               UTC: 2022-04-08T05:46:04.227800    [includes UTCF correction]
       Where From?: TDRSS position message

  BAT
    RA: 202.402022913259   Dec: 47.0613353293178  [deg; J2000]

     Catalogged Source?: YES
     Point Source?:      YES
     GRB Indicated?:     NO    [ by BAT flight software ]
     Image S/N Ratio:    12.8
     Image Trigger?:     NO
     Rate S/N Ratio:     28.5657137141714  [ if not an image trigger ]
     Image S/N Ratio:    12.8

  Analysis Position:   [ source = BAT ]
    RA: 202.402022913259   Dec: 47.0613353293178  [deg; J2000]

  Refined Position:   [ source = BAT pre-slew burst ]
    RA: 202.395819101389   Dec: 47.0653684886708  [deg; J2000]
        { 13h 29m 35.0s , +47d 03' 55.3" }
         +/- 1.19354342085177 [arcmin] (estimated 90% radius based on SNR)
         +/- 0.530967607750412 [arcmin] (formal 1-sigma fit error)
    SNR: 23.623785450518

  Angular difference between the analysis and refined position is 0.350501 arcmin

  Partial Coding Fraction: 0.3476562    [ including projection effects ]

  Duration
     T90: 17.2439999580383 +/- 1.10910416533713
        Measured from: -0.0799999237060547
                   to: 17.1640000343323     [s; relative to TRIGTIME]
     T50: 4.42400002479553 +/- 1.56708644468565
        Measured from: 1.35199999809265
                   to: 5.77600002288818     [s; relative to TRIGTIME]


  Fluence
     Peak Flux  (peak 1 second)
        Measured from: 2.4760000705719
                   to: 3.4760000705719     [s; relative to TRIGTIME]
     Total Fluence
        Measured from: -0.547999978065491
                   to: 18.2560000419617     [s; relative to TRIGTIME]

             Band 1     Band 2     Band 3     Band 4
              15-25      25-50     50-100    100-350     keV
 Total     0.867562   0.902255   0.457872  -0.043965
           0.050107   0.052101   0.044539   0.039121 [error]
 Peak      0.176859   0.237054   0.098887  -0.003460
           0.014780   0.016092   0.012696   0.009361 [error]

     [ fluence units of on-axis counts / fully illuminated detector ]

======================================================================


====== Table of the duration information =============================

        Value   tstart    tstop
T100   18.804   -0.548   18.256
T90    17.244   -0.080   17.164
T50     4.424    1.352    5.776
Peak    1.000    2.476    3.476


====== Spectral Analysis Summary =====================================

Model      : spectral model: simple power-law (PL) and cutoff power-law (CPL)
Ph_index   : photon index: E^{Ph_index}
Ph_90err   : 90% error of the photon index
Epeak      : Epeak in keV
Epeak_90err: 90% error of Epeak
Norm       : normalization at 50 keV in both the PL model and CPL model
Nomr_90err : 90% error of the normalization
chi2       : Chi-Squared
dof        : degree of freedo

=== Time-averaged spectral analysis ===
(Best model with acceptable fit: N/A)

Model Ph_index Ph_90err_low Ph_90err_hi  Epeak  Epeak_90err_low  Epeak_90err_hi  Norm       Nomr_90err_low    Norm_90err_hi    chi2    dof
PL      -2.137    -0.130      0.125       -           -               -         7.13e-03     -6.25e-04          6.17e-04      68.280   57
CPL     -1.159    -0.534      0.613       35.676     -10.050         6.823      2.61e-02     -1.31e-02          3.31e-02      57.370   56


=== 1-s peak spectral analysis ===
(Best model with acceptable fit: N/A)

Model Ph_index Ph_90err_low Ph_90err_hi  Epeak  Epeak_90err_low  Epeak_90err_hi  Norm       Nomr_90err_low    Norm_90err_hi    chi2    dof
PL      -2.094     -0.143     0.136       -           -               -         3.09e-02     -3.23e-03          3.19e-03      78.400   57
CPL      0.041     -0.783     0.945       39.404      -4.136         4.478      5.38e-01     -5.38e-01          1.41e+00      50.450   56


=== Fluence/Peak Flux Summary ===

              Model    Band1     Band2     Band3     Band4     Band5     Total
                       15-25     25-50    50-100    100-350    15-150    15-350    keV
Fluence         PL   3.12e-07  3.90e-07  3.55e-07  5.62e-07  1.25e-06  1.62e-06   erg/cm2
      90%_error_low -2.95e-08 -2.68e-08 -4.19e-08 -1.20e-07 -9.79e-08 -1.72e-07   erg/cm2
      90%_error_hi   3.01e-08  2.68e-08  4.26e-08  1.40e-07  9.92e-08  1.86e-07   erg/cm2
Peak flux       PL   2.26e+00  1.60e+00  7.50e-01  4.93e-01  4.84e+00  5.10e+00   ph/cm2/s
      90%_error_low -2.55e-01 -1.37e-01 -9.89e-02 -1.10e-01 -4.16e-01 -4.36e-01   ph/cm2/s
      90%_error_hi   2.60e-01  1.37e-01  9.99e-02  1.27e-01  4.16e-01  4.36e-01   ph/cm2/s

Fluence        CPL   2.86e-07  4.35e-07  3.38e-07  1.34e-07  1.15e-06  1.19e-06   erg/cm2
      90%_error_low -3.34e-08 -3.57e-08 -5.20e-08 -7.13e-08 -1.04e-07 -1.28e-07   erg/cm2
      90%_error_hi   3.36e-08  3.65e-08  5.00e-08  1.42e-07  1.08e-07  1.73e-07   erg/cm2
Peak flux      CPL   1.86e+00  2.03e+00  7.28e-01  6.04e-02  4.67e+00  4.68e+00   ph/cm2/s
      90%_error_low -2.97e-01 -2.01e-01 -1.39e-01 -3.70e-02 -4.17e-01 -4.19e-01   ph/cm2/s
      90%_error_hi   3.00e-01  2.06e-01  1.34e-01  6.87e-02  4.18e-01  4.21e-01   ph/cm2/s

======================================================================
Image
Pre-slew 15.0-350.0 keV image (Event data)
#   RAcent    DECcent   POSerr    Theta     Phi              Peak Cts       SNR   Name
  202.3958    47.0654   0.0081    37.1088   146.9556         2.0030748     23.624 TRIG_01101675

Foreground time interval of the image:
 -0.548  10.149 (delta_t =  10.697 [sec])
Background time interval of the image:
-51.051  -0.548 (delta_t =  50.503 [sec])
Light Curves
Note: The mask-weighted lightcurves have units of either count/det or counts/sec/det, where a det is 0.4 x 0.4 = 0.16 sq cm.
Full-time range; 1 s binning
Other quick-look light curves:
- 64 ms binning (zoomed)
- 16 ms binning (zoomed)
- 8 ms binning (zoomed)
- 2 ms binning (zoomed)
- SN=5 or 10 s binning (full-time range)
- Raw light curve
Spectra
- 64 ms binning (zoomed)
- 16 ms binning (zoomed)
- 8 ms binning (zoomed)
- 2 ms binning (zoomed)
- SN=5 or 10 s binning (full-time range)
- Raw light curve
Spectra
Notes:
- 1) The fitting includes the systematic errors.
- 2) When the burst includes telescope slew time periods, the fitting uses an average response file made from multiple 5-s response files through out the slew time plus single time preiod for the non-slew times, and weighted by the total counts in the corresponding time period using addrmf. An average response file is needed becuase a spectral fit using the pre-slew DRM will introduce some errors in both a spectral shape and a normalization if the PHA file contains a lot of the slew/post-slew time interval.
- 3) For fits to more complicated models (e.g. a power-law over a cutoff power-law), the BAT team has decided to require a chi-square improvement of more than 6 for each extra dof.
Time averaged spectrum fit using the average DRM
Power-law model
Time interval is from   -0.548 sec. to   18.256 sec.

Spectral model in power-law:
------------------------------------------------------------
Parameters  : value       lower 90%   higher 90%
Photon index: -2.13695     ( -0.130455   0.12535 )
Norm@50keV  : 7.12773E-03    ( -0.000625011   0.000616886 )
------------------------------------------------------------
#Fit statistic  : Chi-Squared                   68.28     using 59 bins.
 Reduced chi-squared = 1.19789
# Null hypothesis probability of 1.46e-01 with 57 degrees of freedom

Photon flux (15-150 keV)    in 18.8 sec: 1.14237 ( -0.07859  0.07865 ) ph/cm2/s
Energy fluence (15-150 keV)             : 1.25008e-06 ( -9.79328e-08  9.91561e-08 ) ergs/cm2
Cutoff power-law model
Time interval is from   -0.548 sec. to   18.256 sec.
Spectral model in the cutoff power-law:
------------------------------------------------------------
Parameters  : value       lower 90%   higher 90%
Photon index: -1.15898     ( -0.533713   0.613502 )
Epeak [keV] : 35.6756      ( -10.0503 6.8226 )
Norm@50keV  : 2.61070E-02    ( -0.0130798   0.0330975 )
------------------------------------------------------------
#Fit statistic  : Chi-Squared                   57.37     using 59 bins.
 Reduced chi-squared = 1.02446
# Null hypothesis probability of 4.24e-01 with 56 degrees of freedom

Photon flux (15-150 keV)    in 18.8 sec: 1.10117 ( -0.08097  0.08115 ) ph/cm2/s
Energy fluence (15-150 keV)             : 1.15361e-06 ( -1.04239e-07  1.07952e-07 ) ergs/cm2
1-s peak spectrum fit
Power-law model
Time interval is from    2.476 sec. to    3.476 sec.

Spectral model in power-law:
------------------------------------------------------------
Parameters  : value       lower 90%   higher 90%
Photon index: -2.09386     ( -0.142883   0.136789 )
Norm@50keV  : 3.08836E-02    ( -0.00323091   0.00319175 )
------------------------------------------------------------
#Fit statistic  : Chi-Squared                   78.40     using 59 bins.
 Reduced chi-squared = 1.37544
# Null hypothesis probability of 3.16e-02 with 57 degrees of freedom

Photon flux (15-150 keV)    in 1 sec: 4.84461 ( -0.41566  0.4158 ) ph/cm2/s
Energy fluence (15-150 keV)             : 2.86807e-07 ( -2.76458e-08  2.79533e-08 ) ergs/cm2
Cutoff power-law model
Time interval is from    2.476 sec. to    3.476 sec.
Spectral model in the cutoff power-law:
------------------------------------------------------------
Parameters  : value       lower 90%   higher 90%
Photon index: 0.0412222     ( -0.785074   0.942641 )
Epeak [keV] : 39.4036      ( -4.13515 4.4791 )
Norm@50keV  : 0.538059    ( -0.539948   1.40583 )
------------------------------------------------------------
#Fit statistic  : Chi-Squared                   50.45     using 59 bins.
 Reduced chi-squared = 0.900893
# Null hypothesis probability of 6.84e-01 with 56 degrees of freedom

Photon flux (15-150 keV)    in 1 sec: 4.67404 ( -0.41718  0.41801 ) ph/cm2/s
Energy fluence (15-150 keV)             : 2.58607e-07 ( -2.63601e-08  2.75537e-08 ) ergs/cm2
Time-resolved spectra
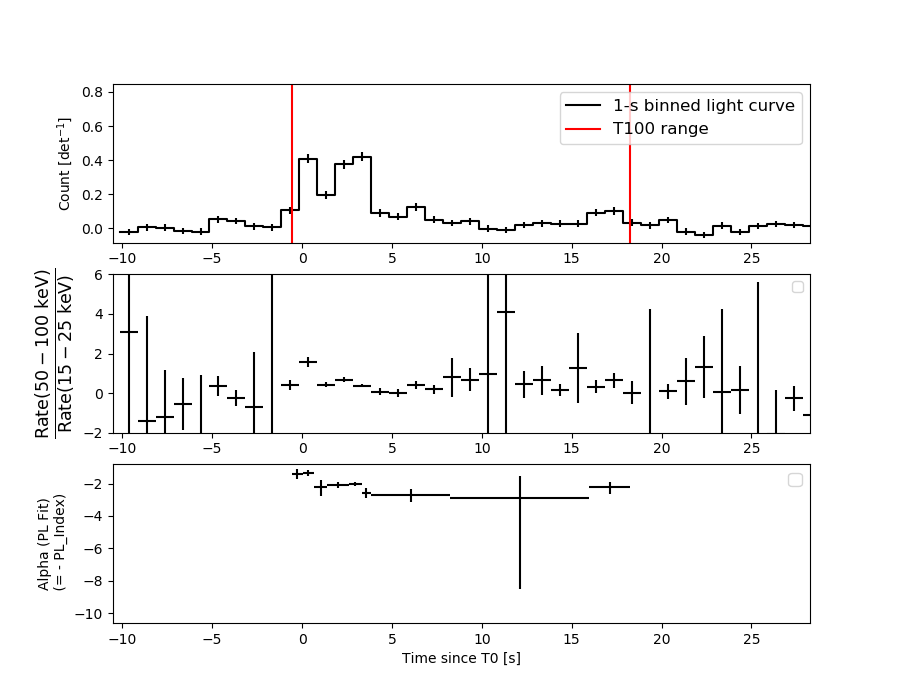
Distribution
T90 vs. Hardness ratio plot
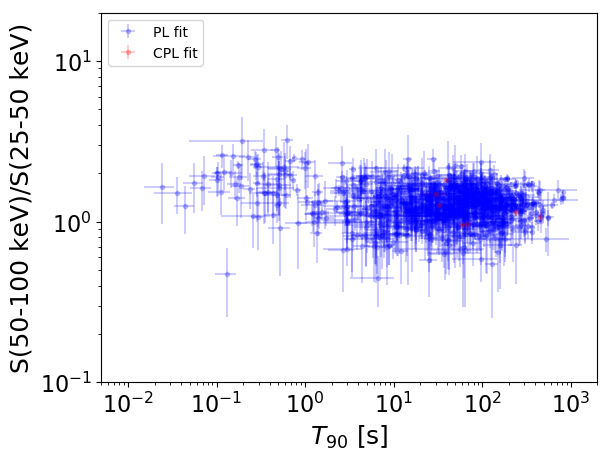
T90                                   = N/A sec.
Hardness ratio (energy fluence ratio) = N/A
S(15-50 keV) vs. S(50-150 keV) plot
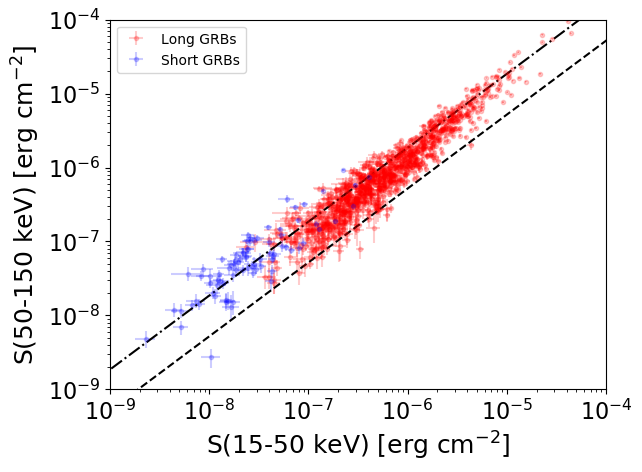
S(15-50 keV)  = N/A
S(50-150 keV) = N/A
The dash-dotted line and the dashed line traces the fluences calculated from the Band function with Epeak = 15 and 150 keV, respectively. Both lines assume a canonical values of alpha = -1 and beta = -2.5.
Mask shadow pattern
IMX = -6.341652372335767E-01, IMY = -4.125302674174665E-01
Spacecraft aspect plot
Bright source in the pre-burst/pre-slew/post-slew images
Pre-burst image of 15-350 keV band
Time interval of the image:
-51.051400 -0.548000

# RAcent  DECcent POSerr Theta    Phi  PeakCts   SNR AngSep     Name
#  [deg]    [deg]    ['] [deg]  [deg]                   [']
254.4086  35.1845   30.8   4.7   18.6   0.0358   0.4    9.8	Her X-1
268.4880  -1.5663    4.9  43.6    6.3   0.3910   2.4    9.9	SW J1753.5-0127
274.0149 -14.1197    5.9  57.2    4.4   1.0207   1.9    5.0	GX 17+2
288.6804  10.8765    5.8  42.5  -28.6  -0.3400  -2.0    8.1	GRS 1915+105
299.5804  35.2010    1.3  36.5  -69.5   1.8255   8.9    0.5	Cyg X-1
308.1922  41.0338    3.7  41.0  -81.8   1.1991   3.1    6.1	Cyg X-3
277.8208  17.6796    2.5  30.5  -22.3   0.5127   4.7 ------	UNKNOWN
286.4542  50.1673    2.5  25.3  -96.9   0.5653   4.6 ------	UNKNOWN
304.8104  38.5920    2.5  39.3  -77.0   1.2933   4.6 ------	UNKNOWN
Pre-slew background subtracted image of 15-350 keV band
Time interval of the image:
-0.548000 10.148580

# RAcent  DECcent POSerr Theta    Phi  PeakCts   SNR AngSep     Name
#  [deg]    [deg]    ['] [deg]  [deg]                   [']
254.4578  35.3322  243.7   4.5   17.8   0.0020   0.0    0.6	Her X-1
268.2799  -1.5222    5.1  43.5    6.5  -0.1808  -2.3    6.7	SW J1753.5-0127
273.9900 -13.9963    5.9  57.1    4.4   0.5320   2.0    2.6	GX 17+2
288.8522  11.0604    7.9  42.5  -29.0  -0.1115  -1.5    7.6	GRS 1915+105
299.4210  35.2621   37.0  36.3  -69.5   0.0273   0.3    9.1	Cyg X-1
308.2433  40.9986    6.5  41.1  -81.8  -0.3260  -1.8    6.6	Cyg X-3
229.5167   4.1897    2.2  41.6   65.9   1.1268   5.3 ------	UNKNOWN
202.3958  47.0654    0.5  37.1  147.0   2.0030  23.6 ------	UNKNOWN
286.6969  45.6739    2.2  24.9  -86.3   0.2907   5.2 ------	UNKNOWN
Post-slew image of 15-350 keV band
Time interval of the image:
91.948590 183.111400

# RAcent  DECcent POSerr Theta    Phi  PeakCts   SNR AngSep     Name
#  [deg]    [deg]    ['] [deg]  [deg]                   [']
254.4526  35.4093    3.6  40.0   -8.9  -0.6173  -3.2    4.0	Her X-1
151.5640  24.8951    2.9  45.7  162.9   1.4388   4.0 ------	UNKNOWN
162.2029  48.7793    2.4  26.7 -167.8   0.6492   4.8 ------	UNKNOWN
128.0964  61.7596    2.0  43.0 -138.4   1.5248   5.7 ------	UNKNOWN
275.7708  58.8901    2.4  43.3  -50.3   1.6498   4.9 ------	UNKNOWN