Analysis Summary
Notes:
- 1) No attempt has been made to eliminate the non-significant decimal places.
- 2) This batgrbproduct analysis is done using the HEASARC data.
- 3) This batgrbproduct analysis is using the flight position for the mask-weighting calculation.
======================================================================
BAT GRB EVENT DATA PROCESSING REPORT
Process Script Ver: batgrbproduct v2.48
Process Start Time: Sun Oct 23 23:27:30 EDT 2022
Host Name: batproc1
Current Working Dir: /local/data/bat1/alien/Swift_3rdBATcatalog/event/batevent_reproc/trigger1102281
======================================================================
Trigger: 01102281 Segment: 000
BAT Trigger Time: 671438239.168 [s; MET]
Trigger Stop: 671438247.36 [s; MET]
UTC: 2022-04-12T06:36:50.220220 [includes UTCF correction]
Where From?: TDRSS position message
BAT
RA: 123.968083384208 Dec: 30.3220864406175 [deg; J2000]
Catalogged Source?: NO
Point Source?: YES
GRB Indicated?: YES [ by BAT flight software ]
Image S/N Ratio: 7.2
Image Trigger?: NO
Rate S/N Ratio: 10.0498756211209 [ if not an image trigger ]
Image S/N Ratio: 7.2
Analysis Position: [ source = BAT ]
RA: 123.968083384208 Dec: 30.3220864406175 [deg; J2000]
Refined Position: [ source = BAT pre-slew burst ]
RA: 123.970479260828 Dec: 30.3388976897148 [deg; J2000]
{ 08h 15m 52.9s , +30d 20' 20.0" }
+/- 1.92918608985089 [arcmin] (estimated 90% radius based on SNR)
+/- 0.833783516843582 [arcmin] (formal 1-sigma fit error)
SNR: 11.8970986591548
Angular difference between the analysis and refined position is 1.016278 arcmin
Partial Coding Fraction: 0.9296875 [ including projection effects ]
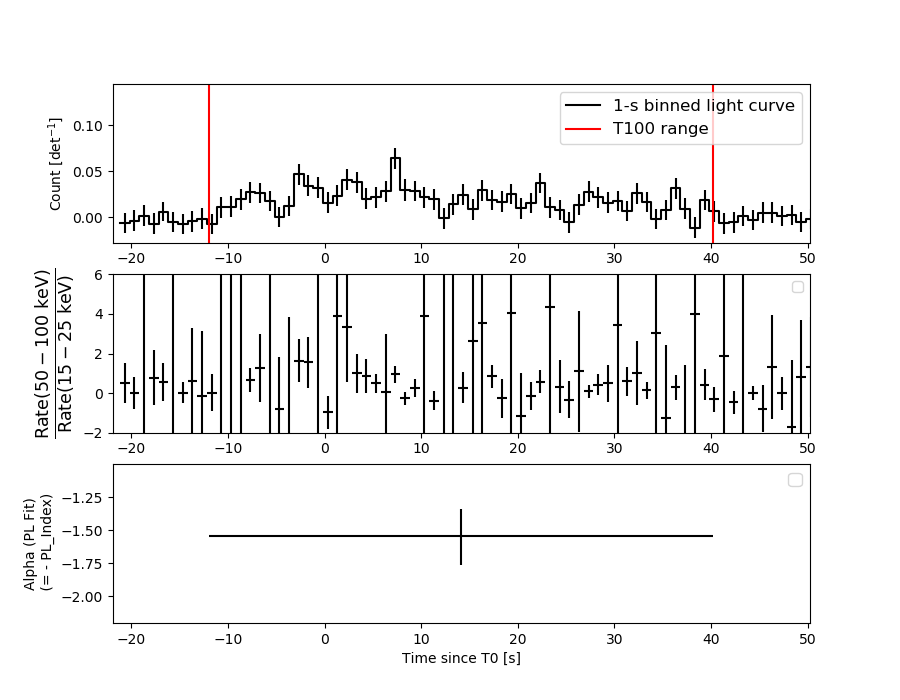
Duration
T90: 44.2599999904633 +/- 7.82742474991122
Measured from: -8.1360000371933
to: 36.12399995327 [s; relative to TRIGTIME]
T50: 21.4599999189377 +/- 6.70841859246074
Measured from: 0.644000053405762
to: 22.1039999723434 [s; relative to TRIGTIME]
Fluence
Peak Flux (peak 1 second)
Measured from: 6.87600004673004
to: 7.87600004673004 [s; relative to TRIGTIME]
Total Fluence
Measured from: -11.9399999380112
to: 40.2360000610352 [s; relative to TRIGTIME]
Band 1 Band 2 Band 3 Band 4
15-25 25-50 50-100 100-350 keV
Total 0.247515 0.469593 0.258136 0.058753
0.043700 0.044929 0.039043 0.033699 [error]
Peak 0.019332 0.025097 0.017726 0.006188
0.006270 0.006410 0.005527 0.004646 [error]
[ fluence units of on-axis counts / fully illuminated detector ]
======================================================================
====== Table of the duration information =============================
Value tstart tstop
T100 52.176 -11.940 40.236
T90 44.260 -8.136 36.124
T50 21.460 0.644 22.104
Peak 1.000 6.876 7.876
====== Spectral Analysis Summary =====================================
Model : spectral model: simple power-law (PL) and cutoff power-law (CPL)
Ph_index : photon index: E^{Ph_index}
Ph_90err : 90% error of the photon index
Epeak : Epeak in keV
Epeak_90err: 90% error of Epeak
Norm : normalization at 50 keV in both the PL model and CPL model
Nomr_90err : 90% error of the normalization
chi2 : Chi-Squared
dof : degree of freedo
=== Time-averaged spectral analysis ===
(Best model with acceptable fit: N/A)
Model Ph_index Ph_90err_low Ph_90err_hi Epeak Epeak_90err_low Epeak_90err_hi Norm Nomr_90err_low Norm_90err_hi chi2 dof
PL -1.547 -0.213 0.208 - - - 1.25e-03 -1.66e-04 1.64e-04 57.250 57
CPL -0.465 -0.916 1.187 65.531 -14.883 98.062 4.74e-03 -4.74e-03 1.58e-02 53.030 56
=== 1-s peak spectral analysis ===
(Best model with acceptable fit: N/A)
Model Ph_index Ph_90err_low Ph_90err_hi Epeak Epeak_90err_low Epeak_90err_hi Norm Nomr_90err_low Norm_90err_hi chi2 dof
PL -1.499 -0.507 0.495 - - - 4.26e-03 -1.22e-03 1.18e-03 56.170 57
CPL -1.490 -0.693 0.492 9999.260 -9999.260 -9999.260 4.28e-03 -1.23e-03 3.58e-02 56.170 56
=== Fluence/Peak Flux Summary ===
Model Band1 Band2 Band3 Band4 Band5 Total
15-25 25-50 50-100 100-350 15-150 15-350 keV
Fluence PL 8.68e-08 1.55e-07 2.12e-07 6.01e-07 6.12e-07 1.05e-06 erg/cm2
90%_error_low -1.65e-08 -1.96e-08 -3.68e-08 -1.90e-07 -8.84e-08 -2.28e-07 erg/cm2
90%_error_hi 1.72e-08 1.95e-08 3.69e-08 2.41e-07 8.99e-08 2.70e-07 erg/cm2
Peak flux PL 1.75e-01 1.76e-01 1.25e-01 1.41e-01 5.32e-01 6.17e-01 ph/cm2/s
90%_error_low -7.54e-02 -5.02e-02 -4.56e-02 -8.19e-02 -1.43e-01 -1.69e-01 ph/cm2/s
90%_error_hi 8.36e-02 4.90e-02 4.45e-02 1.33e-01 1.43e-01 1.73e-01 ph/cm2/s
Fluence CPL 7.55e-08 1.75e-07 2.16e-07 1.40e-07 5.56e-07 6.07e-07 erg/cm2
90%_error_low -1.93e-08 -2.61e-08 -4.43e-08 -9.78e-08 -9.60e-08 -1.37e-07 erg/cm2
90%_error_hi 1.97e-08 2.76e-08 4.26e-08 3.17e-07 1.01e-07 3.21e-07 erg/cm2
Peak flux CPL 1.79e-01 1.76e-01 1.24e-01 1.50e-01 5.34e-01 6.19e-01 ph/cm2/s
90%_error_low -8.78e-02 -5.01e-02 -4.37e-02 N/A -1.50e-01 -2.77e-01 ph/cm2/s
90%_error_hi 7.80e-02 5.80e-02 4.81e-02 N/A 1.44e-01 1.70e-01 ph/cm2/s
======================================================================
Image
Pre-slew 15.0-350.0 keV image (Event data)
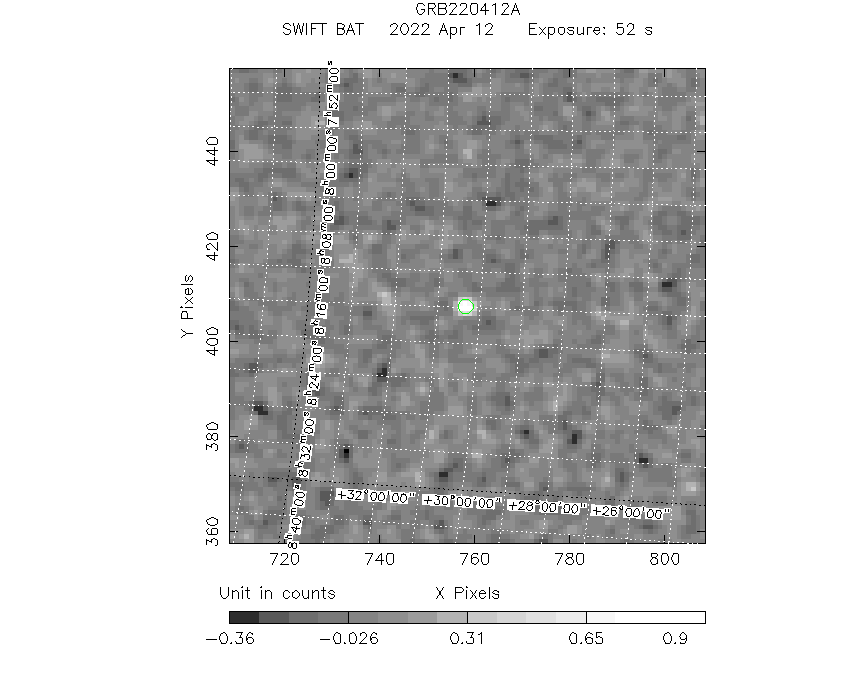
#   RAcent    DECcent   POSerr    Theta     Phi              Peak Cts       SNR   Name
  123.9705    30.3389   0.0162    16.3717    29.6809         1.0779759     11.897 TRIG_01102281

Foreground time interval of the image:
-11.940  40.236 (delta_t =  52.176 [sec])
Background time interval of the image:
-239.168 -11.940 (delta_t = 227.228 [sec])
Light Curves
Note: The mask-weighted lightcurves have units of either count/det or counts/sec/det, where a det is 0.4 x 0.4 = 0.16 sq cm.
Full-time range; 1 s binning
Other quick-look light curves:
- 64 ms binning (zoomed)
- 16 ms binning (zoomed)
- 8 ms binning (zoomed)
- 2 ms binning (zoomed)
- SN=5 or 10 s binning (full-time range)
- Raw light curve
Spectra
- 64 ms binning (zoomed)
- 16 ms binning (zoomed)
- 8 ms binning (zoomed)
- 2 ms binning (zoomed)
- SN=5 or 10 s binning (full-time range)
- Raw light curve
Spectra
Notes:
- 1) The fitting includes the systematic errors.
- 2) When the burst includes telescope slew time periods, the fitting uses an average response file made from multiple 5-s response files through out the slew time plus single time preiod for the non-slew times, and weighted by the total counts in the corresponding time period using addrmf. An average response file is needed becuase a spectral fit using the pre-slew DRM will introduce some errors in both a spectral shape and a normalization if the PHA file contains a lot of the slew/post-slew time interval.
- 3) For fits to more complicated models (e.g. a power-law over a cutoff power-law), the BAT team has decided to require a chi-square improvement of more than 6 for each extra dof.
Time averaged spectrum fit using the average DRM
Power-law model
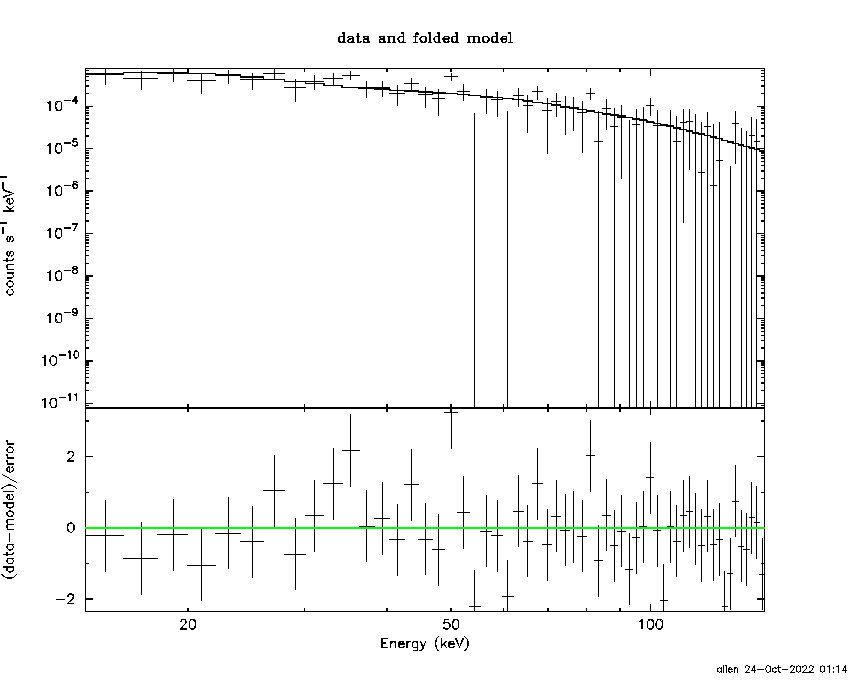
Time interval is from  -11.940 sec. to   40.236 sec.

Spectral model in power-law:
------------------------------------------------------------
Parameters  : value       lower 90%   higher 90%
Photon index: -1.54743     ( -0.212775   0.208003 )
Norm@50keV  : 1.24582E-03    ( -0.000166159   0.000164327 )
------------------------------------------------------------
#Fit statistic  : Chi-Squared                   57.25     using 59 bins.
 Reduced chi-squared = 1.00439
# Null hypothesis probability of 4.66e-01 with 57 degrees of freedom

Photon flux (15-150 keV)    in 52.18 sec: 0.157601 ( -0.019695  0.019706 ) ph/cm2/s
Energy fluence (15-150 keV)             : 6.12285e-07 ( -8.83543e-08  8.99197e-08 ) ergs/cm2
Cutoff power-law model
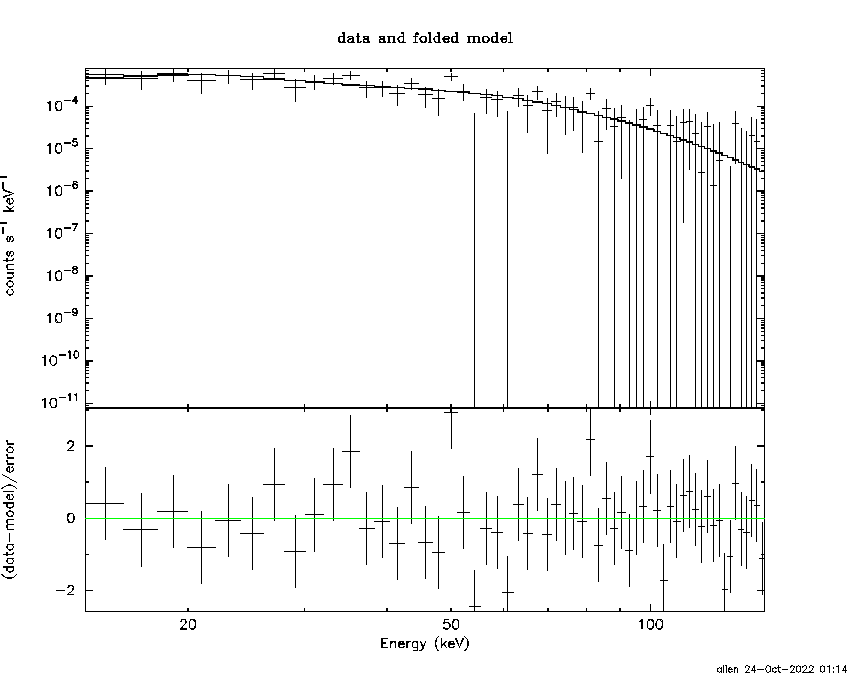
Time interval is from  -11.940 sec. to   40.236 sec.
Spectral model in the cutoff power-law:
------------------------------------------------------------
Parameters  : value       lower 90%   higher 90%
Photon index: -0.465204     ( -0.91575   1.18658 )
Epeak [keV] : 65.5312      ( -14.8832 98.0619 )
Norm@50keV  : 4.73945E-03    ( -0.00473945   0.0158465 )
------------------------------------------------------------
#Fit statistic  : Chi-Squared                   53.03     using 59 bins.
 Reduced chi-squared = 0.946964
# Null hypothesis probability of 5.88e-01 with 56 degrees of freedom

Photon flux (15-150 keV)    in 52.18 sec: 0.151243 ( -0.020414  0.020419 ) ph/cm2/s
Energy fluence (15-150 keV)             : 5.56014e-07 ( -9.59762e-08  1.00727e-07 ) ergs/cm2
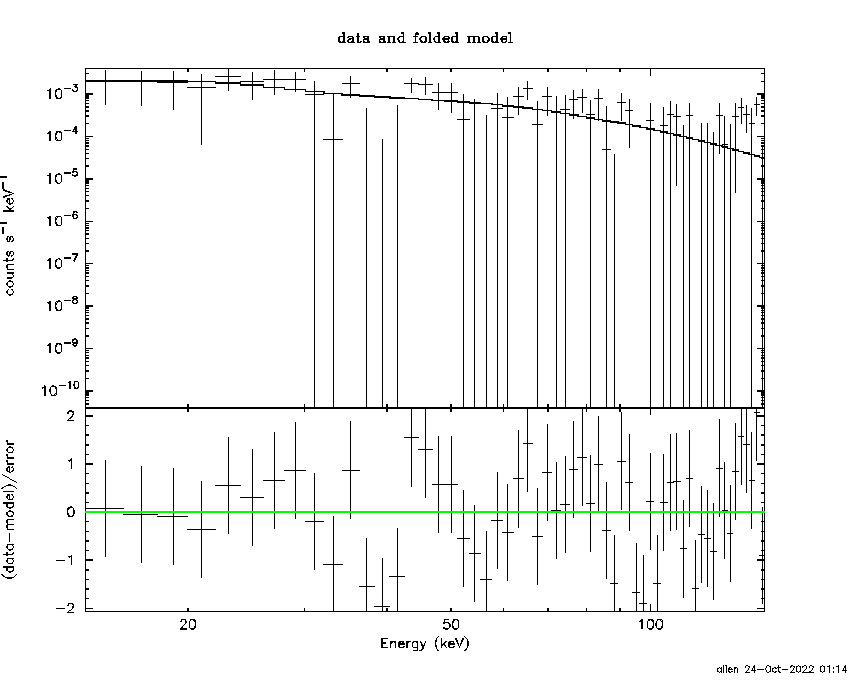
1-s peak spectrum fit
Power-law model

Time interval is from    6.876 sec. to    7.876 sec.

Spectral model in power-law:
------------------------------------------------------------
Parameters  : value       lower 90%   higher 90%
Photon index: -1.49858     ( -0.507033   0.494537 )
Norm@50keV  : 4.26320E-03    ( -0.00122339   0.00118176 )
------------------------------------------------------------
#Fit statistic  : Chi-Squared                   56.17     using 59 bins.
 Reduced chi-squared = 0.985439
# Null hypothesis probability of 5.06e-01 with 57 degrees of freedom

Photon flux (15-150 keV)    in 1 sec: 0.532023 ( -0.142778  0.142994 ) ph/cm2/s
Energy fluence (15-150 keV)             : 4.04585e-08 ( -1.24629e-08  1.28676e-08 ) ergs/cm2
Cutoff power-law model
Time interval is from    6.876 sec. to    7.876 sec.
Spectral model in the cutoff power-law:
------------------------------------------------------------
Parameters  : value       lower 90%   higher 90%
Photon index: -1.49028     ( -0.689802   0.4951 )
Epeak [keV] : 9999.26      ( -9999.36 -9999.36 )
Norm@50keV  : 4.27874E-03    ( -0.00122949   0.0357934 )
------------------------------------------------------------
#Fit statistic  : Chi-Squared                   56.17     using 59 bins.
 Reduced chi-squared = 1.00304
# Null hypothesis probability of 4.69e-01 with 56 degrees of freedom

Photon flux (15-150 keV)    in 1 sec: 0.534059 ( -0.149554  0.143795 ) ph/cm2/s
Energy fluence (15-150 keV)             : 4.06799e-08 ( -1.36061e-08  9.19132e-09 ) ergs/cm2
Time-resolved spectra
Distribution
T90 vs. Hardness ratio plot
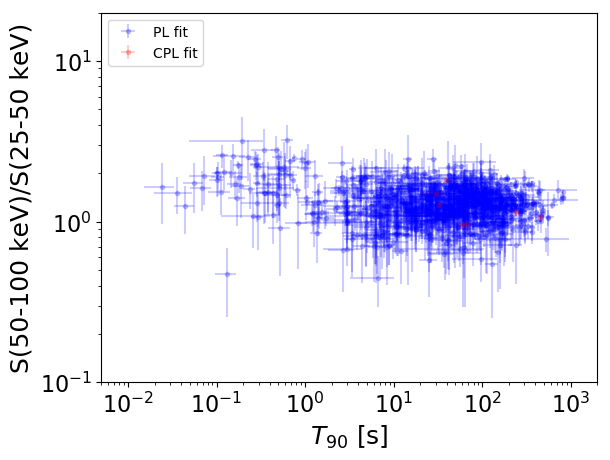
T90                                   = N/A sec.
Hardness ratio (energy fluence ratio) = N/A
S(15-50 keV) vs. S(50-150 keV) plot
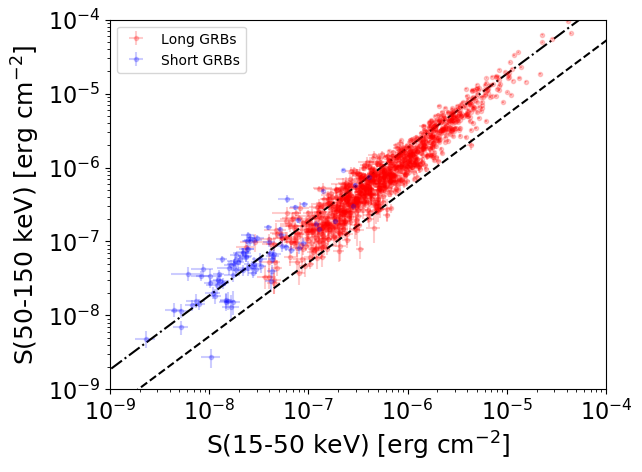
S(15-50 keV)  = N/A
S(50-150 keV) = N/A
The dash-dotted line and the dashed line traces the fluences calculated from the Band function with Epeak = 15 and 150 keV, respectively. Both lines assume a canonical values of alpha = -1 and beta = -2.5.
Mask shadow pattern
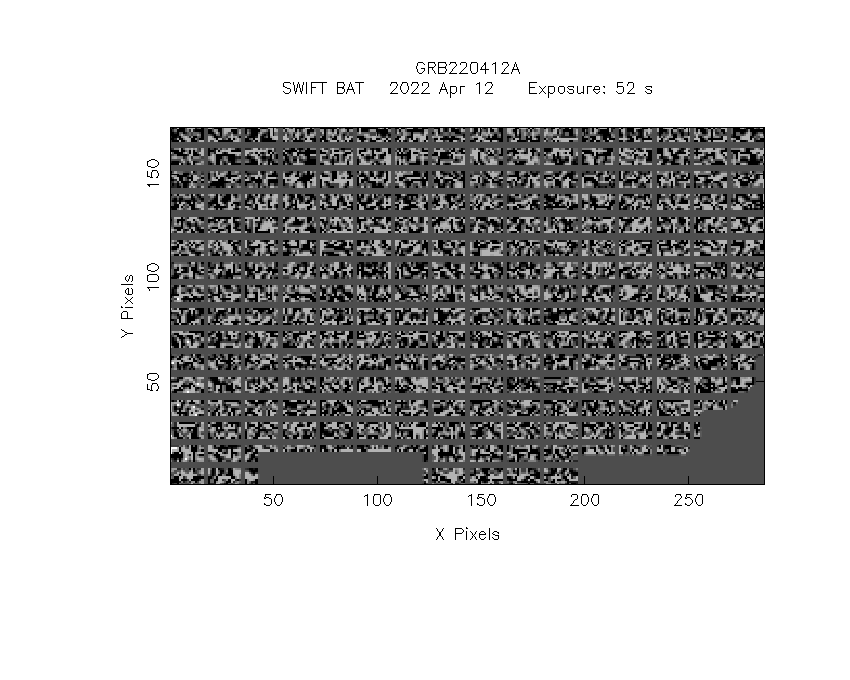
IMX = 2.552340665624958E-01, IMY = -1.454701450132551E-01
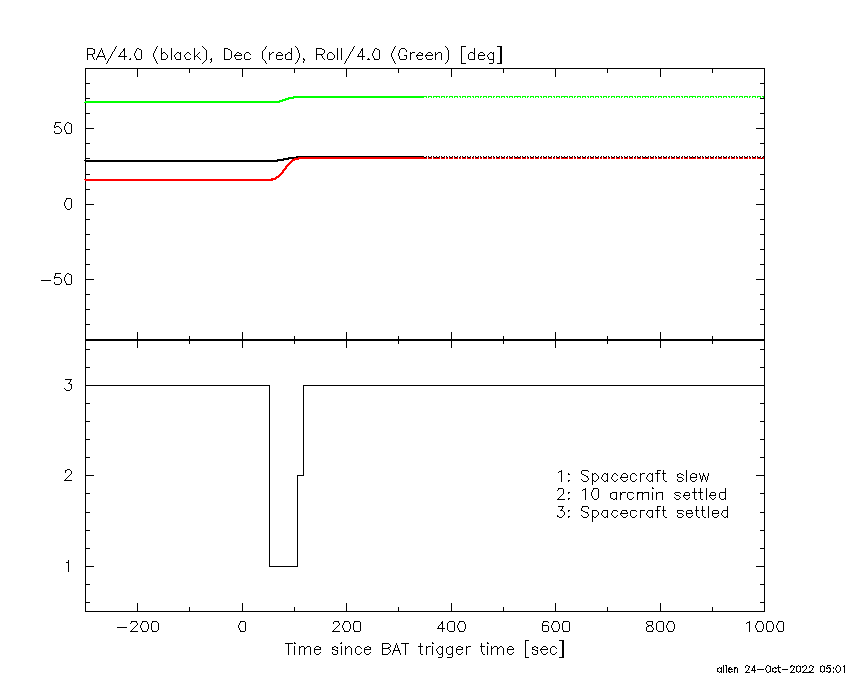
Spacecraft aspect plot
Bright source in the pre-burst/pre-slew/post-slew images
Pre-burst image of 15-350 keV band
Time interval of the image:
-239.168000 -11.940000

# RAcent  DECcent POSerr Theta    Phi  PeakCts   SNR AngSep     Name
#  [deg]    [deg]    ['] [deg]  [deg]                   [']
 83.6424  22.0241    0.6  29.9  -73.6   9.1538  20.5    0.8	Crab
Pre-slew background subtracted image of 15-350 keV band
Time interval of the image:
-11.940000 40.236000

# RAcent  DECcent POSerr Theta    Phi  PeakCts   SNR AngSep     Name
#  [deg]    [deg]    ['] [deg]  [deg]                   [']
 83.4549  22.1105    0.0  30.1  -73.4   0.4176   2.8   11.5	Crab
123.9704  30.3389    1.0  16.4   29.7   1.0780  11.9 ------	UNKNOWN
 96.0116  31.3919    2.3  22.8  -44.7   0.4782   5.0 ------	UNKNOWN
Post-slew image of 15-350 keV band
Time interval of the image:
105.332600 653.893200
654.832000 659.167400
660.832000 838.671800
840.832000 963.017500

# RAcent  DECcent POSerr Theta    Phi  PeakCts   SNR AngSep     Name
#  [deg]    [deg]    ['] [deg]  [deg]                   [']
 83.6367  22.0053    1.1  36.9 -107.3  27.0476  10.9    0.6	Crab
196.4775  68.2167    7.3  55.6   11.3   5.2505   1.6 ------	UNKNOWN
117.7374  49.5448    2.8  19.8  -26.1   3.8940   4.1 ------	UNKNOWN