Analysis Summary
Notes:
- 1) No attempt has been made to eliminate the non-significant decimal places.
- 2) This batgrbproduct analysis is done using the HEASARC data.
- 3) This batgrbproduct analysis is using the flight position for the mask-weighting calculation.
======================================================================
BAT GRB EVENT DATA PROCESSING REPORT
Process Script Ver: batgrbproduct v2.48
Process Start Time: Fri Nov 18 22:13:15 EST 2022
Host Name: batproc1
Current Working Dir: /local/data/bat1/alien/Swift_3rdBATcatalog/event/batevent_reproc/trigger1102329
======================================================================
Trigger: 01102329 Segment: 000
BAT Trigger Time: 671476037.984 [s; MET]
Trigger Stop: 671476038.016 [s; MET]
UTC: 2022-04-12T17:06:49.033660 [includes UTCF correction]
Where From?: (*SHORT BURST*) TDRSS scaled map message
BAT
RA: 320.794376319468 Dec: -0.223218895688613 [deg; J2000]
Catalogged Source?: NO
Point Source?: YES
GRB Indicated?: YES [ by BAT flight software ]
Image S/N Ratio: 8.88
Image Trigger?: NO
Rate S/N Ratio: 46.5617869072913 [ if not an image trigger ]
Image S/N Ratio: 8.88
Analysis Position: [ source = BAT ]
RA: 320.794376319468 Dec: -0.223218895688613 [deg; J2000]
Refined Position: [ source = BAT pre-slew burst ]
RA: 320.758964270219 Dec: -0.260304900869708 [deg; J2000]
{ 21h 23m 02.2s , -00d 15' 37.1" }
+/- 1.65861329852165 [arcmin] (estimated 90% radius based on SNR)
+/- 0.750173057831972 [arcmin] (formal 1-sigma fit error)
SNR: 14.7637521881701
Angular difference between the analysis and refined position is 3.076639 arcmin
Partial Coding Fraction: 0.75 [ including projection effects ]
Duration
T90: 0.139999985694885 +/- 0.0399999856949492
Measured from: -0.0119999647140503
to: 0.128000020980835 [s; relative to TRIGTIME]
T50: 0.059999942779541 +/- 0.020396072630595
Measured from: 0.00800001621246338
to: 0.0679999589920044 [s; relative to TRIGTIME]
Fluence
Peak Flux (peak 1 second)
Measured from: -0.435999989509583
to: 0.564000010490417 [s; relative to TRIGTIME]
Total Fluence
Measured from: -0.031999945640564
to: 0.156000018119812 [s; relative to TRIGTIME]
Band 1 Band 2 Band 3 Band 4
15-25 25-50 50-100 100-350 keV
Total 0.028424 0.048107 0.038423 0.019017
0.004131 0.005128 0.005143 0.004143 [error]
Peak 0.028742 0.044313 0.033918 0.023157
0.007642 0.008382 0.007885 0.006727 [error]
[ fluence units of on-axis counts / fully illuminated detector ]
======================================================================
====== Table of the duration information =============================
Value tstart tstop
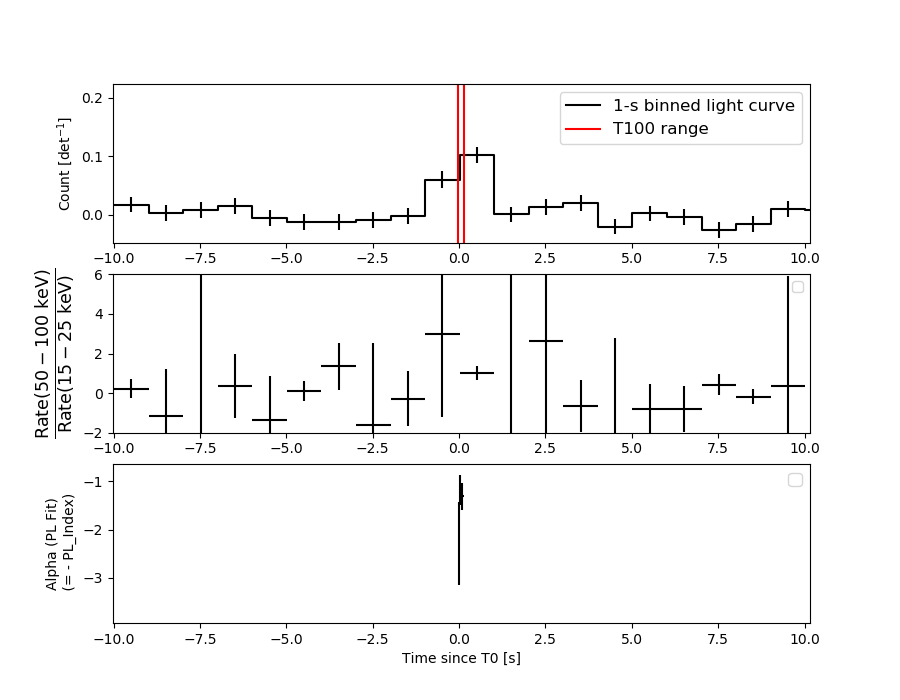
T100 0.188 -0.032 0.156
T90 0.140 -0.012 0.128
T50 0.060 0.008 0.068
Peak 1.000 -0.436 0.564
====== Spectral Analysis Summary =====================================
Model : spectral model: simple power-law (PL) and cutoff power-law (CPL)
Ph_index : photon index: E^{Ph_index}
Ph_90err : 90% error of the photon index
Epeak : Epeak in keV
Epeak_90err: 90% error of Epeak
Norm : normalization at 50 keV in both the PL model and CPL model
Nomr_90err : 90% error of the normalization
chi2 : Chi-Squared
dof : degree of freedo
=== Time-averaged spectral analysis ===
(Best model with acceptable fit: N/A)
Model Ph_index Ph_90err_low Ph_90err_hi Epeak Epeak_90err_low Epeak_90err_hi Norm Nomr_90err_low Norm_90err_hi chi2 dof
PL -1.187 -0.203 0.203 - - - 4.66e-02 -5.41e-03 5.40e-03 59.170 57
CPL -1.140 -0.250 0.608 963.401 -963.401 -963.401 4.91e-02 -7.77e-03 3.06e-03 59.260 56
=== 1-s peak spectral analysis ===
(Best model with acceptable fit: N/A)
Model Ph_index Ph_90err_low Ph_90err_hi Epeak Epeak_90err_low Epeak_90err_hi Norm Nomr_90err_low Norm_90err_hi chi2 dof
PL -0.976 -0.398 0.440 - - - 8.77e-03 -1.71e-03 1.66e-03 58.920 57
CPL -1.022 -1.802 -0.634 9999.360 N/A N/A 8.86e-03 N/A N/A 59.010 56
=== Fluence/Peak Flux Summary ===
Model Band1 Band2 Band3 Band4 Band5 Total
15-25 25-50 50-100 100-350 15-150 15-350 keV
Fluence PL 8.35e-09 1.86e-08 3.27e-08 1.34e-07 8.92e-08 1.94e-07 erg/cm2
90%_error_low -1.68e-09 -2.32e-09 -4.85e-09 -3.90e-08 -1.21e-08 -4.31e-08 erg/cm2
90%_error_hi 1.76e-09 2.29e-09 4.78e-09 4.87e-08 1.23e-08 5.15e-08 erg/cm2
Peak flux PL 2.19e-01 3.01e-01 3.06e-01 5.67e-01 1.01e+00 1.39e+00 ph/cm2/s
90%_error_low -9.48e-02 -8.33e-02 -6.57e-02 -2.47e-01 -1.97e-01 -2.89e-01 ph/cm2/s
90%_error_hi 1.09e-01 7.63e-02 6.27e-02 3.71e-01 1.98e-01 3.26e-01 ph/cm2/s
Fluence CPL 8.40e-09 1.84e-08 3.24e-08 1.51e-07 8.99e-08 1.94e-07 erg/cm2
90%_error_low N/A -2.55e-09 -4.51e-09 -1.02e-07 -1.74e-08 -8.52e-08 erg/cm2
90%_error_hi N/A 3.32e-09 5.27e-09 -1.01e-08 1.21e-08 2.34e-08 erg/cm2
Peak flux CPL 2.20e-01 3.02e-01 3.06e-01 5.81e-01 1.02e+00 1.37e+00 ph/cm2/s
90%_error_low -9.55e-02 -8.39e-02 -6.55e-02 N/A -2.29e-01 -2.79e-01 ph/cm2/s
90%_error_hi 1.09e-01 7.57e-02 6.34e-02 N/A 2.02e-01 2.71e-01 ph/cm2/s
======================================================================
Image
Pre-slew 15.0-350.0 keV image (Event data)
#   RAcent    DECcent   POSerr    Theta     Phi              Peak Cts       SNR   Name
  320.7590    -0.2603   0.0131    23.1186    36.8197         0.1394980     14.764 TRIG_01102329

Foreground time interval of the image:
 -0.032   0.156 (delta_t =   0.188 [sec])
Background time interval of the image:
-239.984  -0.032 (delta_t = 239.952 [sec])
Light Curves
Note: The mask-weighted lightcurves have units of either count/det or counts/sec/det, where a det is 0.4 x 0.4 = 0.16 sq cm.
Full-time range; 1 s binning
Other quick-look light curves:
- 64 ms binning (zoomed)
- 16 ms binning (zoomed)
- 8 ms binning (zoomed)
- 2 ms binning (zoomed)
- SN=5 or 10 s binning (full-time range)
- Raw light curve
Spectra
- 64 ms binning (zoomed)
- 16 ms binning (zoomed)
- 8 ms binning (zoomed)
- 2 ms binning (zoomed)
- SN=5 or 10 s binning (full-time range)
- Raw light curve
Spectra
Notes:
- 1) The fitting includes the systematic errors.
- 2) When the burst includes telescope slew time periods, the fitting uses an average response file made from multiple 5-s response files through out the slew time plus single time preiod for the non-slew times, and weighted by the total counts in the corresponding time period using addrmf. An average response file is needed becuase a spectral fit using the pre-slew DRM will introduce some errors in both a spectral shape and a normalization if the PHA file contains a lot of the slew/post-slew time interval.
- 3) For fits to more complicated models (e.g. a power-law over a cutoff power-law), the BAT team has decided to require a chi-square improvement of more than 6 for each extra dof.
Time averaged spectrum fit using the average DRM
Power-law model

Time interval is from   -0.032 sec. to    0.156 sec.

Spectral model in power-law:
------------------------------------------------------------
Parameters  : value       lower 90%   higher 90%
Photon index: -1.18675     ( -0.203339   0.203151 )
Norm@50keV  : 4.65864E-02    ( -0.00541008   0.00539567 )
------------------------------------------------------------
#Fit statistic  : Chi-Squared                   59.17     using 59 bins.
 Reduced chi-squared = 1.03807
# Null hypothesis probability of 3.96e-01 with 57 degrees of freedom

Photon flux (15-150 keV)    in 0.188 sec: 5.45833 ( -0.62937  0.62956 ) ph/cm2/s
Energy fluence (15-150 keV)             : 8.92026e-08 ( -1.21144e-08  1.22557e-08 ) ergs/cm2
Cutoff power-law model
Time interval is from   -0.032 sec. to    0.156 sec.
Spectral model in the cutoff power-law:
------------------------------------------------------------
Parameters  : value       lower 90%   higher 90%
Photon index: -1.18263     ( -0.249481   0.608655 )
Epeak [keV] : 1.00000E+04      ( -10000 -10000 )
Norm@50keV  : 4.68133E-02    ( -0.00544659   0.00537414 )
------------------------------------------------------------
#Fit statistic  : Chi-Squared                   59.17     using 59 bins.
 Reduced chi-squared = 1.05661
# Null hypothesis probability of 3.61e-01 with 56 degrees of freedom

Photon flux (15-150 keV)    in 0.188 sec: 2.05723 ( -0.88134  0.62171 ) ph/cm2/s
Energy fluence (15-150 keV)             : 8.99204e-08 ( -1.7367e-08  1.2065e-08 ) ergs/cm2
1-s peak spectrum fit
Power-law model
Time interval is from   -0.436 sec. to    0.564 sec.

Spectral model in power-law:
------------------------------------------------------------
Parameters  : value       lower 90%   higher 90%
Photon index: -0.976207     ( -0.398064   0.439419 )
Norm@50keV  : 8.76991E-03    ( -0.00171407   0.00166332 )
------------------------------------------------------------
#Fit statistic  : Chi-Squared                   58.92     using 59 bins.
 Reduced chi-squared = 1.03368
# Null hypothesis probability of 4.05e-01 with 57 degrees of freedom

Photon flux (15-150 keV)    in 1 sec: 1.00848 ( -0.19745  0.19759 ) ph/cm2/s
Energy fluence (15-150 keV)             : 9.56643e-08 ( -2.01377e-08  2.02615e-08 ) ergs/cm2
Cutoff power-law model
Time interval is from   -0.436 sec. to    0.564 sec.
Spectral model in the cutoff power-law:
------------------------------------------------------------
Parameters  : value       lower 90%   higher 90%
Photon index: -2.29725     ( -0.526295   0.641121 )
Epeak [keV] : 99.7229      (   )
Norm@50keV  : 1.56079E-03    (     )
------------------------------------------------------------
#Fit statistic  : Chi-Squared                   56.17     using 59 bins.
 Reduced chi-squared = 1.00304
# Null hypothesis probability of 4.69e-01 with 56 degrees of freedom

Photon flux (15-150 keV)    in 1 sec: 1.02016 ( -0.229012  0.20229 ) ph/cm2/s
Energy fluence (15-150 keV)             : 9.54729e-08 ( -2.00297e-08  2.03462e-08 ) ergs/cm2
Time-resolved spectra
Distribution
T90 vs. Hardness ratio plot
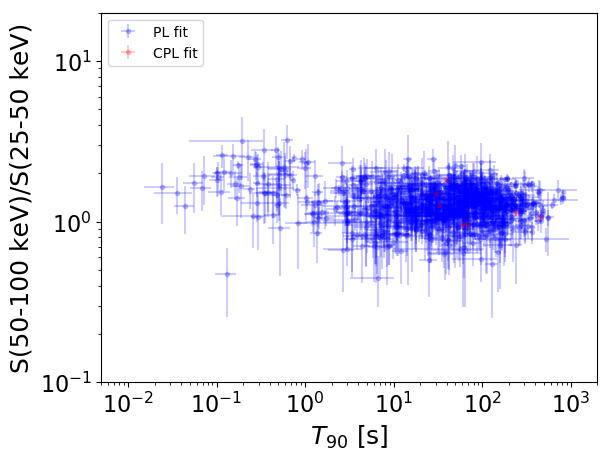
T90                                   = N/A sec.
Hardness ratio (energy fluence ratio) = N/A
S(15-50 keV) vs. S(50-150 keV) plot
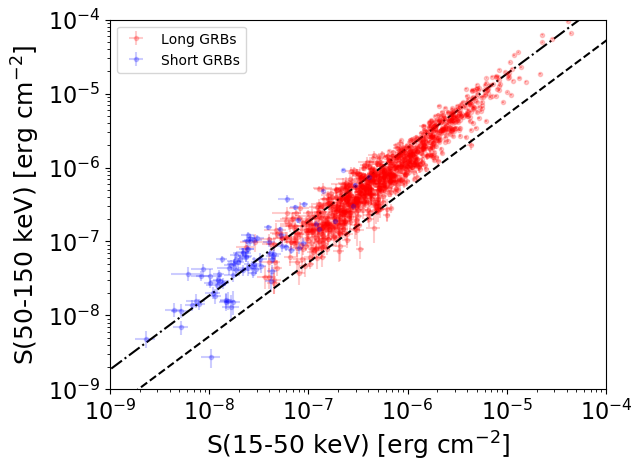
S(15-50 keV)  = N/A
S(50-150 keV) = N/A
The dash-dotted line and the dashed line traces the fluences calculated from the Band function with Epeak = 15 and 150 keV, respectively. Both lines assume a canonical values of alpha = -1 and beta = -2.5.
Mask shadow pattern
IMX = 3.417609168478940E-01, IMY = -2.558530639837800E-01
Spacecraft aspect plot
Bright source in the pre-burst/pre-slew/post-slew images
Pre-burst image of 15-350 keV band
Time interval of the image:
-239.984000 -0.032000

# RAcent  DECcent POSerr Theta    Phi  PeakCts   SNR AngSep     Name
#  [deg]    [deg]    ['] [deg]  [deg]                   [']
299.5744  35.1758    0.7  33.2  129.6   9.7400  16.1    1.7	Cyg X-1
308.0342  40.9487    3.8  30.0  145.3   1.3673   3.1    3.5	Cyg X-3
326.0180  38.2331    6.0  19.6  168.4   0.6226   1.9    9.0	Cyg X-2
 19.0880  57.4948    2.8  50.7 -145.3   3.5333   4.1 ------	UNKNOWN
 10.1375   1.6883    3.3  40.6  -63.9   3.0966   3.6 ------	UNKNOWN
Pre-slew background subtracted image of 15-350 keV band
Time interval of the image:
-0.032000 0.156000

# RAcent  DECcent POSerr Theta    Phi  PeakCts   SNR AngSep     Name
#  [deg]    [deg]    ['] [deg]  [deg]                   [']
299.4524  35.2097    5.0  33.3  129.6  -0.0327  -2.3    6.8	Cyg X-1
308.0700  40.7865    4.9  29.9  145.1  -0.0279  -2.3   10.1	Cyg X-3
326.1001  38.4495    6.1  19.7  168.8   0.0149   1.9    8.4	Cyg X-2
293.3220  28.7472    2.5  37.0  116.7   0.0862   4.6 ------	UNKNOWN
320.7590  -0.2603    0.8  23.1   36.8   0.1394  14.8 ------	UNKNOWN
319.8144  67.2746    2.7  48.4  177.9   0.0716   4.2 ------	UNKNOWN
Post-slew image of 15-350 keV band
Time interval of the image:
67.516660 302.276000

# RAcent  DECcent POSerr Theta    Phi  PeakCts   SNR AngSep     Name
#  [deg]    [deg]    ['] [deg]  [deg]                   [']
288.6711  10.8163    8.6  33.8  120.6   0.3599   1.3   10.8	GRS 1915+105
299.6085  35.2210    2.6  40.6  163.5   1.2262   4.4    1.5	Cyg X-1
308.1995  40.8787    5.9  42.7  176.4   0.4919   2.0    6.0	Cyg X-3
326.1764  38.2599    4.8  38.8 -162.8  -0.4411  -2.4    3.7	Cyg X-2
284.9220 -22.9139    2.8  41.6   64.9   2.1621   4.1 ------	UNKNOWN
282.7342  -4.6448    3.4  38.3   93.3   1.6566   3.4 ------	UNKNOWN
289.3734  -0.7333    3.1  31.4   99.4   0.8677   3.8 ------	UNKNOWN
311.9058 -49.9852    2.3  50.3   17.9   1.8207   5.1 ------	UNKNOWN
303.7415  -6.2773    2.3  18.1   80.6   0.8112   5.1 ------	UNKNOWN
325.6039 -57.0358    2.7  56.9    7.4   3.5895   4.3 ------	UNKNOWN
303.5186  44.3099    2.3  47.1  173.6   1.6037   5.0 ------	UNKNOWN
343.5360  54.7341    2.5  58.0 -154.3   3.3290   4.6 ------	UNKNOWN
  0.5196  12.4091    2.8  41.4  -98.8   2.1881   4.0 ------	UNKNOWN