Analysis Summary
Notes:
- 1) No attempt has been made to eliminate the non-significant decimal places.
- 2) This batgrbproduct analysis is done using the HEASARC data.
- 3) This batgrbproduct analysis is using the flight position for the mask-weighting calculation.
======================================================================
BAT GRB EVENT DATA PROCESSING REPORT
Process Script Ver: batgrbproduct v2.48
Process Start Time: Sun Oct 23 23:22:13 EDT 2022
Host Name: batproc1
Current Working Dir: /local/data/bat1/alien/Swift_3rdBATcatalog/event/batevent_reproc/trigger1104343
======================================================================
Trigger: 01104343 Segment: 000
BAT Trigger Time: 672786064 [s; MET]
Trigger Stop: 672786136 [s; MET]
UTC: 2022-04-27T21:00:34.960900 [includes UTCF correction]
Where From?: TDRSS position message
BAT
RA: 275.868924241971 Dec: -56.2528968519053 [deg; J2000]
Catalogged Source?: NO
Point Source?: YES
GRB Indicated?: YES [ by BAT flight software ]
Image S/N Ratio: 11.95
Image Trigger?: YES
Rate S/N Ratio: 0 [ if not an image trigger ]
Image S/N Ratio: 11.95
Analysis Position: [ source = BAT ]
RA: 275.868924241971 Dec: -56.2528968519053 [deg; J2000]
Refined Position: [ source = BAT pre-slew burst ]
RA: 275.920651239479 Dec: -56.2569768200509 [deg; J2000]
{ 18h 23m 41.0s , -56d 15' 25.1" }
+/- 2.02985056108217 [arcmin] (estimated 90% radius based on SNR)
+/- 0.756551948003623 [arcmin] (formal 1-sigma fit error)
SNR: 11.0632824417027
Angular difference between the analysis and refined position is 1.741349 arcmin
Partial Coding Fraction: 0.625 [ including projection effects ]
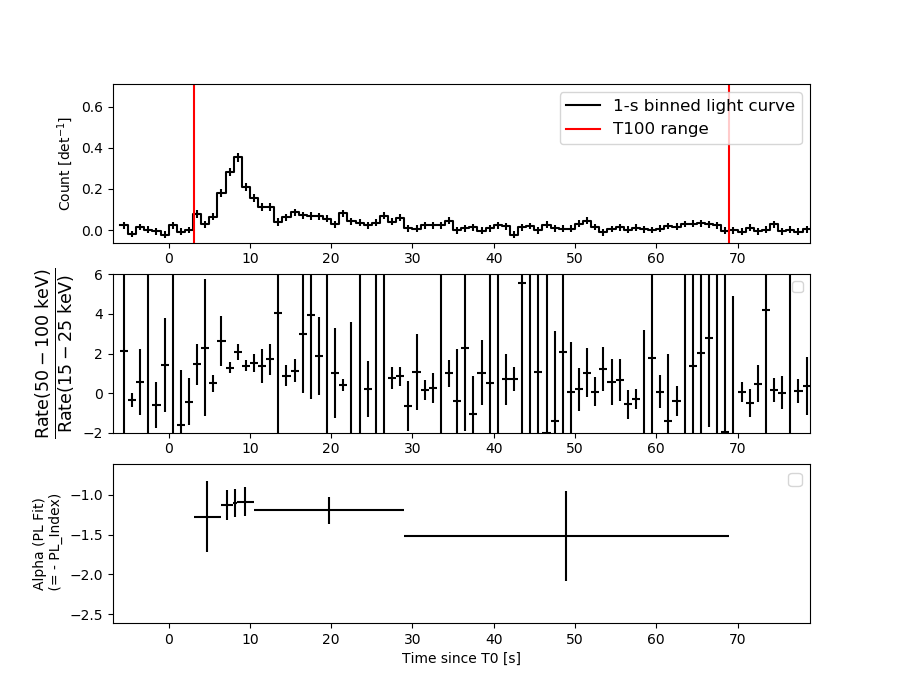
Duration
T90: 57.2159999608994 +/- 12.3112907433403
Measured from: 5.77199995517731
to: 62.9879999160767 [s; relative to TRIGTIME]
T50: 17.7039999961853 +/- 3.9565419715758
Measured from: 8.20799994468689
to: 25.9119999408722 [s; relative to TRIGTIME]
Fluence
Peak Flux (peak 1 second)
Measured from: 7.81599998474121
to: 8.81599998474121 [s; relative to TRIGTIME]
Total Fluence
Measured from: 3.09200000762939
to: 68.9199999570847 [s; relative to TRIGTIME]
Band 1 Band 2 Band 3 Band 4
15-25 25-50 50-100 100-350 keV
Total 0.624333 1.063668 0.962308 0.355258
0.078001 0.074151 0.064987 0.058180 [error]
Peak 0.074046 0.134366 0.118165 0.055787
0.010863 0.011338 0.010556 0.009520 [error]
[ fluence units of on-axis counts / fully illuminated detector ]
======================================================================
====== Table of the duration information =============================
Value tstart tstop
T100 65.828 3.092 68.920
T90 57.216 5.772 62.988
T50 17.704 8.208 25.912
Peak 1.000 7.816 8.816
====== Spectral Analysis Summary =====================================
Model : spectral model: simple power-law (PL) and cutoff power-law (CPL)
Ph_index : photon index: E^{Ph_index}
Ph_90err : 90% error of the photon index
Epeak : Epeak in keV
Epeak_90err: 90% error of Epeak
Norm : normalization at 50 keV in both the PL model and CPL model
Nomr_90err : 90% error of the normalization
chi2 : Chi-Squared
dof : degree of freedo
=== Time-averaged spectral analysis ===
(Best model with acceptable fit: N/A)
Model Ph_index Ph_90err_low Ph_90err_hi Epeak Epeak_90err_low Epeak_90err_hi Norm Nomr_90err_low Norm_90err_hi chi2 dof
PL -1.226 -0.130 0.132 - - - 3.13e-03 -2.26e-04 2.26e-04 58.250 57
CPL -1.143 -0.201 0.525 562.179 -562.179 -562.179 3.42e-03 -4.69e-04 2.39e-03 58.180 56
=== 1-s peak spectral analysis ===
(Best model with acceptable fit: N/A)
Model Ph_index Ph_90err_low Ph_90err_hi Epeak Epeak_90err_low Epeak_90err_hi Norm Nomr_90err_low Norm_90err_hi chi2 dof
PL -1.159 -0.161 0.164 - - - 2.53e-02 -2.29e-03 2.29e-03 62.960 57
CPL -1.157 -0.160 0.168 9999.330 -9999.330 -9999.330 2.54e-02 -2.27e-03 1.96e-02 62.960 56
=== Fluence/Peak Flux Summary ===
Model Band1 Band2 Band3 Band4 Band5 Total
15-25 25-50 50-100 100-350 15-150 15-350 keV
Fluence PL 2.04e-07 4.43e-07 7.58e-07 2.99e-06 2.08e-06 4.39e-06 erg/cm2
90%_error_low -2.97e-08 -3.91e-08 -6.21e-08 -5.30e-07 -1.58e-07 -5.65e-07 erg/cm2
90%_error_hi 3.12e-08 3.86e-08 6.17e-08 6.09e-07 1.58e-07 6.30e-07 erg/cm2
Peak flux PL 7.51e-01 9.27e-01 8.30e-01 1.29e+00 2.95e+00 3.79e+00 ph/cm2/s
90%_error_low -1.36e-01 -1.05e-01 -8.37e-02 -2.62e-01 -2.80e-01 -3.55e-01 ph/cm2/s
90%_error_hi 1.45e-01 1.04e-01 8.29e-02 3.04e-01 2.81e-01 3.60e-01 ph/cm2/s
Fluence CPL 2.00e-07 4.46e-07 7.64e-07 2.67e-06 2.07e-06 4.08e-06 erg/cm2
90%_error_low -3.72e-08 -3.50e-08 -6.69e-08 -1.28e-06 -1.68e-07 -1.27e-06 erg/cm2
90%_error_hi 2.99e-08 4.23e-08 7.27e-08 4.66e-07 1.60e-07 5.06e-07 erg/cm2
Peak flux CPL 7.51e-01 9.25e-01 8.28e-01 1.28e+00 2.96e+00 3.82e+00 ph/cm2/s
90%_error_low N/A -1.06e-01 -8.23e-02 N/A -2.93e-01 -6.86e-01 ph/cm2/s
90%_error_hi N/A 1.11e-01 9.53e-02 N/A 2.84e-01 3.07e-01 ph/cm2/s
======================================================================
Image
Pre-slew 15.0-350.0 keV image (Event data)
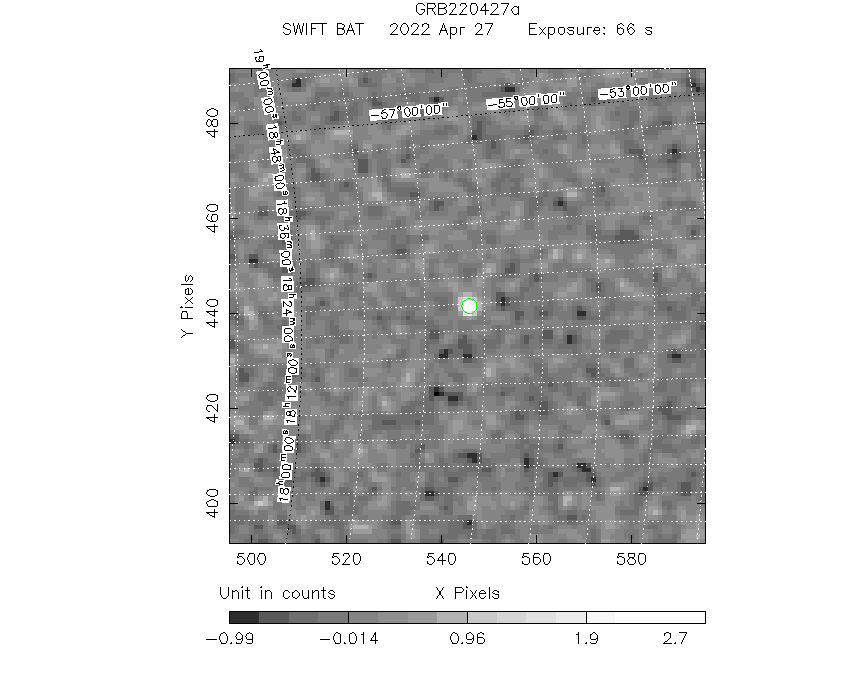
#   RAcent    DECcent   POSerr    Theta     Phi              Peak Cts       SNR   Name
  275.9207   -56.2570   0.0173    35.1877     6.0119         3.0882933     11.063 TRIG_01104343

Foreground time interval of the image:
  3.092  68.920 (delta_t =  65.828 [sec])
Background time interval of the image:
-19.099   3.092 (delta_t =  22.191 [sec])
Light Curves
Note: The mask-weighted lightcurves have units of either count/det or counts/sec/det, where a det is 0.4 x 0.4 = 0.16 sq cm.
Full-time range; 1 s binning
Other quick-look light curves:
- 64 ms binning (zoomed)
- 16 ms binning (zoomed)
- 8 ms binning (zoomed)
- 2 ms binning (zoomed)
- SN=5 or 10 s binning (full-time range)
- Raw light curve
Spectra
- 64 ms binning (zoomed)
- 16 ms binning (zoomed)
- 8 ms binning (zoomed)
- 2 ms binning (zoomed)
- SN=5 or 10 s binning (full-time range)
- Raw light curve
Spectra
Notes:
- 1) The fitting includes the systematic errors.
- 2) When the burst includes telescope slew time periods, the fitting uses an average response file made from multiple 5-s response files through out the slew time plus single time preiod for the non-slew times, and weighted by the total counts in the corresponding time period using addrmf. An average response file is needed becuase a spectral fit using the pre-slew DRM will introduce some errors in both a spectral shape and a normalization if the PHA file contains a lot of the slew/post-slew time interval.
- 3) For fits to more complicated models (e.g. a power-law over a cutoff power-law), the BAT team has decided to require a chi-square improvement of more than 6 for each extra dof.
Time averaged spectrum fit using the average DRM
Power-law model
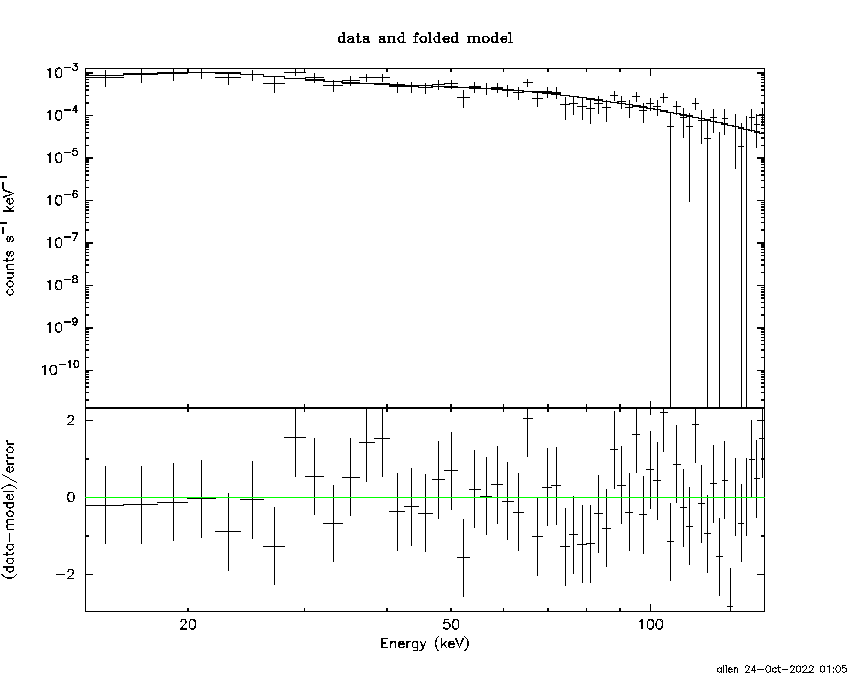
Time interval is from    3.092 sec. to   68.920 sec.

Spectral model in power-law:
------------------------------------------------------------
Parameters  : value       lower 90%   higher 90%
Photon index: -1.22574     ( -0.129973   0.132221 )
Norm@50keV  : 3.13265E-03    ( -0.000226373   0.000225789 )
------------------------------------------------------------
#Fit statistic  : Chi-Squared                   58.25     using 59 bins.
 Reduced chi-squared = 1.02193
# Null hypothesis probability of 4.29e-01 with 57 degrees of freedom

Photon flux (15-150 keV)    in 65.83 sec: 0.369099 ( -0.028478  0.028652 ) ph/cm2/s
Energy fluence (15-150 keV)             : 2.07756e-06 ( -1.57594e-07  1.58243e-07 ) ergs/cm2
Cutoff power-law model
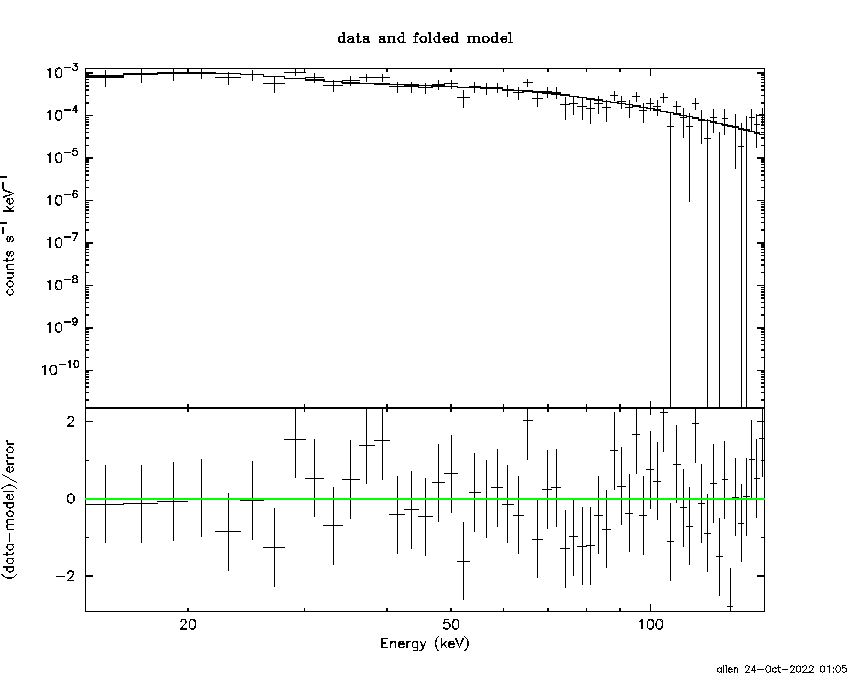
Time interval is from    3.092 sec. to   68.920 sec.
Spectral model in the cutoff power-law:
------------------------------------------------------------
Parameters  : value       lower 90%   higher 90%
Photon index: -1.14295     ( -0.20013   0.526285 )
Epeak [keV] : 562.179      ( -595.585 -595.585 )
Norm@50keV  : 3.41696E-03    ( -0.000460652   0.00239945 )
------------------------------------------------------------
#Fit statistic  : Chi-Squared                   58.18     using 59 bins.
 Reduced chi-squared = 1.03893
# Null hypothesis probability of 3.95e-01 with 56 degrees of freedom

Photon flux (15-150 keV)    in 65.83 sec: 0.367530 ( -0.02995  0.015078 ) ph/cm2/s
Energy fluence (15-150 keV)             : 2.0683e-06 ( -1.68255e-07  1.60001e-07 ) ergs/cm2
1-s peak spectrum fit
Power-law model
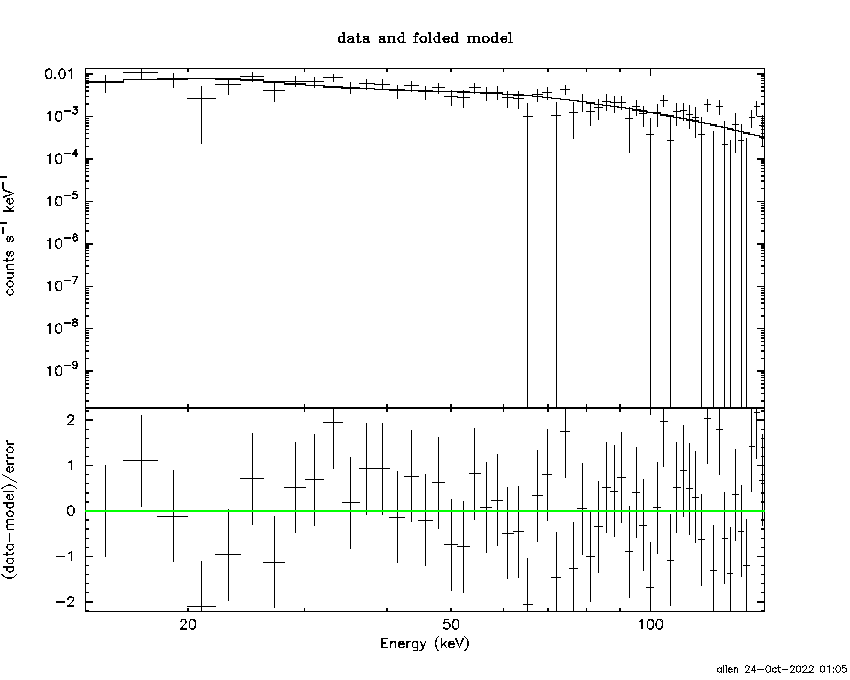
Time interval is from    7.816 sec. to    8.816 sec.

Spectral model in power-law:
------------------------------------------------------------
Parameters  : value       lower 90%   higher 90%
Photon index: -1.15944     ( -0.16114   0.164491 )
Norm@50keV  : 2.52842E-02    ( -0.00229358   0.0022872 )
------------------------------------------------------------
#Fit statistic  : Chi-Squared                   62.96     using 59 bins.
 Reduced chi-squared = 1.10456
# Null hypothesis probability of 2.74e-01 with 57 degrees of freedom

Photon flux (15-150 keV)    in 1 sec: 2.95203 ( -0.27975  0.2809 ) ph/cm2/s
Energy fluence (15-150 keV)             : 2.59579e-07 ( -2.52047e-08  2.53588e-08 ) ergs/cm2
Cutoff power-law model

Time interval is from    7.816 sec. to    8.816 sec.
Spectral model in the cutoff power-law:
------------------------------------------------------------
Parameters  : value       lower 90%   higher 90%
Photon index: -1.15725     ( -0.160127   0.167694 )
Epeak [keV] : 9999.33      ( -9999.36 -9999.36 )
Norm@50keV  : 2.53984E-02    ( -0.00228603   0.0195473 )
------------------------------------------------------------
#Fit statistic  : Chi-Squared                   62.96     using 59 bins.
 Reduced chi-squared = 1.12429
# Null hypothesis probability of 2.44e-01 with 56 degrees of freedom

Photon flux (15-150 keV)    in 1 sec: 2.95631 ( -0.29328  0.28404 ) ph/cm2/s
Energy fluence (15-150 keV)             : 1.82789e-07 ( 0  0 ) ergs/cm2
Time-resolved spectra
Distribution
T90 vs. Hardness ratio plot
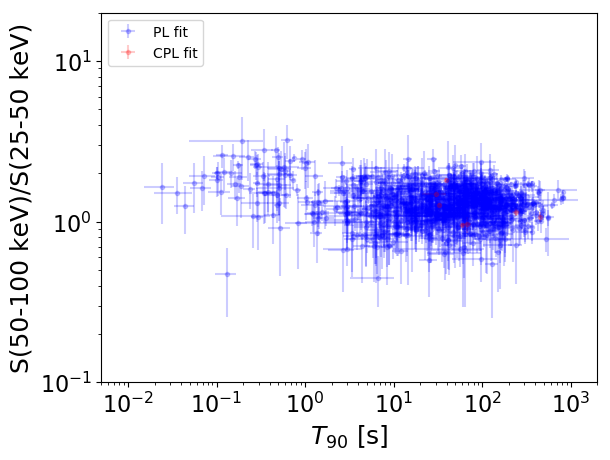
T90                                   = N/A sec.
Hardness ratio (energy fluence ratio) = N/A
S(15-50 keV) vs. S(50-150 keV) plot
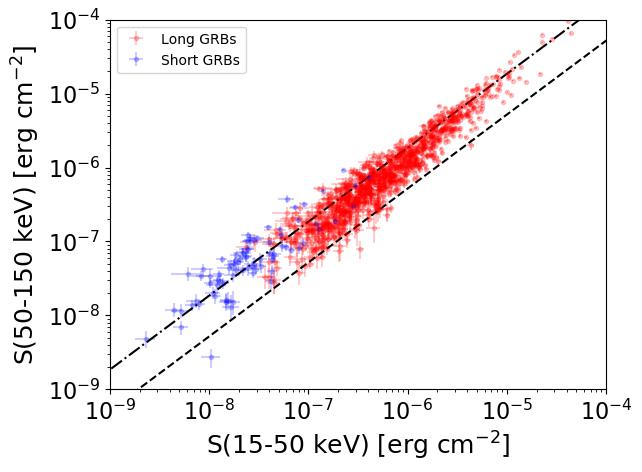
S(15-50 keV)  = N/A
S(50-150 keV) = N/A
The dash-dotted line and the dashed line traces the fluences calculated from the Band function with Epeak = 15 and 150 keV, respectively. Both lines assume a canonical values of alpha = -1 and beta = -2.5.
Mask shadow pattern
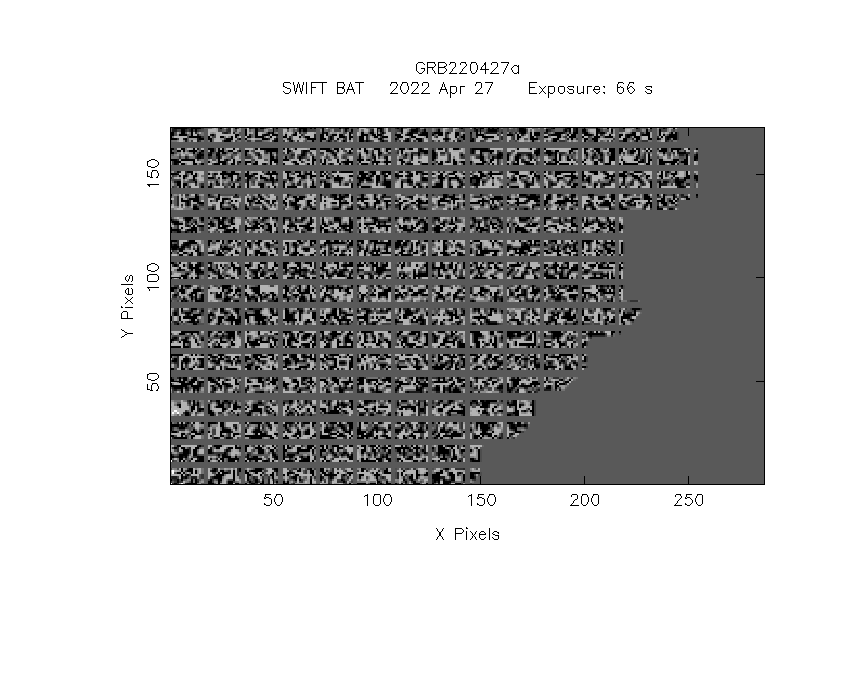
IMX = 7.012238590859576E-01, IMY = -7.384899981152744E-02
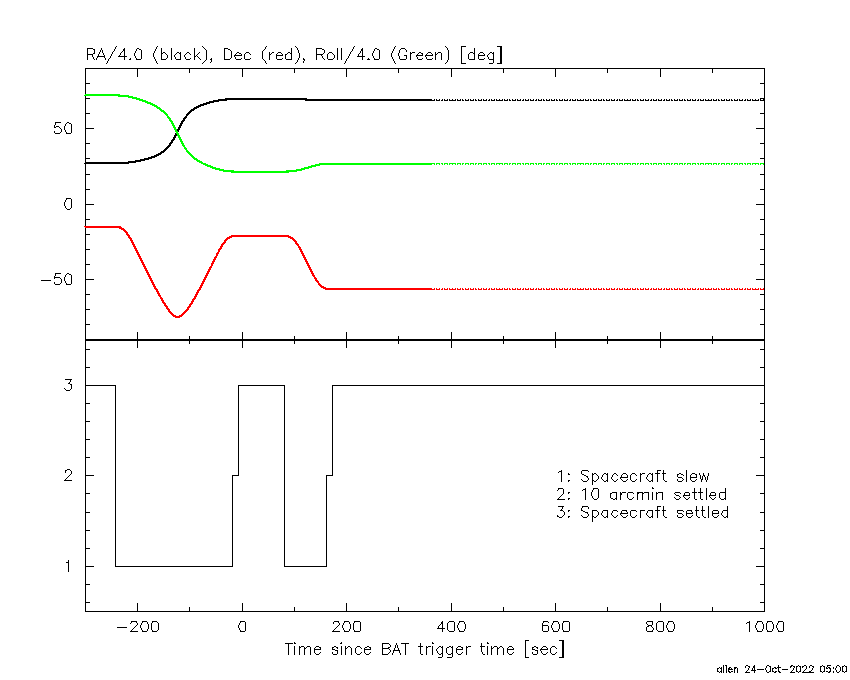
Spacecraft aspect plot
Bright source in the pre-burst/pre-slew/post-slew images
Pre-burst image of 15-350 keV band
Time interval of the image:
-19.099400 3.092000

# RAcent  DECcent POSerr Theta    Phi  PeakCts   SNR AngSep     Name
#  [deg]    [deg]    ['] [deg]  [deg]                   [']
244.9489 -15.6606    2.1  32.2   97.6   0.7495   5.5    2.1	Sco X-1
255.8031 -37.8545    2.6  25.7   48.0   0.3979   4.4    8.7	4U 1700-377
256.5670 -36.2971    6.2  24.4   50.3  -0.1585  -1.9    9.9	GX 349+2
262.8950 -24.8857    6.1  14.8   75.9   0.1392   1.9   10.5	GX 1+4
264.7478 -44.4472  218.4  25.9   26.3  -0.0044  -0.1    0.3	4U 1735-44
268.4909  -1.5543    7.5  21.8  155.9  -0.1100  -1.5    9.6	SW J1753.5-0127
270.1203 -25.2072    7.5   8.7   63.9   0.1031   1.5   11.8	GX 5-1
270.4705 -25.8915    0.0   8.7   58.9  -0.0209  -0.3   12.7	GRS 1758-258
273.8930 -13.9161    3.1   8.4  151.8   0.2198   3.7    9.8	GX 17+2
275.8492 -30.2333   26.1   9.4   17.4   0.0299   0.4    8.9	H1820-303
285.0389 -24.9116  716.9   7.2  -53.2  -0.0010  -0.0    0.6	HT1900.1-2455
288.8870  10.8005   83.0  33.5 -157.6   0.0120   0.1   10.2	GRS 1915+105
262.8067 -33.9671    0.0  18.9   47.3   0.0635   0.9   12.1	GX 354-0
236.1256 -68.9493    2.4  54.3   20.9   1.6813   4.8 ------	UNKNOWN
255.1361 -14.5412    2.6  23.1  106.3   0.4024   4.5 ------	UNKNOWN
264.6707 -74.3191    2.4  53.7    8.2   1.1564   4.9 ------	UNKNOWN
292.2342 -46.5408    2.6  27.8  -17.0   0.3082   4.3 ------	UNKNOWN
Pre-slew background subtracted image of 15-350 keV band
Time interval of the image:
3.092000 68.920000

# RAcent  DECcent POSerr Theta    Phi  PeakCts   SNR AngSep     Name
#  [deg]    [deg]    ['] [deg]  [deg]                   [']
245.0498 -15.5191   12.2  32.1   97.9  -0.3862  -0.9    8.3	Sco X-1
255.8055 -37.8322    3.7  25.7   48.1  -0.8226  -3.1    8.6	4U 1700-377
256.5631 -36.3194    6.4  24.4   50.3   0.4629   1.8    8.8	GX 349+2
262.8737 -24.8847    5.8  14.8   75.9  -0.4568  -2.0   11.1	GX 1+4
264.5485 -44.4794    4.5  26.0   26.6  -0.6280  -2.6    8.5	4U 1735-44
268.5090  -1.5778    4.6  21.8  155.9   0.5453   2.5   11.3	SW J1753.5-0127
270.1184 -25.0281    8.4   8.6   64.9  -0.2777  -1.4    9.5	GX 5-1
270.2692 -25.8917    8.3   8.9   59.5   0.2818   1.4    9.1	GRS 1758-258
273.8474 -13.8938   25.2   8.4  151.6  -0.0855  -0.5   12.6	GX 17+2
276.0906 -30.2558   13.6   9.4   16.1  -0.1660  -0.8   10.9	H1820-303
285.1904 -24.8219    7.1   7.2  -54.3   0.3090   1.6   10.3	HT1900.1-2455
288.6487  11.0591    6.1  33.7 -158.1   0.4495   1.9   11.1	GRS 1915+105
262.8081 -33.9361   18.3  18.8   47.4  -0.1369  -0.6   10.9	GX 354-0
275.9207 -56.2570    1.0  35.2    6.0   3.0867  11.1 ------	UNKNOWN
305.1157   5.5474    2.1  37.4 -129.0   1.8964   5.5 ------	UNKNOWN
Post-slew image of 15-350 keV band
Time interval of the image:
161.100600 963.101000

# RAcent  DECcent POSerr Theta    Phi  PeakCts   SNR AngSep     Name
#  [deg]    [deg]    ['] [deg]  [deg]                   [']
170.2922 -60.6307    6.1  49.3   21.6   3.6533   1.9    0.8	Cen X-3
186.9152 -62.8911    0.0  41.8   26.1   1.5827   0.8   10.1	GX 301-2
255.9548 -37.8073    1.9  22.7  118.9   9.0169   5.9    2.7	4U 1700-377
256.5554 -36.5431   16.6  23.6  121.5   1.0777   0.7    9.2	GX 349+2
262.8377 -24.7413   42.0  32.9  140.9   0.5306   0.3    9.3	GX 1+4
264.8404 -44.6443    0.0  13.5  127.5  -0.4322  -0.4   12.4	4U 1735-44
270.2222 -24.9234    6.4  31.6  153.3   3.2366   1.8    9.9	GX 5-1
270.4590 -25.7552   22.8  30.8  153.5  -0.8732  -0.5    8.5	GRS 1758-258
274.0084 -14.0434    6.4  42.2  160.4   5.1824   1.8    0.4	GX 17+2
275.8059 -30.3744    3.4  25.9  162.9   4.5425   3.4    6.2	H1820-303
285.1536 -25.0399    4.2  31.9  179.1  -4.1283  -2.7    9.6	HT1900.1-2455
263.1549 -33.8817    8.3  24.0  136.4   2.1333   1.4    8.7	GX 354-0