Analysis Summary
Notes:
- 1) No attempt has been made to eliminate the non-significant decimal places.
- 2) This batgrbproduct analysis is done using the HEASARC data.
- 3) This batgrbproduct analysis is using the flight position for the mask-weighting calculation.
======================================================================
                  BAT GRB EVENT DATA PROCESSING REPORT
    Process Script Ver: batgrbproduct v2.48
    Process Start Time: Sun Oct 23 23:20:31 EDT 2022
             Host Name: batproc1
   Current Working Dir: /local/data/bat1/alien/Swift_3rdBATcatalog/event/batevent_reproc/trigger1104692
======================================================================

  Trigger: 01104692      Segment: 000

  BAT Trigger Time: 673019625.024   [s; MET]
      Trigger Stop: 673019626.048   [s; MET]
               UTC: 2022-04-30T13:53:15.969080    [includes UTCF correction]
       Where From?: TDRSS position message

  BAT
    RA: 97.6105079123594   Dec: 9.51011902952678  [deg; J2000]

     Catalogged Source?: NO
     Point Source?:      YES
     GRB Indicated?:     YES    [ by BAT flight software ]
     Image S/N Ratio:    7.24
     Image Trigger?:     NO
     Rate S/N Ratio:     22.7596133534821  [ if not an image trigger ]
     Image S/N Ratio:    7.24

  Analysis Position:   [ source = BAT ]
    RA: 97.6105079123594   Dec: 9.51011902952678  [deg; J2000]

  Refined Position:   [ source = BAT pre-slew burst ]
    RA: 97.6173219645669   Dec: 9.54730058127784  [deg; J2000]
        { 06h 30m 28.2s , +09d 32' 50.3" }
         +/- 0.703757752563403 [arcmin] (estimated 90% radius based on SNR)
         +/- 0.218972685845123 [arcmin] (formal 1-sigma fit error)
    SNR: 50.2441204972759

  Angular difference between the analysis and refined position is 2.267037 arcmin

  Partial Coding Fraction: 1    [ including projection effects ]

  Duration
     T90: 43.1439999341965 +/- 0.564127746156104
        Measured from: 12.107999920845
                   to: 55.2519998550415     [s; relative to TRIGTIME]
     T50: 10.7119998931885 +/- 0.0848529014078306
        Measured from: 34.8240000009537
                   to: 45.5359998941422     [s; relative to TRIGTIME]


  Fluence
     Peak Flux  (peak 1 second)
        Measured from: 42.0039999485016
                   to: 43.0039999485016     [s; relative to TRIGTIME]
     Total Fluence
        Measured from: -6.53200006484985
                   to: 94.6039999723434     [s; relative to TRIGTIME]

             Band 1     Band 2     Band 3     Band 4
              15-25      25-50     50-100    100-350     keV
 Total    14.972935  23.459056  21.565292   6.275467
           0.089702   0.103359   0.098922   0.070555 [error]
 Peak      0.752773   1.344086   1.331034   0.411576
           0.016035   0.020575   0.021336   0.014587 [error]

     [ fluence units of on-axis counts / fully illuminated detector ]

======================================================================


====== Table of the duration information =============================

        Value   tstart    tstop
T100  101.136   -6.532   94.604
T90    43.144   12.108   55.252
T50    10.712   34.824   45.536
Peak    1.000   42.004   43.004


====== Spectral Analysis Summary =====================================

Model      : spectral model: simple power-law (PL) and cutoff power-law (CPL)
Ph_index   : photon index: E^{Ph_index}
Ph_90err   : 90% error of the photon index
Epeak      : Epeak in keV
Epeak_90err: 90% error of Epeak
Norm       : normalization at 50 keV in both the PL model and CPL model
Nomr_90err : 90% error of the normalization
chi2       : Chi-Squared
dof        : degree of freedo

=== Time-averaged spectral analysis ===
(Best model with acceptable fit: N/A)

Model Ph_index Ph_90err_low Ph_90err_hi  Epeak  Epeak_90err_low  Epeak_90err_hi  Norm       Nomr_90err_low    Norm_90err_hi    chi2    dof
PL      -1.250    -0.021      0.021       -           -               -         4.31e-02     -5.46e-04          5.45e-04      22.580   57
CPL     -1.161    -0.043      0.087      635.164    -275.553      7084.346      4.65e-02     -3.03e-03          3.49e-03      19.410   56


=== 1-s peak spectral analysis ===
(Best model with acceptable fit: N/A)

Model Ph_index Ph_90err_low Ph_90err_hi  Epeak  Epeak_90err_low  Epeak_90err_hi  Norm       Nomr_90err_low    Norm_90err_hi    chi2    dof
PL      -1.128     -0.036     0.036       -           -               -         2.54e-01     -5.11e-03          5.11e-03      53.390   57
CPL     -0.928     -0.145     0.149      319.371    -110.050       610.778      3.09e-01     -4.02e-02          4.76e-02      47.800   56


=== Fluence/Peak Flux Summary ===

              Model    Band1     Band2     Band3     Band4     Band5     Total
                       15-25     25-50    50-100    100-350    15-150    15-350    keV
Fluence         PL   4.40e-06  9.44e-06  1.59e-05  6.10e-05  4.36e-05  9.07e-05   erg/cm2
      90%_error_low -1.22e-07 -1.60e-07 -1.76e-07 -1.55e-06 -4.80e-07 -1.55e-06   erg/cm2
      90%_error_hi   1.24e-07  1.59e-07  1.76e-07  1.57e-06  4.81e-07  1.57e-06   erg/cm2
Peak flux       PL   2.82e-03  3.48e-02  3.92e-01  3.35e+01  1.18e+00  2.06e+01   ph/cm2/s
      90%_error_low     N/A       N/A       N/A       N/A       N/A       N/A     ph/cm2/s
      90%_error_hi      N/A       N/A       N/A       N/A       N/A       N/A     ph/cm2/s

Fluence        CPL   4.26e-06  9.42e-06  1.61e-05  5.61e-05  4.35e-05  8.58e-05   erg/cm2
      90%_error_low -1.78e-07 -1.61e-07 -2.10e-07 -4.34e-06 -4.86e-07 -4.32e-06   erg/cm2
      90%_error_hi   1.81e-07  1.61e-07  2.46e-07  4.76e-06  4.86e-07  4.63e-06   erg/cm2
Peak flux      CPL   6.91e+00  9.27e+00  8.63e+00  1.11e+01  2.92e+01  3.60e+01   ph/cm2/s
      90%_error_low -4.19e-01 -2.44e-01 -2.32e-01 -1.40e+00 -6.64e-01 -1.60e+00   ph/cm2/s
      90%_error_hi   4.28e-01  2.45e-01  2.34e-01  1.65e+00  6.66e-01  1.82e+00   ph/cm2/s

======================================================================
Image
Pre-slew 15.0-350.0 keV image (Event data)
#   RAcent    DECcent   POSerr    Theta     Phi              Peak Cts       SNR   Name
   97.6173     9.5473   0.0038     1.4259   -54.0754         3.3173963     50.244 TRIG_01104692

Foreground time interval of the image:
 -6.532  11.877 (delta_t =  18.409 [sec])
Background time interval of the image:
-239.024  -6.532 (delta_t = 232.492 [sec])
Light Curves
Note: The mask-weighted lightcurves have units of either count/det or counts/sec/det, where a det is 0.4 x 0.4 = 0.16 sq cm.
Full-time range; 1 s binning
Other quick-look light curves:
- 64 ms binning (zoomed)
- 16 ms binning (zoomed)
- 8 ms binning (zoomed)
- 2 ms binning (zoomed)
- SN=5 or 10 s binning (full-time range)
- Raw light curve
Spectra
- 64 ms binning (zoomed)
- 16 ms binning (zoomed)
- 8 ms binning (zoomed)
- 2 ms binning (zoomed)
- SN=5 or 10 s binning (full-time range)
- Raw light curve
Spectra
Notes:
- 1) The fitting includes the systematic errors.
- 2) When the burst includes telescope slew time periods, the fitting uses an average response file made from multiple 5-s response files through out the slew time plus single time preiod for the non-slew times, and weighted by the total counts in the corresponding time period using addrmf. An average response file is needed becuase a spectral fit using the pre-slew DRM will introduce some errors in both a spectral shape and a normalization if the PHA file contains a lot of the slew/post-slew time interval.
- 3) For fits to more complicated models (e.g. a power-law over a cutoff power-law), the BAT team has decided to require a chi-square improvement of more than 6 for each extra dof.
Time averaged spectrum fit using the average DRM
Power-law model

Time interval is from   -6.532 sec. to   94.604 sec.

Spectral model in power-law:
------------------------------------------------------------
Parameters  : value       lower 90%   higher 90%
Photon index: -1.25005     ( -0.0206947   0.0207862 )
Norm@50keV  : 4.31055E-02    ( -0.00054605   0.000544778 )
------------------------------------------------------------
#Fit statistic  : Chi-Squared                   22.58     using 59 bins.
 Reduced chi-squared = 0.39614
# Null hypothesis probability of 1.00e+00 with 57 degrees of freedom

Photon flux (15-150 keV)    in 101.1 sec: 5.09829 ( -0.07444  0.07468 ) ph/cm2/s
Energy fluence (15-150 keV)             : 4.36186e-05 ( -4.8047e-07  4.80661e-07 ) ergs/cm2
Cutoff power-law model

Time interval is from   -6.532 sec. to   94.604 sec.
Spectral model in the cutoff power-law:
------------------------------------------------------------
Parameters  : value       lower 90%   higher 90%
Photon index: -1.16069     ( -0.0432498   0.0867215 )
Epeak [keV] : 635.164      ( -275.558 7084.34 )
Norm@50keV  : 4.65144E-02    ( -0.00302791   0.00349053 )
------------------------------------------------------------
#Fit statistic  : Chi-Squared                   19.41     using 59 bins.
 Reduced chi-squared = 0.346607
# Null hypothesis probability of 1.00e+00 with 56 degrees of freedom

Photon flux (15-150 keV)    in 101.1 sec: 2.89154 (    ) ph/cm2/s
Energy fluence (15-150 keV)             : 4.35412e-05 ( -4.85492e-07  4.85966e-07 ) ergs/cm2
1-s peak spectrum fit
Power-law model

Time interval is from   42.004 sec. to   43.004 sec.

Spectral model in power-law:
------------------------------------------------------------
Parameters  : value       lower 90%   higher 90%
Photon index: -1.12826     ( -0.0361994   0.0362801 )
Norm@50keV  : 0.254136    ( -0.00511212   0.00510877 )
------------------------------------------------------------
#Fit statistic  : Chi-Squared                   53.39     using 59 bins.
 Reduced chi-squared = 0.936667
# Null hypothesis probability of 6.11e-01 with 57 degrees of freedom

Photon flux (15-150 keV)    in 1 sec: 1.18494 (    ) ph/cm2/s
Energy fluence (15-150 keV)             : 2.63384e-06 ( -5.56792e-08  5.57743e-08 ) ergs/cm2
Cutoff power-law model

Time interval is from   42.004 sec. to   43.004 sec.
Spectral model in the cutoff power-law:
------------------------------------------------------------
Parameters  : value       lower 90%   higher 90%
Photon index: -0.928372     ( -0.14476   0.149351 )
Epeak [keV] : 319.371      ( -110.05 610.777 )
Norm@50keV  : 0.309343    ( -0.0401516   0.0475518 )
------------------------------------------------------------
#Fit statistic  : Chi-Squared                   47.80     using 59 bins.
 Reduced chi-squared = 0.853571
# Null hypothesis probability of 7.74e-01 with 56 degrees of freedom

Photon flux (15-150 keV)    in 1 sec: 29.2354 ( -0.6645  0.6661 ) ph/cm2/s
Energy fluence (15-150 keV)             : 2.61228e-06 ( -5.82853e-08  5.80811e-08 ) ergs/cm2
Time-resolved spectra

Distribution
T90 vs. Hardness ratio plot
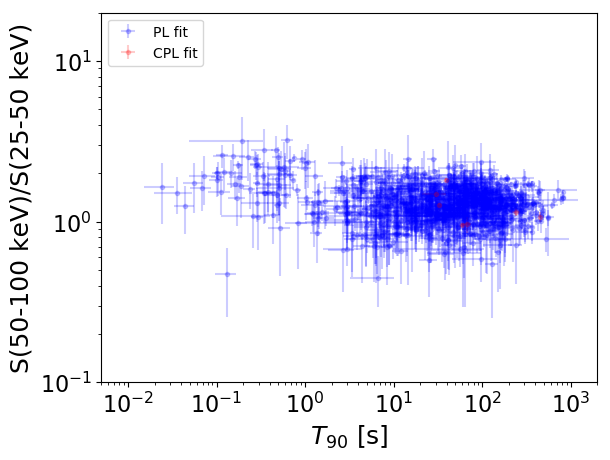
T90                                   = N/A sec.
Hardness ratio (energy fluence ratio) = N/A
S(15-50 keV) vs. S(50-150 keV) plot

S(15-50 keV)  = N/A
S(50-150 keV) = N/A
The dash-dotted line and the dashed line traces the fluences calculated from the Band function with Epeak = 15 and 150 keV, respectively. Both lines assume a canonical values of alpha = -1 and beta = -2.5.
Mask shadow pattern

IMX = 1.460439315182145E-02, IMY = 2.015692605363580E-02
Spacecraft aspect plot
Bright source in the pre-burst/pre-slew/post-slew images
Pre-burst image of 15-350 keV band
Time interval of the image:
-239.024000 -6.532000

# RAcent  DECcent POSerr Theta    Phi  PeakCts   SNR AngSep     Name
#  [deg]    [deg]    ['] [deg]  [deg]                   [']
 83.6409  22.0072    0.5  19.7  -61.6   9.1072  21.8    0.6	Crab
111.9841 -41.6754    2.2  51.6  150.3   7.9774   5.2 ------	UNKNOWN
 66.1897  23.5245    3.1  34.4  -77.0   2.2535   3.7 ------	UNKNOWN
Pre-slew background subtracted image of 15-350 keV band
Time interval of the image:
-6.532000 11.876600

# RAcent  DECcent POSerr Theta    Phi  PeakCts   SNR AngSep     Name
#  [deg]    [deg]    ['] [deg]  [deg]                   [']
 83.5159  21.8904    6.3  19.7  -62.1   0.1445   1.8    9.9	Crab
109.7267 -38.2462    2.0  47.8  151.2   1.2217   5.7 ------	UNKNOWN
101.7909   3.9787    2.7   5.5  126.5   0.2664   4.2 ------	UNKNOWN
113.9821  46.8139    2.5  40.6   -0.6   0.4829   4.7 ------	UNKNOWN
 97.6173   9.5473    0.2   1.4  -54.1   3.3176  50.2 ------	UNKNOWN
 59.6153 -32.7422    2.8  55.3 -156.9   1.1073   4.1 ------	UNKNOWN
 58.9294  26.5201    2.2  41.6  -76.0   1.4141   5.2 ------	UNKNOWN
Post-slew image of 15-350 keV band
Time interval of the image:
35.676600 937.576590

# RAcent  DECcent POSerr Theta    Phi  PeakCts   SNR AngSep     Name
#  [deg]    [deg]    ['] [deg]  [deg]                   [']
 83.6307  22.0225    0.6  18.3  -56.9  33.1483  20.3    0.5	Crab
117.6768  42.5179    2.7  37.4   13.1   9.1175   4.3 ------	UNKNOWN
 97.1423 -26.6672    2.9  36.2  169.2   7.8742   3.9 ------	UNKNOWN
110.5160  45.3427    2.6  37.5    3.4   9.2055   4.4 ------	UNKNOWN
103.6978  32.2690    3.0  23.4    1.5   5.8098   3.9 ------	UNKNOWN
 97.5825   9.5710    0.4   0.1  -45.2  44.0944  31.7 ------	UNKNOWN
106.0851  49.8342    2.6  40.9   -3.2   9.0452   4.5 ------	UNKNOWN
 79.7488  64.6117    2.5  56.5  -20.6  19.9721   4.7 ------	UNKNOWN