Analysis Summary
Notes:
- 1) No attempt has been made to eliminate the non-significant decimal places.
- 2) This batgrbproduct analysis is done using the HEASARC data.
- 3) This batgrbproduct analysis is using the flight position for the mask-weighting calculation.
======================================================================
                  BAT GRB EVENT DATA PROCESSING REPORT
    Process Script Ver: batgrbproduct v2.48
    Process Start Time: Sun Oct 23 23:18:40 EDT 2022
             Host Name: batproc1
   Current Working Dir: /local/data/bat1/alien/Swift_3rdBATcatalog/event/batevent_reproc/trigger1104842
======================================================================

  Trigger: 01104842      Segment: 000

  BAT Trigger Time: 673127540.288   [s; MET]
      Trigger Stop: 673127541.312   [s; MET]
               UTC: 2022-05-01T19:51:51.225760    [includes UTCF correction]
       Where From?: TDRSS position message

  BAT
    RA: 85.5770464780323   Dec: 14.0334581384361  [deg; J2000]

     Catalogged Source?: NO
     Point Source?:      YES
     GRB Indicated?:     YES    [ by BAT flight software ]
     Image S/N Ratio:    8.97
     Image Trigger?:     NO
     Rate S/N Ratio:     23.832750575626  [ if not an image trigger ]
     Image S/N Ratio:    8.97

  Analysis Position:   [ source = BAT ]
    RA: 85.5770464780323   Dec: 14.0334581384361  [deg; J2000]

  Refined Position:   [ source = BAT pre-slew burst ]
    RA: 85.5832914066446   Dec: 14.0101492310485  [deg; J2000]
        { 05h 42m 20.0s , +14d 00' 36.5" }
         +/- 1.57869286779101 [arcmin] (estimated 90% radius based on SNR)
         +/- 0.659957543053163 [arcmin] (formal 1-sigma fit error)
    SNR: 15.842949112027

  Angular difference between the analysis and refined position is 1.445010 arcmin

  Partial Coding Fraction: 0.9296875    [ including projection effects ]

  Duration
     T90: 202.239999890327 +/- 20.6013405693838
        Measured from: 0.455999970436096
                   to: 202.695999860764     [s; relative to TRIGTIME]
     T50: 40.703999876976 +/- 9.5580952067322
        Measured from: 5.83200001716614
                   to: 46.5359998941422     [s; relative to TRIGTIME]


  Fluence
     Peak Flux  (peak 1 second)
        Measured from: 4.27600002288818
                   to: 5.27600002288818     [s; relative to TRIGTIME]
     Total Fluence
        Measured from: -1.20799994468689
                   to: 224.200000047684     [s; relative to TRIGTIME]

             Band 1     Band 2     Band 3     Band 4
              15-25      25-50     50-100    100-350     keV
 Total     1.028229   1.620666   1.071470   0.090400
           0.098440   0.101295   0.087238   0.076115 [error]
 Peak      0.028821   0.046165   0.072346   0.019344
           0.006893   0.007677   0.007248   0.005608 [error]

     [ fluence units of on-axis counts / fully illuminated detector ]

======================================================================


====== Table of the duration information =============================

        Value   tstart    tstop
T100  225.408   -1.208  224.200
T90   202.240    0.456  202.696
T50    40.704    5.832   46.536
Peak    1.000    4.276    5.276


====== Spectral Analysis Summary =====================================

Model      : spectral model: simple power-law (PL) and cutoff power-law (CPL)
Ph_index   : photon index: E^{Ph_index}
Ph_90err   : 90% error of the photon index
Epeak      : Epeak in keV
Epeak_90err: 90% error of Epeak
Norm       : normalization at 50 keV in both the PL model and CPL model
Nomr_90err : 90% error of the normalization
chi2       : Chi-Squared
dof        : degree of freedo

=== Time-averaged spectral analysis ===
(Best model with acceptable fit: N/A)

Model Ph_index Ph_90err_low Ph_90err_hi  Epeak  Epeak_90err_low  Epeak_90err_hi  Norm       Nomr_90err_low    Norm_90err_hi    chi2    dof
PL      -1.542    -0.131      0.130       -           -               -         1.09e-03     -8.63e-05          8.58e-05      52.340   57
CPL     -0.638    -0.575      0.660       72.310     -13.569        43.548      3.21e-03     -1.57e-03          3.74e-03      44.640   56


=== 1-s peak spectral analysis ===
(Best model with acceptable fit: N/A)

Model Ph_index Ph_90err_low Ph_90err_hi  Epeak  Epeak_90err_low  Epeak_90err_hi  Norm       Nomr_90err_low    Norm_90err_hi    chi2    dof
PL      -0.742     -0.220     0.234       -           -               -         1.07e-02     -1.51e-03          1.48e-03      63.050   57
CPL      0.669     -1.204     1.718      117.054     -32.552       282.740      3.96e-02     -3.96e-02          1.34e-01      58.910   56


=== Fluence/Peak Flux Summary ===

              Model    Band1     Band2     Band3     Band4     Band5     Total
                       15-25     25-50    50-100    100-350    15-150    15-350    keV
Fluence         PL   3.27e-07  5.86e-07  8.05e-07  2.29e-06  2.32e-06  4.01e-06   erg/cm2
      90%_error_low -3.96e-08 -4.52e-08 -8.35e-08 -4.63e-07 -2.00e-07 -5.40e-07   erg/cm2
      90%_error_hi   4.08e-08  4.51e-08  8.35e-08  5.36e-07  2.02e-07  5.99e-07   erg/cm2
Peak flux       PL   2.14e-01  3.39e-01  4.05e-01  9.45e-01  1.23e+00  1.90e+00   ph/cm2/s
      90%_error_low -5.94e-02 -6.21e-02 -5.34e-02 -2.42e-01 -1.66e-01 -2.77e-01   ph/cm2/s
      90%_error_hi   6.67e-02  6.16e-02  5.33e-02  2.94e-01  1.67e-01  2.95e-01   ph/cm2/s

Fluence        CPL   2.85e-07  6.42e-07  8.29e-07  6.86e-07  2.15e-06  2.44e-06   erg/cm2
      90%_error_low -4.77e-08 -5.77e-08 -9.42e-08 -3.32e-07 -2.20e-07 -3.96e-07   erg/cm2
      90%_error_hi   4.84e-08  5.94e-08  9.42e-08  7.05e-07  2.26e-07  7.20e-07   erg/cm2
Peak flux      CPL   1.35e-01  3.43e-01  4.73e-01  3.55e-01  1.17e+00  1.31e+00   ph/cm2/s
      90%_error_low -7.17e-02 -7.43e-02 -7.71e-02 -1.84e-01 -1.77e-01 -2.63e-01   ph/cm2/s
      90%_error_hi   8.93e-02  7.18e-02  7.94e-02  4.41e-01  1.76e-01  4.60e-01   ph/cm2/s

======================================================================
Image
Pre-slew 15.0-350.0 keV image (Event data)
#   RAcent    DECcent   POSerr    Theta     Phi              Peak Cts       SNR   Name
   85.5833    14.0101   0.0122    12.6026   -69.3460         4.1774770     15.843 TRIG_01104842

Foreground time interval of the image:
 -1.208 224.200 (delta_t = 225.408 [sec])
Background time interval of the image:
-239.288  -1.208 (delta_t = 238.080 [sec])
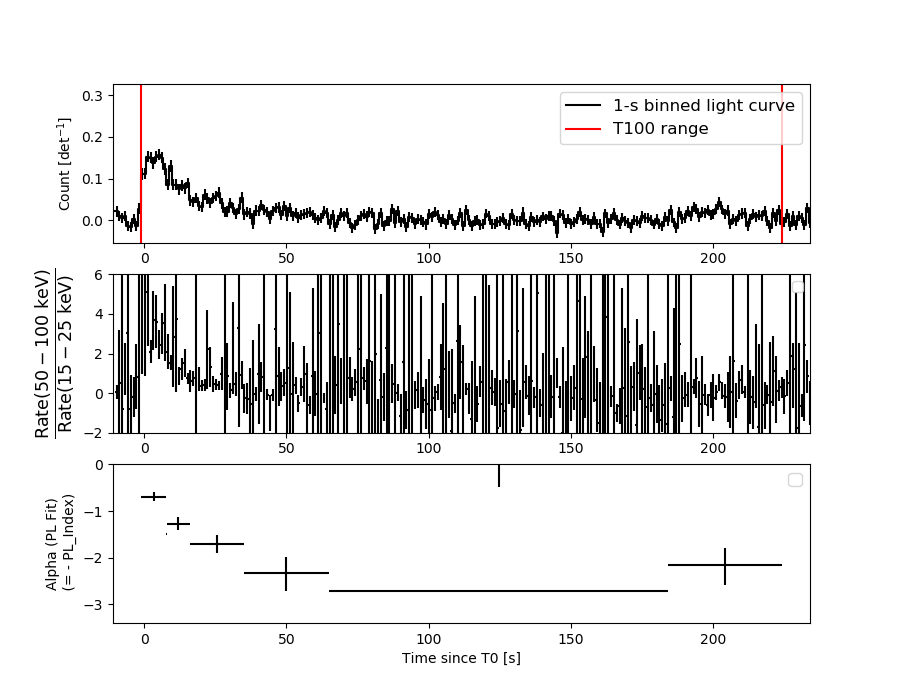
Light Curves
Note: The mask-weighted lightcurves have units of either count/det or counts/sec/det, where a det is 0.4 x 0.4 = 0.16 sq cm.
Full-time range; 1 s binning
Other quick-look light curves:
- 64 ms binning (zoomed)
- 16 ms binning (zoomed)
- 8 ms binning (zoomed)
- 2 ms binning (zoomed)
- SN=5 or 10 s binning (full-time range)
- Raw light curve
Spectra
- 64 ms binning (zoomed)
- 16 ms binning (zoomed)
- 8 ms binning (zoomed)
- 2 ms binning (zoomed)
- SN=5 or 10 s binning (full-time range)
- Raw light curve
Spectra
Notes:
- 1) The fitting includes the systematic errors.
- 2) When the burst includes telescope slew time periods, the fitting uses an average response file made from multiple 5-s response files through out the slew time plus single time preiod for the non-slew times, and weighted by the total counts in the corresponding time period using addrmf. An average response file is needed becuase a spectral fit using the pre-slew DRM will introduce some errors in both a spectral shape and a normalization if the PHA file contains a lot of the slew/post-slew time interval.
- 3) For fits to more complicated models (e.g. a power-law over a cutoff power-law), the BAT team has decided to require a chi-square improvement of more than 6 for each extra dof.
Time averaged spectrum fit using the average DRM
Power-law model
Time interval is from   -1.208 sec. to  224.200 sec.

Spectral model in power-law:
------------------------------------------------------------
Parameters  : value       lower 90%   higher 90%
Photon index: -1.54212     ( -0.131272   0.129692 )
Norm@50keV  : 1.09259E-03    ( -8.63192e-05   8.5814e-05 )
------------------------------------------------------------
#Fit statistic  : Chi-Squared                   52.34     using 59 bins.
 Reduced chi-squared = 0.918246
# Null hypothesis probability of 6.50e-01 with 57 degrees of freedom

Photon flux (15-150 keV)    in 225.4 sec: 0.138006 ( -0.010475  0.010483 ) ph/cm2/s
Energy fluence (15-150 keV)             : 2.32137e-06 ( -1.99623e-07  2.01841e-07 ) ergs/cm2
Cutoff power-law model
Time interval is from   -1.208 sec. to  224.200 sec.
Spectral model in the cutoff power-law:
------------------------------------------------------------
Parameters  : value       lower 90%   higher 90%
Photon index: -0.637833     ( -0.575051   0.659982 )
Epeak [keV] : 72.3096      ( -13.5687 43.548 )
Norm@50keV  : 3.21493E-03    ( -0.00157032   0.00374097 )
------------------------------------------------------------
#Fit statistic  : Chi-Squared                   44.64     using 59 bins.
 Reduced chi-squared = 0.797143
# Null hypothesis probability of 8.63e-01 with 56 degrees of freedom

Photon flux (15-150 keV)    in 225.4 sec: 0.132342 ( -0.011049  0.011049 ) ph/cm2/s
Energy fluence (15-150 keV)             : 2.14894e-06 ( -2.20242e-07  2.25954e-07 ) ergs/cm2
1-s peak spectrum fit
Power-law model
Time interval is from    4.276 sec. to    5.276 sec.

Spectral model in power-law:
------------------------------------------------------------
Parameters  : value       lower 90%   higher 90%
Photon index: -0.742282     ( -0.220316   0.233725 )
Norm@50keV  : 1.06849E-02    ( -0.00150641   0.00148203 )
------------------------------------------------------------
#Fit statistic  : Chi-Squared                   63.05     using 59 bins.
 Reduced chi-squared = 1.10614
# Null hypothesis probability of 2.71e-01 with 57 degrees of freedom

Photon flux (15-150 keV)    in 1 sec: 1.23142 ( -0.16577  0.16654 ) ph/cm2/s
Energy fluence (15-150 keV)             : 1.28009e-07 ( -1.74205e-08  1.74866e-08 ) ergs/cm2
Cutoff power-law model
Time interval is from    4.276 sec. to    5.276 sec.
Spectral model in the cutoff power-law:
------------------------------------------------------------
Parameters  : value       lower 90%   higher 90%
Photon index: 0.668976     ( -1.20363   1.71753 )
Epeak [keV] : 117.054      ( -32.5497 282.742 )
Norm@50keV  : 3.95915E-02    ( -0.0395939   0.134366 )
------------------------------------------------------------
#Fit statistic  : Chi-Squared                   58.91     using 59 bins.
 Reduced chi-squared = 1.05196
# Null hypothesis probability of 3.69e-01 with 56 degrees of freedom

Photon flux (15-150 keV)    in 1 sec: 1.16766 ( -0.177146  0.17648 ) ph/cm2/s
Energy fluence (15-150 keV)             : 1.21719e-07 ( -1.96086e-08  1.90477e-08 ) ergs/cm2
Time-resolved spectra
Distribution
T90 vs. Hardness ratio plot
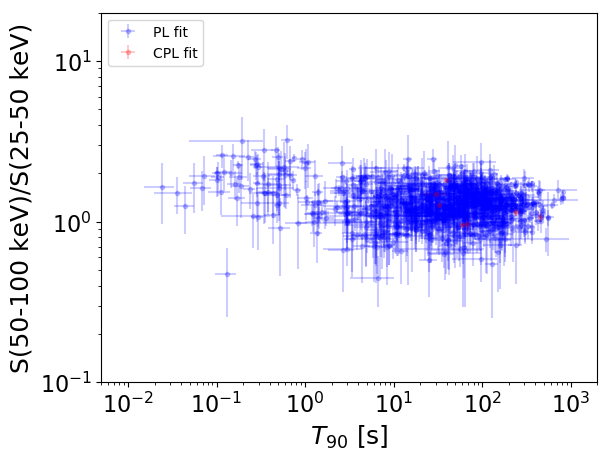
T90                                   = N/A sec.
Hardness ratio (energy fluence ratio) = N/A
S(15-50 keV) vs. S(50-150 keV) plot
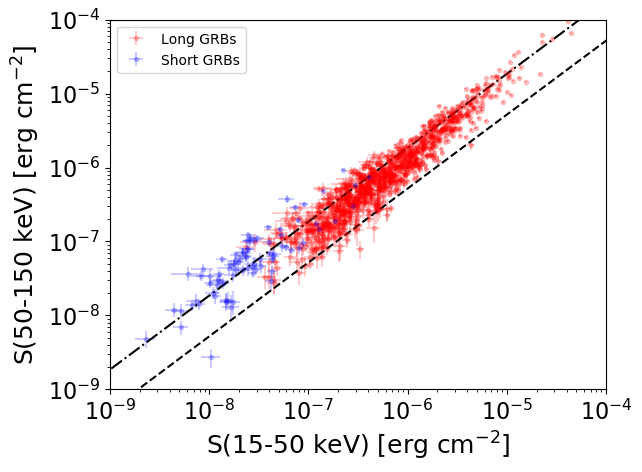
S(15-50 keV)  = N/A
S(50-150 keV) = N/A
The dash-dotted line and the dashed line traces the fluences calculated from the Band function with Epeak = 15 and 150 keV, respectively. Both lines assume a canonical values of alpha = -1 and beta = -2.5.
Mask shadow pattern
IMX = 7.885979576074158E-02, IMY = 2.092046966218329E-01
Spacecraft aspect plot
Bright source in the pre-burst/pre-slew/post-slew images
Pre-burst image of 15-350 keV band
Time interval of the image:
-239.288000 -1.208000

# RAcent  DECcent POSerr Theta    Phi  PeakCts   SNR AngSep     Name
#  [deg]    [deg]    ['] [deg]  [deg]                   [']
 83.6429  22.0295    0.5  18.3  -46.6   9.5155  23.7    1.1	Crab
104.6144  53.6492    2.2  44.4    4.9   3.2986   5.3 ------	UNKNOWN
 95.9713  66.5758    2.8  57.0   -1.7   5.3451   4.1 ------	UNKNOWN
 79.0586  44.3165    3.1  38.3  -22.6   1.9587   3.7 ------	UNKNOWN
 75.5600 -18.8239    2.7  35.8 -143.5   2.0755   4.3 ------	UNKNOWN
 70.8724 -19.0891    3.0  39.0 -138.4   2.1619   3.9 ------	UNKNOWN
Pre-slew background subtracted image of 15-350 keV band
Time interval of the image:
-1.208000 224.200000

# RAcent  DECcent POSerr Theta    Phi  PeakCts   SNR AngSep     Name
#  [deg]    [deg]    ['] [deg]  [deg]                   [']
 83.6026  22.1032    5.3  18.4  -46.5  -0.5526  -2.2    5.6	Crab
 85.5833  14.0101    0.7  12.6  -69.3   4.1776  15.8 ------	UNKNOWN
 67.1342  14.6940    2.1  30.2  -78.2   2.0125   5.5 ------	UNKNOWN
 57.9159  58.6228    2.0  57.5  -24.2   8.6855   5.7 ------	UNKNOWN
Post-slew image of 15-350 keV band
Time interval of the image: