Analysis Summary
Notes:
- 1) No attempt has been made to eliminate the non-significant decimal places.
- 2) This batgrbproduct analysis is done using the HEASARC data.
- 3) This batgrbproduct analysis is using the flight position for the mask-weighting calculation.
======================================================================
BAT GRB EVENT DATA PROCESSING REPORT
Process Script Ver: batgrbproduct v2.48
Process Start Time: Sun Oct 23 23:16:50 EDT 2022
Host Name: batproc1
Current Working Dir: /local/data/bat1/alien/Swift_3rdBATcatalog/event/batevent_reproc/trigger1107050
======================================================================
Trigger: 01107050 Segment: 000
BAT Trigger Time: 674547590.016 [s; MET]
Trigger Stop: 674547591.04 [s; MET]
UTC: 2022-05-18T06:19:20.857560 [includes UTCF correction]
Where From?: TDRSS position message
BAT
RA: 55.3694374195284 Dec: -47.5710041605747 [deg; J2000]
Catalogged Source?: NO
Point Source?: YES
GRB Indicated?: YES [ by BAT flight software ]
Image S/N Ratio: 9.46
Image Trigger?: NO
Rate S/N Ratio: 11.8321595661992 [ if not an image trigger ]
Image S/N Ratio: 9.46
Analysis Position: [ source = BAT ]
RA: 55.3694374195284 Dec: -47.5710041605747 [deg; J2000]
Refined Position: [ source = BAT pre-slew burst ]
RA: 55.3401229476424 Dec: -47.593197553799 [deg; J2000]
{ 03h 41m 21.6s , -47d 35' 35.5" }
+/- 1.95095834555953 [arcmin] (estimated 90% radius based on SNR)
+/- 0.878291828376103 [arcmin] (formal 1-sigma fit error)
SNR: 11.7078832842118
Angular difference between the analysis and refined position is 1.783465 arcmin
Partial Coding Fraction: 0.515625 [ including projection effects ]
Duration
T90: 12.2879998683929 +/- 3.03578652360382
Measured from: -7.52799999713898
to: 4.75999987125397 [s; relative to TRIGTIME]
T50: 5.37599980831146 +/- 1.55850187499417
Measured from: -4.51999998092651
to: 0.855999827384949 [s; relative to TRIGTIME]
Fluence
Peak Flux (peak 1 second)
Measured from: 0.0679999589920044
to: 1.067999958992 [s; relative to TRIGTIME]
Total Fluence
Measured from: -8.36000001430511
to: 7.57599997520447 [s; relative to TRIGTIME]
Band 1 Band 2 Band 3 Band 4
15-25 25-50 50-100 100-350 keV
Total 0.263884 0.374624 0.241109 0.039641
0.038677 0.040309 0.035008 0.029511 [error]
Peak 0.048946 0.080893 0.071012 0.018452
0.010388 0.011310 0.010120 0.008047 [error]
[ fluence units of on-axis counts / fully illuminated detector ]
======================================================================
====== Table of the duration information =============================
Value tstart tstop
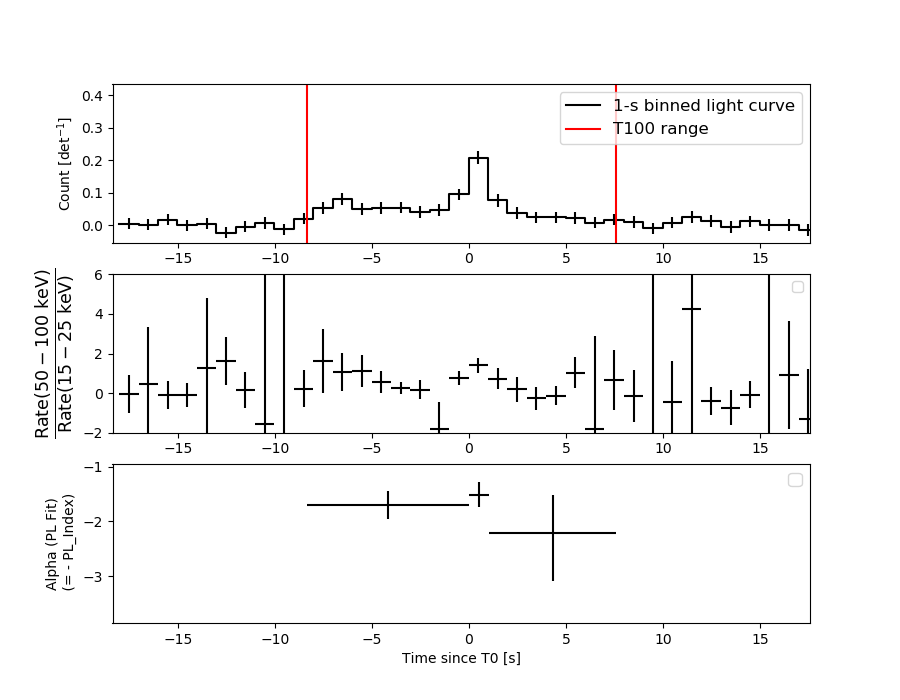
T100 15.936 -8.360 7.576
T90 12.288 -7.528 4.760
T50 5.376 -4.520 0.856
Peak 1.000 0.068 1.068
====== Spectral Analysis Summary =====================================
Model : spectral model: simple power-law (PL) and cutoff power-law (CPL)
Ph_index : photon index: E^{Ph_index}
Ph_90err : 90% error of the photon index
Epeak : Epeak in keV
Epeak_90err: 90% error of Epeak
Norm : normalization at 50 keV in both the PL model and CPL model
Nomr_90err : 90% error of the normalization
chi2 : Chi-Squared
dof : degree of freedo
=== Time-averaged spectral analysis ===
(Best model with acceptable fit: N/A)
Model Ph_index Ph_90err_low Ph_90err_hi Epeak Epeak_90err_low Epeak_90err_hi Norm Nomr_90err_low Norm_90err_hi chi2 dof
PL -1.717 -0.213 0.206 - - - 3.92e-03 -5.20e-04 5.13e-04 52.680 57
CPL -1.094 -0.752 1.026 68.260 -25.193 -68.260 8.43e-03 -4.84e-03 2.10e-02 51.070 56
=== 1-s peak spectral analysis ===
(Best model with acceptable fit: N/A)
Model Ph_index Ph_90err_low Ph_90err_hi Epeak Epeak_90err_low Epeak_90err_hi Norm Nomr_90err_low Norm_90err_hi chi2 dof
PL -1.494 -0.236 0.233 - - - 1.46e-02 -2.18e-03 2.18e-03 58.310 57
CPL -0.731 -0.861 1.136 87.844 -26.349 -87.844 3.45e-02 -2.10e-02 8.48e-02 56.360 56
=== Fluence/Peak Flux Summary ===
Model Band1 Band2 Band3 Band4 Band5 Total
15-25 25-50 50-100 100-350 15-150 15-350 keV
Fluence PL 9.78e-08 1.57e-07 1.92e-07 4.58e-07 5.78e-07 9.05e-07 erg/cm2
90%_error_low -1.83e-08 -1.95e-08 -3.32e-08 -1.44e-07 -7.92e-08 -1.79e-07 erg/cm2
90%_error_hi 1.90e-08 1.95e-08 3.32e-08 1.81e-07 8.00e-08 2.07e-07 erg/cm2
Peak flux PL 5.96e-01 6.02e-01 4.27e-01 4.83e-01 1.82e+00 2.11e+00 ph/cm2/s
90%_error_low -1.44e-01 -9.78e-02 -7.63e-02 -1.51e-01 -2.79e-01 -3.14e-01 ph/cm2/s
90%_error_hi 1.54e-01 9.66e-02 7.52e-02 1.84e-01 2.79e-01 3.15e-01 ph/cm2/s
Fluence CPL 9.03e-08 1.70e-07 1.96e-07 1.86e-07 5.52e-07 6.42e-07 erg/cm2
90%_error_low -2.13e-08 -2.52e-08 -3.68e-08 -1.26e-07 -8.63e-08 -1.56e-07 erg/cm2
90%_error_hi 2.15e-08 2.65e-08 3.69e-08 3.29e-07 8.72e-08 3.46e-07 erg/cm2
Peak flux CPL 5.15e-01 6.48e-01 4.68e-01 2.46e-01 1.78e+00 1.88e+00 ph/cm2/s
90%_error_low -1.71e-01 -1.14e-01 -9.21e-02 -1.42e-01 -2.82e-01 -3.25e-01 ph/cm2/s
90%_error_hi 1.81e-01 1.19e-01 9.61e-02 3.07e-01 2.83e-01 3.99e-01 ph/cm2/s
======================================================================
Image
Pre-slew 15.0-350.0 keV image (Event data)
#   RAcent    DECcent   POSerr    Theta     Phi              Peak Cts       SNR   Name
   55.3401   -47.5932   0.0164    41.2340    -4.6187         0.9117218     11.708 TRIG_01107050

Foreground time interval of the image:
 -8.360   7.576 (delta_t =  15.936 [sec])
Background time interval of the image:
-239.016  -8.360 (delta_t = 230.656 [sec])
Light Curves
Note: The mask-weighted lightcurves have units of either count/det or counts/sec/det, where a det is 0.4 x 0.4 = 0.16 sq cm.
Full-time range; 1 s binning
Other quick-look light curves:
- 64 ms binning (zoomed)
- 16 ms binning (zoomed)
- 8 ms binning (zoomed)
- 2 ms binning (zoomed)
- SN=5 or 10 s binning (full-time range)
- Raw light curve
Spectra
- 64 ms binning (zoomed)
- 16 ms binning (zoomed)
- 8 ms binning (zoomed)
- 2 ms binning (zoomed)
- SN=5 or 10 s binning (full-time range)
- Raw light curve
Spectra
Notes:
- 1) The fitting includes the systematic errors.
- 2) When the burst includes telescope slew time periods, the fitting uses an average response file made from multiple 5-s response files through out the slew time plus single time preiod for the non-slew times, and weighted by the total counts in the corresponding time period using addrmf. An average response file is needed becuase a spectral fit using the pre-slew DRM will introduce some errors in both a spectral shape and a normalization if the PHA file contains a lot of the slew/post-slew time interval.
- 3) For fits to more complicated models (e.g. a power-law over a cutoff power-law), the BAT team has decided to require a chi-square improvement of more than 6 for each extra dof.
Time averaged spectrum fit using the average DRM
Power-law model
Time interval is from   -8.360 sec. to    7.576 sec.

Spectral model in power-law:
------------------------------------------------------------
Parameters  : value       lower 90%   higher 90%
Photon index: -1.71667     ( -0.212579   0.206253 )
Norm@50keV  : 3.91826E-03    ( -0.000520011   0.000512912 )
------------------------------------------------------------
#Fit statistic  : Chi-Squared                   52.68     using 59 bins.
 Reduced chi-squared = 0.924211
# Null hypothesis probability of 6.38e-01 with 57 degrees of freedom

Photon flux (15-150 keV)    in 15.94 sec: 0.523479 ( -0.065223  0.065315 ) ph/cm2/s
Energy fluence (15-150 keV)             : 5.77642e-07 ( -7.91725e-08  8.00287e-08 ) ergs/cm2
Cutoff power-law model
Time interval is from   -8.360 sec. to    7.576 sec.
Spectral model in the cutoff power-law:
------------------------------------------------------------
Parameters  : value       lower 90%   higher 90%
Photon index: -1.09449     ( -0.751972   1.02558 )
Epeak [keV] : 68.2604      ( -25.1928 -68.2601 )
Norm@50keV  : 8.43094E-03    ( -0.00483912   0.0209935 )
------------------------------------------------------------
#Fit statistic  : Chi-Squared                   51.07     using 59 bins.
 Reduced chi-squared = 0.911964
# Null hypothesis probability of 6.62e-01 with 56 degrees of freedom

Photon flux (15-150 keV)    in 15.94 sec: 0.512401 ( -0.06721  0.067092 ) ph/cm2/s
Energy fluence (15-150 keV)             : 5.51999e-07 ( -8.63396e-08  8.72328e-08 ) ergs/cm2
1-s peak spectrum fit
Power-law model
Time interval is from    0.068 sec. to    1.068 sec.

Spectral model in power-law:
------------------------------------------------------------
Parameters  : value       lower 90%   higher 90%
Photon index: -1.49411     ( -0.23645   0.232917 )
Norm@50keV  : 1.45653E-02    ( -0.00218456   0.00217854 )
------------------------------------------------------------
#Fit statistic  : Chi-Squared                   58.31     using 59 bins.
 Reduced chi-squared = 1.02298
# Null hypothesis probability of 4.27e-01 with 57 degrees of freedom

Photon flux (15-150 keV)    in 1 sec: 1.81550 ( -0.27859  0.27928 ) ph/cm2/s
Energy fluence (15-150 keV)             : 1.38325e-07 ( -2.20383e-08  2.21362e-08 ) ergs/cm2
Cutoff power-law model
Time interval is from    0.068 sec. to    1.068 sec.
Spectral model in the cutoff power-law:
------------------------------------------------------------
Parameters  : value       lower 90%   higher 90%
Photon index: -0.731436     ( -0.860646   1.13591 )
Epeak [keV] : 87.8441      ( -26.3492 -87.8441 )
Norm@50keV  : 3.44837E-02    ( -0.0210054   0.0847594 )
------------------------------------------------------------
#Fit statistic  : Chi-Squared                   56.36     using 59 bins.
 Reduced chi-squared = 1.00643
# Null hypothesis probability of 4.61e-01 with 56 degrees of freedom

Photon flux (15-150 keV)    in 1 sec: 1.78256 ( -0.28218  0.28262 ) ph/cm2/s
Energy fluence (15-150 keV)             : 7.85869e-08 ( -3.02666e-08  2.16482e-08 ) ergs/cm2
Time-resolved spectra
Distribution
T90 vs. Hardness ratio plot
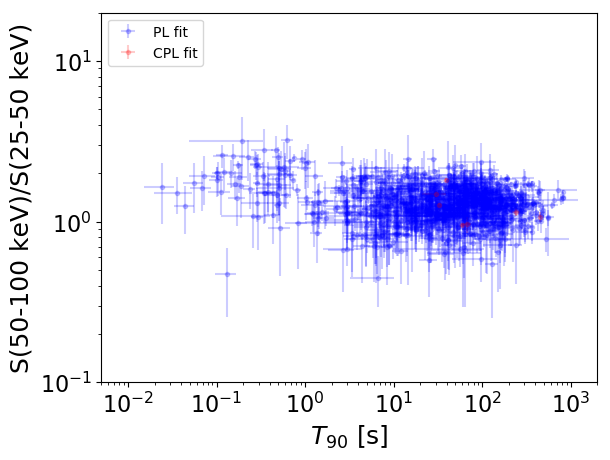
T90                                   = N/A sec.
Hardness ratio (energy fluence ratio) = N/A
S(15-50 keV) vs. S(50-150 keV) plot
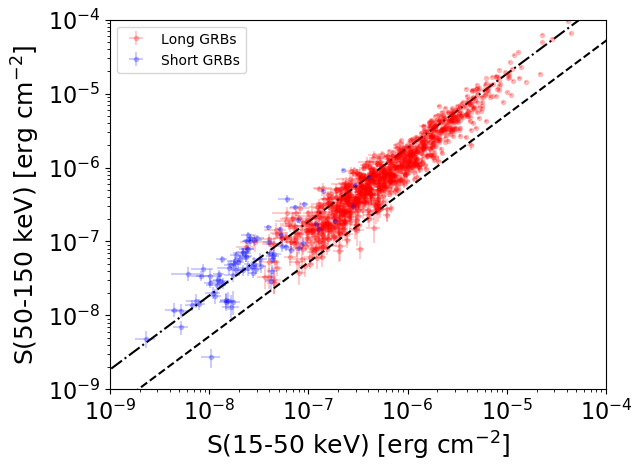
S(15-50 keV)  = N/A
S(50-150 keV) = N/A
The dash-dotted line and the dashed line traces the fluences calculated from the Band function with Epeak = 15 and 150 keV, respectively. Both lines assume a canonical values of alpha = -1 and beta = -2.5.
Mask shadow pattern
IMX = 8.736353591956291E-01, IMY = 7.057797028375146E-02
Spacecraft aspect plot
Bright source in the pre-burst/pre-slew/post-slew images
Pre-burst image of 15-350 keV band
Time interval of the image:
-239.016000 -8.360000

# RAcent  DECcent POSerr Theta    Phi  PeakCts   SNR AngSep     Name
#  [deg]    [deg]    ['] [deg]  [deg]                   [']
Pre-slew background subtracted image of 15-350 keV band
Time interval of the image:
-8.360000 7.576000

# RAcent  DECcent POSerr Theta    Phi  PeakCts   SNR AngSep     Name
#  [deg]    [deg]    ['] [deg]  [deg]                   [']
327.2203  -1.4556    2.1  50.3  145.3   1.3797   5.5 ------	UNKNOWN
 55.3402 -47.5932    1.0  41.2   -4.6   0.9115  11.7 ------	UNKNOWN
 11.6788  23.9619    2.4  46.4 -145.9   0.4924   4.8 ------	UNKNOWN
Post-slew image of 15-350 keV band
Time interval of the image:
109.084590 963.108800

# RAcent  DECcent POSerr Theta    Phi  PeakCts   SNR AngSep     Name
#  [deg]    [deg]    ['] [deg]  [deg]                   [']
 14.7304 -10.0755    2.9  50.7 -145.5  12.9729   4.1 ------	UNKNOWN