Analysis Summary
Notes:
- 1) No attempt has been made to eliminate the non-significant decimal places.
- 2) This batgrbproduct analysis is done using the HEASARC data.
- 3) This batgrbproduct analysis is using the flight position for the mask-weighting calculation.
======================================================================
                  BAT GRB EVENT DATA PROCESSING REPORT
    Process Script Ver: batgrbproduct v2.48
    Process Start Time: Sun Oct 23 23:15:17 EDT 2022
             Host Name: batproc1
   Current Working Dir: /local/data/bat1/alien/Swift_3rdBATcatalog/event/batevent_reproc/trigger1107466
======================================================================

  Trigger: 01107466      Segment: 000

  BAT Trigger Time: 674868050.624   [s; MET]
      Trigger Stop: 674868050.88   [s; MET]
               UTC: 2022-05-21T23:20:21.443840    [includes UTCF correction]
       Where From?: TDRSS position message

  BAT
    RA: 275.196625064596   Dec: 10.3843128192865  [deg; J2000]

     Catalogged Source?: NO
     Point Source?:      YES
     GRB Indicated?:     YES    [ by BAT flight software ]
     Image S/N Ratio:    9.92
     Image Trigger?:     NO
     Rate S/N Ratio:     21.6333076527839  [ if not an image trigger ]
     Image S/N Ratio:    9.92

  Analysis Position:   [ source = BAT ]
    RA: 275.196625064596   Dec: 10.3843128192865  [deg; J2000]

  Refined Position:   [ source = BAT pre-slew burst ]
    RA: 275.217901368988   Dec: 10.3722172639446  [deg; J2000]
        { 18h 20m 52.3s , +10d 22' 20.0" }
         +/- 1.66376493457738 [arcmin] (estimated 90% radius based on SNR)
         +/- 0.519184009420098 [arcmin] (formal 1-sigma fit error)
    SNR: 14.6984897206395

  Angular difference between the analysis and refined position is 1.450329 arcmin

  Partial Coding Fraction: 0.4609375    [ including projection effects ]

  Duration
     T90: 13.5479999780655 +/- 2.69150143247832
        Measured from: -0.059999942779541
                   to: 13.4880000352859     [s; relative to TRIGTIME]
     T50: 9.03199994564056 +/- 3.11905428149317
        Measured from: 0.388000011444092
                   to: 9.41999995708466     [s; relative to TRIGTIME]


  Fluence
     Peak Flux  (peak 1 second)
        Measured from: -0.179999947547913
                   to: 0.820000052452087     [s; relative to TRIGTIME]
     Total Fluence
        Measured from: -0.227999925613403
                   to: 16.1680001020432     [s; relative to TRIGTIME]

             Band 1     Band 2     Band 3     Band 4
              15-25      25-50     50-100    100-350     keV
 Total     0.541003   0.558335   0.320867   0.039333
           0.057617   0.045100   0.036269   0.030142 [error]
 Peak      0.182096   0.216528   0.138646   0.027665
           0.016895   0.015244   0.012438   0.007919 [error]

     [ fluence units of on-axis counts / fully illuminated detector ]

======================================================================


====== Table of the duration information =============================

        Value   tstart    tstop
T100   16.396   -0.228   16.168
T90    13.548   -0.060   13.488
T50     9.032    0.388    9.420
Peak    1.000   -0.180    0.820


====== Spectral Analysis Summary =====================================

Model      : spectral model: simple power-law (PL) and cutoff power-law (CPL)
Ph_index   : photon index: E^{Ph_index}
Ph_90err   : 90% error of the photon index
Epeak      : Epeak in keV
Epeak_90err: 90% error of Epeak
Norm       : normalization at 50 keV in both the PL model and CPL model
Nomr_90err : 90% error of the normalization
chi2       : Chi-Squared
dof        : degree of freedo

=== Time-averaged spectral analysis ===
(Best model with acceptable fit: N/A)

Model Ph_index Ph_90err_low Ph_90err_hi  Epeak  Epeak_90err_low  Epeak_90err_hi  Norm       Nomr_90err_low    Norm_90err_hi    chi2    dof
PL      -1.965    -0.180      0.174       -           -               -         5.33e-03     -5.63e-04          5.54e-04      54.250   57
CPL     -1.304    -0.737      0.884       48.844     -40.641       -48.844      1.19e-02     -6.95e-03          2.23e-02      51.960   56


=== 1-s peak spectral analysis ===
(Best model with acceptable fit: N/A)

Model Ph_index Ph_90err_low Ph_90err_hi  Epeak  Epeak_90err_low  Epeak_90err_hi  Norm       Nomr_90err_low    Norm_90err_hi    chi2    dof
PL      -1.895     -0.142     0.138       -           -               -         3.29e-02     -2.92e-03          2.89e-03      74.830   57
CPL     -1.193     -0.596     0.688       54.267     -11.309        42.340      7.75e-02     -3.94e-02          9.94e-02      70.710   56


=== Fluence/Peak Flux Summary ===

              Model    Band1     Band2     Band3     Band4     Band5     Total
                       15-25     25-50    50-100    100-350    15-150    15-350    keV
Fluence         PL   1.73e-07  2.40e-07  2.46e-07  4.59e-07  8.05e-07  1.12e-06   erg/cm2
      90%_error_low -2.54e-08 -2.24e-08 -3.52e-08 -1.23e-07 -8.14e-08 -1.59e-07   erg/cm2
      90%_error_hi   2.65e-08  2.24e-08  3.54e-08  1.51e-07  8.23e-08  1.79e-07   erg/cm2
Peak flux       PL   1.98e+00  1.58e+00  8.49e-01  6.66e-01  4.71e+00  5.08e+00   ph/cm2/s
      90%_error_low -2.49e-01 -1.31e-01 -9.59e-02 -1.36e-01 -3.96e-01 -4.11e-01   ph/cm2/s
      90%_error_hi   2.58e-01  1.31e-01  9.55e-02  1.55e-01  3.97e-01  4.11e-01   ph/cm2/s

Fluence        CPL   1.57e-07  2.55e-07  2.47e-07  1.83e-07  7.62e-07  8.42e-07   erg/cm2
      90%_error_low -3.17e-08 -2.81e-08 -3.87e-08 -1.11e-07 -9.17e-08 -1.48e-07   erg/cm2
      90%_error_hi   3.21e-08  2.89e-08  3.86e-08  3.18e-07  9.44e-08  3.24e-07   erg/cm2
Peak flux      CPL   1.78e+00  1.70e+00  8.86e-01  3.21e-01  4.58e+00  4.68e+00   ph/cm2/s
      90%_error_low -3.01e-01 -1.64e-01 -1.08e-01 -1.49e-01 -4.12e-01 -4.51e-01   ph/cm2/s
      90%_error_hi   3.06e-01  1.68e-01  1.10e-01  2.76e-01  4.12e-01  4.81e-01   ph/cm2/s

======================================================================
Image
Pre-slew 15.0-350.0 keV image (Event data)
#   RAcent    DECcent   POSerr    Theta     Phi              Peak Cts       SNR   Name
  275.2179    10.3722   0.0132    29.5142   -78.4563         1.0659374     14.698 TRIG_01107466

Foreground time interval of the image:
 -0.228   9.477 (delta_t =   9.705 [sec])
Background time interval of the image:
-239.624  -0.228 (delta_t = 239.396 [sec])
Light Curves
Note: The mask-weighted lightcurves have units of either count/det or counts/sec/det, where a det is 0.4 x 0.4 = 0.16 sq cm.
Full-time range; 1 s binning
Other quick-look light curves:
- 64 ms binning (zoomed)
- 16 ms binning (zoomed)
- 8 ms binning (zoomed)
- 2 ms binning (zoomed)
- SN=5 or 10 s binning (full-time range)
- Raw light curve
Spectra
- 64 ms binning (zoomed)
- 16 ms binning (zoomed)
- 8 ms binning (zoomed)
- 2 ms binning (zoomed)
- SN=5 or 10 s binning (full-time range)
- Raw light curve
Spectra
Notes:
- 1) The fitting includes the systematic errors.
- 2) When the burst includes telescope slew time periods, the fitting uses an average response file made from multiple 5-s response files through out the slew time plus single time preiod for the non-slew times, and weighted by the total counts in the corresponding time period using addrmf. An average response file is needed becuase a spectral fit using the pre-slew DRM will introduce some errors in both a spectral shape and a normalization if the PHA file contains a lot of the slew/post-slew time interval.
- 3) For fits to more complicated models (e.g. a power-law over a cutoff power-law), the BAT team has decided to require a chi-square improvement of more than 6 for each extra dof.
Time averaged spectrum fit using the average DRM
Power-law model
Time interval is from   -0.228 sec. to   16.168 sec.

Spectral model in power-law:
------------------------------------------------------------
Parameters  : value       lower 90%   higher 90%
Photon index: -1.96545     ( -0.180002   0.174056 )
Norm@50keV  : 5.32893E-03    ( -0.000562694   0.000554038 )
------------------------------------------------------------
#Fit statistic  : Chi-Squared                   54.25     using 59 bins.
 Reduced chi-squared = 0.951754
# Null hypothesis probability of 5.79e-01 with 57 degrees of freedom

Photon flux (15-150 keV)    in 16.4 sec: 0.786958 ( -0.076502  0.076849 ) ph/cm2/s
Energy fluence (15-150 keV)             : 8.0483e-07 ( -8.13545e-08  8.22726e-08 ) ergs/cm2
Cutoff power-law model
Time interval is from   -0.228 sec. to   16.168 sec.
Spectral model in the cutoff power-law:
------------------------------------------------------------
Parameters  : value       lower 90%   higher 90%
Photon index: -1.30387     ( -0.737171   0.88403 )
Epeak [keV] : 48.8438      ( -40.6411 -48.8439 )
Norm@50keV  : 1.19117E-02    ( -0.00694649   0.0223406 )
------------------------------------------------------------
#Fit statistic  : Chi-Squared                   51.96     using 59 bins.
 Reduced chi-squared = 0.927857
# Null hypothesis probability of 6.28e-01 with 56 degrees of freedom

Photon flux (15-150 keV)    in 16.4 sec: 0.756333 ( -0.083871  0.083924 ) ph/cm2/s
Energy fluence (15-150 keV)             : 7.61893e-07 ( -9.17403e-08  9.44422e-08 ) ergs/cm2
1-s peak spectrum fit
Power-law model
Time interval is from   -0.180 sec. to    0.820 sec.

Spectral model in power-law:
------------------------------------------------------------
Parameters  : value       lower 90%   higher 90%
Photon index: -1.89505     ( -0.141641   0.137692 )
Norm@50keV  : 3.28924E-02    ( -0.00291629   0.00288603 )
------------------------------------------------------------
#Fit statistic  : Chi-Squared                   74.83     using 59 bins.
 Reduced chi-squared = 1.31281
# Null hypothesis probability of 5.67e-02 with 57 degrees of freedom

Photon flux (15-150 keV)    in 1 sec: 4.71081 ( -0.39586  0.39672 ) ph/cm2/s
Energy fluence (15-150 keV)             : 3.02441e-07 ( -2.64404e-08  2.66151e-08 ) ergs/cm2
Cutoff power-law model
Time interval is from   -0.180 sec. to    0.820 sec.
Spectral model in the cutoff power-law:
------------------------------------------------------------
Parameters  : value       lower 90%   higher 90%
Photon index: -1.19268     ( -0.595581   0.687781 )
Epeak [keV] : 54.2669      ( -11.3086 42.3401 )
Norm@50keV  : 7.75055E-02    ( -0.0394213   0.0994487 )
------------------------------------------------------------
#Fit statistic  : Chi-Squared                   70.71     using 59 bins.
 Reduced chi-squared = 1.26268
# Null hypothesis probability of 8.92e-02 with 56 degrees of freedom

Photon flux (15-150 keV)    in 1 sec: 4.58062 ( -0.41157  0.41189 ) ph/cm2/s
Energy fluence (15-150 keV)             : 2.89728e-07 ( -2.86081e-08  2.87724e-08 ) ergs/cm2
Time-resolved spectra
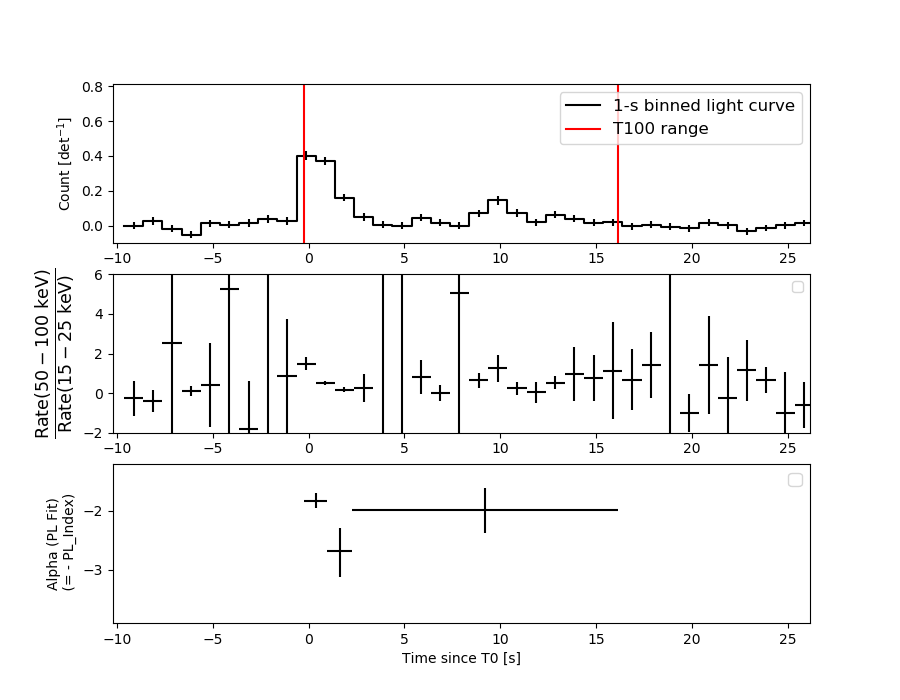
Distribution
T90 vs. Hardness ratio plot
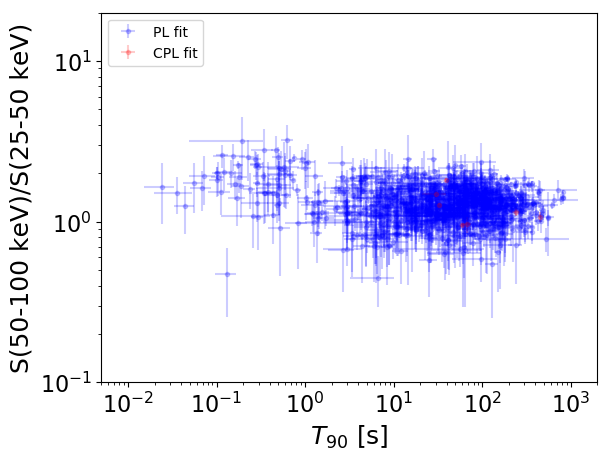
T90                                   = N/A sec.
Hardness ratio (energy fluence ratio) = N/A
S(15-50 keV) vs. S(50-150 keV) plot
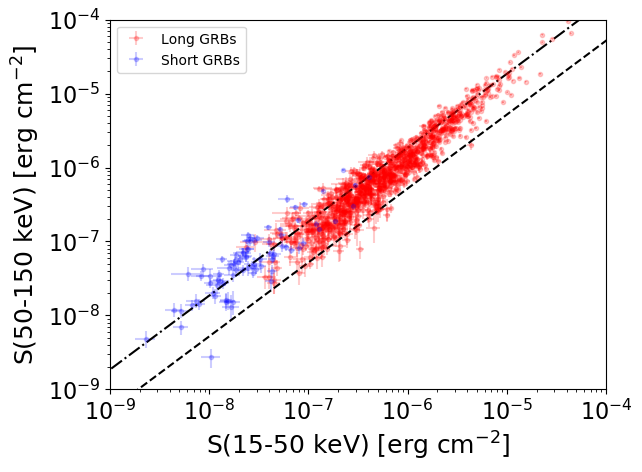
S(15-50 keV)  = N/A
S(50-150 keV) = N/A
The dash-dotted line and the dashed line traces the fluences calculated from the Band function with Epeak = 15 and 150 keV, respectively. Both lines assume a canonical values of alpha = -1 and beta = -2.5.
Mask shadow pattern
IMX = 1.132856191526152E-01, IMY = 5.546484929646723E-01
Spacecraft aspect plot
Bright source in the pre-burst/pre-slew/post-slew images
Pre-burst image of 15-350 keV band
Time interval of the image:
-239.624000 -0.228000

# RAcent  DECcent POSerr Theta    Phi  PeakCts   SNR AngSep     Name
#  [deg]    [deg]    ['] [deg]  [deg]                   [']
244.9744 -15.6457    0.2  10.2  107.6  28.9560  52.1    0.4	Sco X-1
254.4646  35.3893    8.6  45.1 -125.0   2.7319   1.3    2.8	Her X-1
255.9480 -37.9930    3.9  28.3   49.8   2.1916   3.0    9.1	4U 1700-377
256.3481 -36.4601    4.3  26.9   48.8   1.9664   2.7    4.8	GX 349+2
262.8136 -24.8041    9.8  17.5   24.6  -0.6618  -1.2   11.2	GX 1+4
264.7781 -44.3142    9.1  35.9   40.1   1.2647   1.3    8.3	4U 1735-44
268.2648  -1.3465   16.9  16.9  -64.9   0.4252   0.7    8.9	SW J1753.5-0127
270.1980 -25.0416    6.6  22.1   10.0   0.9860   1.8    5.2	GX 5-1
270.4246 -25.7633   11.9  22.7   11.1   0.5385   1.0    6.7	GRS 1758-258
273.9841 -14.0201   59.4  20.5  -22.0   0.1036   0.2    1.6	GX 17+2
276.0045 -30.3769    4.1  29.4   11.7   1.6741   2.8    4.2	H1820-303
285.0060 -24.8890    3.5  33.6   -5.2  -2.2056  -3.3    2.5	HT1900.1-2455
288.9160  10.9045    6.0  40.8  -65.6  -3.1497  -1.9    7.4	GRS 1915+105
263.0314 -33.6932   14.5  25.5   35.2  -0.5485  -0.8    8.7	GX 354-0
294.4702 -32.2495    3.0  44.0    0.9   3.7571   3.9 ------	UNKNOWN
234.4029  29.5242    2.9  43.4 -150.6   3.6010   3.9 ------	UNKNOWN
252.4846  26.9976    3.3  36.7 -127.6   3.1427   3.5 ------	UNKNOWN
Pre-slew background subtracted image of 15-350 keV band
Time interval of the image:
-0.228000 9.476590

# RAcent  DECcent POSerr Theta    Phi  PeakCts   SNR AngSep     Name
#  [deg]    [deg]    ['] [deg]  [deg]                   [']
244.9732 -15.7004    1.3  10.2  107.3   0.4118   8.6    3.6	Sco X-1
254.4900  35.2363    3.8  45.0 -125.0  -0.5328  -3.0    6.6	Her X-1
255.7453 -37.8583   14.6  28.2   50.1   0.0502   0.8   11.5	4U 1700-377
256.4898 -36.5957    5.3  27.0   48.6   0.1308   2.2   10.7	GX 349+2
262.8442 -24.7062   10.2  17.4   24.4  -0.0552  -1.1    9.3	GX 1+4
264.7524 -44.6004   31.3  36.2   40.3  -0.0316  -0.4    9.0	4U 1735-44
268.3957  -1.2893    3.8  17.1  -64.9  -0.1539  -3.1    9.9	SW J1753.5-0127
270.3408 -24.9479    8.7  22.1    9.6  -0.0617  -1.3    8.5	GX 5-1
270.4026 -25.8816   10.3  22.7   11.3  -0.0533  -1.1    9.9	GRS 1758-258
274.0938 -14.0189   17.6  20.6  -22.1  -0.0304  -0.7    5.2	GX 17+2
275.7080 -30.4147  107.0  29.3   12.1  -0.0058  -0.1   11.6	H1820-303
284.9492 -24.7382    0.0  33.5   -5.4  -0.0628  -1.1   11.9	HT1900.1-2455
288.7148  10.8864   14.6  40.6  -65.7  -0.1040  -0.8    6.1	GRS 1915+105
262.8567 -33.9032    5.1  25.7   35.7   0.1269   2.3    7.8	GX 354-0
232.2564  16.3546    2.9  33.5 -165.1   0.2066   3.9 ------	UNKNOWN
275.2179  10.3722    0.8  29.5  -78.5   1.0660  14.7 ------	UNKNOWN
Post-slew image of 15-350 keV band
Time interval of the image:
79.476590 547.476610

# RAcent  DECcent POSerr Theta    Phi  PeakCts   SNR AngSep     Name
#  [deg]    [deg]    ['] [deg]  [deg]                   [']
244.9765 -15.6565    0.9  39.6   90.2  51.2642  12.4    1.0	Sco X-1
254.4635  35.3721  116.0  31.3 -172.9   0.0831   0.1    1.8	Her X-1
263.2441 -24.7590    0.0  37.0   59.0  -1.9265  -0.8   12.8	GX 1+4
268.3523  -1.6592    0.0  13.8   70.7   1.3048   1.6   12.4	SW J1753.5-0127
270.4146 -25.1621    3.6  35.8   48.2   5.8689   3.2    8.7	GX 5-1
270.4359 -25.8158    3.7  36.5   48.0   5.7978   3.1    8.4	GRS 1758-258
274.0218 -14.0012    4.0  24.4   43.5   2.7924   2.9    2.3	GX 17+2
275.6713 -30.3481    0.0  40.7   40.2  -3.0405  -2.0   13.2	H1820-303
285.0963 -24.9482   27.4  36.6   25.6   0.5665   0.4    3.7	HT1900.1-2455
288.8211  10.7739   17.2  13.4  -52.2   0.5144   0.7   10.4	GRS 1915+105
299.6018  35.2058    0.6  33.3 -101.3  21.2486  17.9    0.6	Cyg X-1
233.3136  19.0801    3.0  41.3  148.0   7.8900   3.9 ------	UNKNOWN
227.8425  29.7952    3.1  48.1  161.8  10.6246   3.7 ------	UNKNOWN
222.3634  43.7568    2.9  56.4  177.1  12.4022   3.9 ------	UNKNOWN
269.9630  16.2616    3.3   7.8 -179.4   2.2408   3.5 ------	UNKNOWN
293.0742  -9.4470    2.4  26.6   -1.7   3.8528   4.8 ------	UNKNOWN
249.1982  48.8502    3.1  44.2 -163.6   4.5934   3.8 ------	UNKNOWN
265.2773  60.5118    2.8  50.7 -145.5   7.9310   4.1 ------	UNKNOWN