Analysis Summary
Notes:
- 1) No attempt has been made to eliminate the non-significant decimal places.
- 2) This batgrbproduct analysis is done using the HEASARC data.
- 3) This batgrbproduct analysis is using the flight position for the mask-weighting calculation.
======================================================================
                  BAT GRB EVENT DATA PROCESSING REPORT
    Process Script Ver: batgrbproduct v2.48
    Process Start Time: Mon Oct 24 11:50:32 EDT 2022
             Host Name: batproc1
   Current Working Dir: /local/data/bat1/alien/Swift_3rdBATcatalog/event/batevent_reproc/trigger1110090
======================================================================

  Trigger: 01110090      Segment: 000

  BAT Trigger Time: 676663340.48   [s; MET]
      Trigger Stop: 676663348.672   [s; MET]
               UTC: 2022-06-11T18:01:51.178200    [includes UTCF correction]
       Where From?: TDRSS position message

  BAT
    RA: 66.5264936478521   Dec: -37.2893134150936  [deg; J2000]

     Catalogged Source?: NO
     Point Source?:      YES
     GRB Indicated?:     YES    [ by BAT flight software ]
     Image S/N Ratio:    7.49
     Image Trigger?:     NO
     Rate S/N Ratio:     8.42614977317636  [ if not an image trigger ]
     Image S/N Ratio:    7.49

  Analysis Position:   [ source = BAT ]
    RA: 66.5264936478521   Dec: -37.2893134150936  [deg; J2000]

  Refined Position:   [ source = BAT pre-slew burst ]
    RA: 66.504925058925   Dec: -37.2650458247997  [deg; J2000]
        { 04h 26m 01.2s , -37d 15' 54.2" }
         +/- 2.11124995018527 [arcmin] (estimated 90% radius based on SNR)
         +/- 0.990827558206799 [arcmin] (formal 1-sigma fit error)
    SNR: 10.4590034252702

  Angular difference between the analysis and refined position is 1.783389 arcmin

  Partial Coding Fraction: 0.703125    [ including projection effects ]

  Duration
     T90: 57 +/- 12.369316876853
        Measured from: 1.51999998092651
                   to: 58.5199999809265     [s; relative to TRIGTIME]
     T50: 28 +/- 17.2626765016321
        Measured from: 7.51999998092651
                   to: 35.5199999809265     [s; relative to TRIGTIME]


  Fluence
     Peak Flux  (peak 1 second)
        Measured from: 9.51999998092651
                   to: 10.5199999809265     [s; relative to TRIGTIME]
     Total Fluence
        Measured from: 0.519999980926514
                   to: 61.5199999809265     [s; relative to TRIGTIME]

             Band 1     Band 2     Band 3     Band 4
              15-25      25-50     50-100    100-350     keV
 Total     0.413018   0.489580   0.276293   0.020451
           0.065161   0.068169   0.060892   0.057085 [error]
 Peak      0.011916   0.028697   0.007186   0.022634
           0.008452   0.009133   0.008217   0.007521 [error]

     [ fluence units of on-axis counts / fully illuminated detector ]

======================================================================


====== Table of the duration information =============================

        Value   tstart    tstop
T100   61.000    0.520   61.520
T90    57.000    1.520   58.520
T50    28.000    7.520   35.520
Peak    1.000    9.520   10.520


====== Spectral Analysis Summary =====================================

Model      : spectral model: simple power-law (PL) and cutoff power-law (CPL)
Ph_index   : photon index: E^{Ph_index}
Ph_90err   : 90% error of the photon index
Epeak      : Epeak in keV
Epeak_90err: 90% error of Epeak
Norm       : normalization at 50 keV in both the PL model and CPL model
Nomr_90err : 90% error of the normalization
chi2       : Chi-Squared
dof        : degree of freedo

=== Time-averaged spectral analysis ===
(Best model with acceptable fit: N/A)

Model Ph_index Ph_90err_low Ph_90err_hi  Epeak  Epeak_90err_low  Epeak_90err_hi  Norm       Nomr_90err_low    Norm_90err_hi    chi2    dof
PL      -1.873    -0.297      0.277       -           -               -         1.19e-03     -2.39e-04          2.32e-04      58.100   57
CPL     -0.977    -1.167      1.924       44.483     -34.032       -44.483      4.15e-03     -4.15e-03          6.88e-02      56.580   56


=== 1-s peak spectral analysis ===
(Best model with acceptable fit: N/A)

Model Ph_index Ph_90err_low Ph_90err_hi  Epeak  Epeak_90err_low  Epeak_90err_hi  Norm       Nomr_90err_low    Norm_90err_hi    chi2    dof
PL      -1.448      2.518     4.088       -           -               -         3.89e-03     -3.89e-03          -2.77e-03      59.870   57
CPL     -1.566      3.475     5.008     9999.360    -9999.360      -9999.360      3.80e-03     -3.80e-03          -3.25e-03      59.910   56


=== Fluence/Peak Flux Summary ===

              Model    Band1     Band2     Band3     Band4     Band5     Total
                       15-25     25-50    50-100    100-350    15-150    15-350    keV
Fluence         PL   1.31e-07  1.92e-07  2.10e-07  4.31e-07  6.66e-07  9.65e-07   erg/cm2
      90%_error_low -2.85e-08 -3.11e-08 -5.53e-08 -1.87e-07 -1.30e-07 -2.58e-07   erg/cm2
      90%_error_hi   2.93e-08  3.11e-08  5.73e-08  2.66e-07  1.34e-07  3.21e-07   erg/cm2
Peak flux       PL   1.51e-01  1.58e-01  1.17e-01  1.39e-01  4.79e-01  5.64e-01   ph/cm2/s
      90%_error_low -1.51e-01 -1.58e-01 -1.17e-01 -1.39e-01 -4.79e-01 -2.57e-01   ph/cm2/s
      90%_error_hi   1.50e-01  -1.37e-01  7.36e-02  2.36e+00  -2.03e-01  2.02e+00   ph/cm2/s

Fluence        CPL   1.26e-07  2.16e-07  1.92e-07  9.04e-08  5.96e-07  6.24e-07   erg/cm2
      90%_error_low -3.08e-08 -3.32e-08 -8.96e-08 -8.46e-08 -1.48e-07 -1.76e-07   erg/cm2
      90%_error_hi   3.10e-08  4.76e-08  6.91e-08  4.14e-07  1.64e-07  3.97e-07   erg/cm2
Peak flux      CPL   1.27e-01  7.65e-02  5.10e-02  3.58e-02  4.81e-01  5.65e-01   ph/cm2/s
      90%_error_low -1.27e-01 -7.65e-02 -5.10e-02 -3.58e-02     N/A       N/A     ph/cm2/s
      90%_error_hi   1.52e-01  1.21e-01  3.85e-02  4.89e-02     N/A       N/A     ph/cm2/s

======================================================================
Image
Pre-slew 15.0-350.0 keV image (Event data)

#   RAcent    DECcent   POSerr    Theta     Phi              Peak Cts       SNR   Name
   66.5049   -37.2650   0.0185    31.1492     6.5208         1.2927871     10.459 TRIG_01110090

Foreground time interval of the image:
  0.520  50.021 (delta_t =  49.501 [sec])
Background time interval of the image:
-239.480   0.520 (delta_t = 240.000 [sec])
Light Curves
Note: The mask-weighted lightcurves have units of either count/det or counts/sec/det, where a det is 0.4 x 0.4 = 0.16 sq cm.
Full-time range; 1 s binning
Other quick-look light curves:
- 64 ms binning (zoomed)
- 16 ms binning (zoomed)
- 8 ms binning (zoomed)
- 2 ms binning (zoomed)
- SN=5 or 10 s binning (full-time range)
- Raw light curve
Spectra
- 64 ms binning (zoomed)
- 16 ms binning (zoomed)
- 8 ms binning (zoomed)
- 2 ms binning (zoomed)
- SN=5 or 10 s binning (full-time range)
- Raw light curve
Spectra
Notes:
- 1) The fitting includes the systematic errors.
- 2) When the burst includes telescope slew time periods, the fitting uses an average response file made from multiple 5-s response files through out the slew time plus single time preiod for the non-slew times, and weighted by the total counts in the corresponding time period using addrmf. An average response file is needed becuase a spectral fit using the pre-slew DRM will introduce some errors in both a spectral shape and a normalization if the PHA file contains a lot of the slew/post-slew time interval.
- 3) For fits to more complicated models (e.g. a power-law over a cutoff power-law), the BAT team has decided to require a chi-square improvement of more than 6 for each extra dof.
Time averaged spectrum fit using the average DRM
Power-law model

Time interval is from    0.520 sec. to   61.520 sec.

Spectral model in power-law:
------------------------------------------------------------
Parameters  : value       lower 90%   higher 90%
Photon index: -1.87251     ( -0.296789   0.277447 )
Norm@50keV  : 1.18741E-03    ( -0.000238753   0.000232324 )
------------------------------------------------------------
#Fit statistic  : Chi-Squared                   58.10     using 59 bins.
 Reduced chi-squared = 1.0193
# Null hypothesis probability of 4.35e-01 with 57 degrees of freedom

Photon flux (15-150 keV)    in 61 sec: 0.168461 ( -0.027029  0.02703 ) ph/cm2/s
Energy fluence (15-150 keV)             : 6.6598e-07 ( -1.29838e-07  1.3437e-07 ) ergs/cm2
Cutoff power-law model

Time interval is from    0.520 sec. to   61.520 sec.
Spectral model in the cutoff power-law:
------------------------------------------------------------
Parameters  : value       lower 90%   higher 90%
Photon index: -0.977163     ( -1.16682   1.92329 )
Epeak [keV] : 44.4829      ( -34.0267 -44.4776 )
Norm@50keV  : 4.15486E-03    ( -0.00415737   0.0687958 )
------------------------------------------------------------
#Fit statistic  : Chi-Squared                   56.58     using 59 bins.
 Reduced chi-squared = 1.01036
# Null hypothesis probability of 4.53e-01 with 56 degrees of freedom

Photon flux (15-150 keV)    in 61 sec: 0.163868 ( -0.027603  0.027722 ) ph/cm2/s
Energy fluence (15-150 keV)             : 5.95511e-07 ( -1.47716e-07  1.64045e-07 ) ergs/cm2
1-s peak spectrum fit
Power-law model

Time interval is from    9.520 sec. to   10.520 sec.

Spectral model in power-law:
------------------------------------------------------------
Parameters  : value       lower 90%   higher 90%
Photon index: 1.99294     ( -0.92305   0.647128 )
Norm@50keV  : 2.88527E-04    ( -0.00028802   0.000839446 )
------------------------------------------------------------
#Fit statistic  : Chi-Squared                   56.97     using 59 bins.
 Reduced chi-squared = 0.999474
# Null hypothesis probability of 4.76e-01 with 57 degrees of freedom

Photon flux (15-150 keV)    in 1 sec: 0.479136 ( -0.479136  -0.203151 ) ph/cm2/s
Energy fluence (15-150 keV)             : 3.74093e-08 ( -2.03693e-08  2.23658e-08 ) ergs/cm2
Cutoff power-law model

Time interval is from    9.520 sec. to   10.520 sec.
Spectral model in the cutoff power-law:
------------------------------------------------------------
Parameters  : value       lower 90%   higher 90%
Photon index: 2.83694     ( -0.927608   0.605426 )
Epeak [keV] : 1.00000E+04      ( -10000 -10000 )
Norm@50keV  : 1.36728E-04    ( -0.000136735   0.000413608 )
------------------------------------------------------------
#Fit statistic  : Chi-Squared                   55.72     using 59 bins.
 Reduced chi-squared = 0.995
# Null hypothesis probability of 4.85e-01 with 56 degrees of freedom

Photon flux (15-150 keV)    in 1 sec: 0.480592 (    ) ph/cm2/s
Energy fluence (15-150 keV)             : 1.84493e-08 ( -1.84466e-08  1.46653e-08 ) ergs/cm2
Time-resolved spectra

Distribution
T90 vs. Hardness ratio plot

T90                                   = N/A sec.
Hardness ratio (energy fluence ratio) = N/A
S(15-50 keV) vs. S(50-150 keV) plot
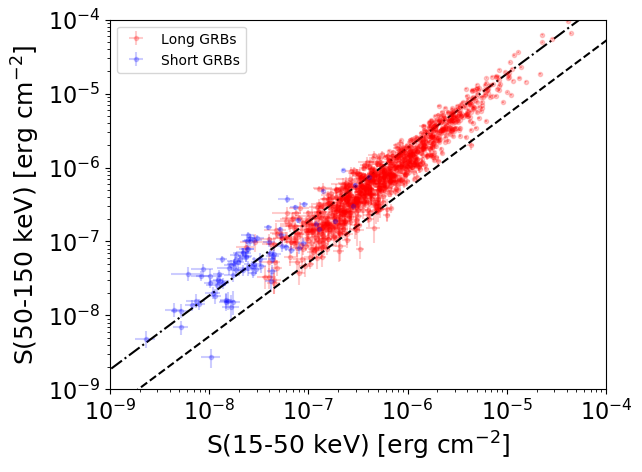
S(15-50 keV)  = N/A
S(50-150 keV) = N/A
The dash-dotted line and the dashed line traces the fluences calculated from the Band function with Epeak = 15 and 150 keV, respectively. Both lines assume a canonical values of alpha = -1 and beta = -2.5.
Mask shadow pattern

IMX = 6.004993547405564E-01, IMY = -6.863945004957943E-02
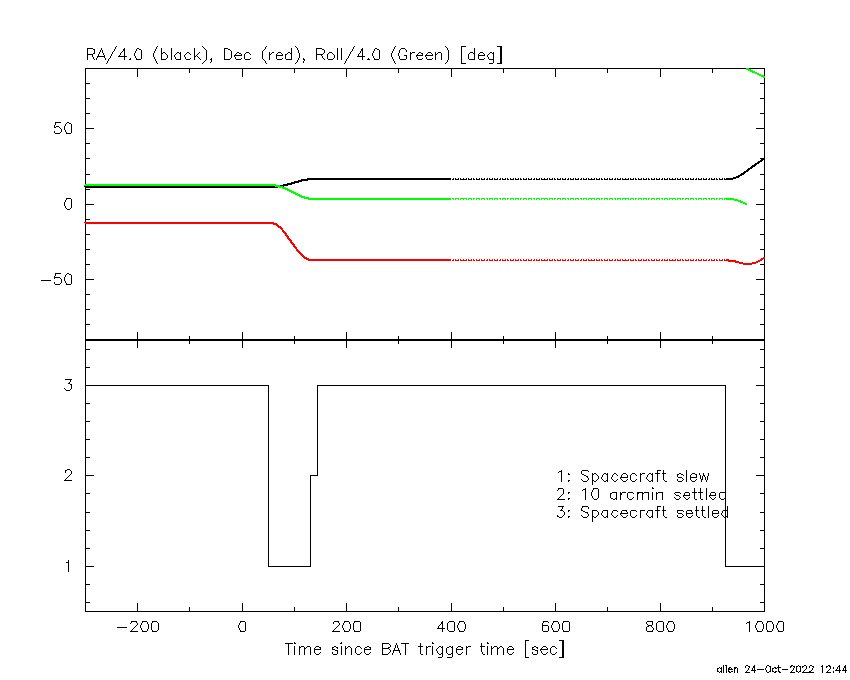
Spacecraft aspect plot
Bright source in the pre-burst/pre-slew/post-slew images
Pre-burst image of 15-350 keV band
Time interval of the image:
-239.480000 0.520000

# RAcent  DECcent POSerr Theta    Phi  PeakCts   SNR AngSep     Name
#  [deg]    [deg]    ['] [deg]  [deg]                   [']
 92.4095 -53.9228    2.7  55.5    8.2   6.0682   4.3 ------	UNKNOWN
 69.5920 -19.6019    2.8  24.0  -29.6   1.7073   4.1 ------	UNKNOWN
 91.0460  -3.3139    2.7  45.6  -57.9   8.5807   4.3 ------	UNKNOWN
 56.0595  34.9006    2.7  48.1 -129.2   8.1991   4.3 ------	UNKNOWN
Pre-slew background subtracted image of 15-350 keV band
Time interval of the image:
0.520000 50.020600

# RAcent  DECcent POSerr Theta    Phi  PeakCts   SNR AngSep     Name
#  [deg]    [deg]    ['] [deg]  [deg]                   [']
 66.5050 -37.2651    1.1  31.1    6.5   1.2928  10.5 ------	UNKNOWN
 75.2448 -30.4594    2.4  32.8  -12.1   0.5747   4.8 ------	UNKNOWN
Post-slew image of 15-350 keV band
Time interval of the image:
131.620590 925.220590

# RAcent  DECcent POSerr Theta    Phi  PeakCts   SNR AngSep     Name
#  [deg]    [deg]    ['] [deg]  [deg]                   [']
135.7375 -40.5384    5.3  52.5   12.6   4.6927   2.2    9.6	Vela X-1
134.6616 -27.9496    4.1  56.9   -1.9   8.2489   2.8 ------	UNKNOWN
 97.4877  -1.5636    2.7  45.6  -57.9  22.4898   4.3 ------	UNKNOWN
 76.8431   2.6680    2.1  41.1  -88.1  25.4140   5.4 ------	UNKNOWN