Analysis Summary
Notes:
- 1) No attempt has been made to eliminate the non-significant decimal places.
- 2) This batgrbproduct analysis is done using the HEASARC data.
- 3) This batgrbproduct analysis is using the flight position for the mask-weighting calculation.
======================================================================
                  BAT GRB EVENT DATA PROCESSING REPORT
    Process Script Ver: batgrbproduct v2.48
    Process Start Time: Mon Oct 24 11:47:33 EDT 2022
             Host Name: batproc1
   Current Working Dir: /local/data/bat1/alien/Swift_3rdBATcatalog/event/batevent_reproc/trigger1110821
======================================================================

  Trigger: 01110821      Segment: 000

  BAT Trigger Time: 677236259.264   [s; MET]
      Trigger Stop: 677236261.312   [s; MET]
               UTC: 2022-06-18T09:10:29.923380    [includes UTCF correction]
       Where From?: TDRSS position message

  BAT
    RA: 38.9662491492886   Dec: 55.2135808003858  [deg; J2000]

     Catalogged Source?: NO
     Point Source?:      YES
     GRB Indicated?:     YES    [ by BAT flight software ]
     Image S/N Ratio:    9.03
     Image Trigger?:     NO
     Rate S/N Ratio:     7.14142842854285  [ if not an image trigger ]
     Image S/N Ratio:    9.03

  Analysis Position:   [ source = BAT ]
    RA: 38.9662491492886   Dec: 55.2135808003858  [deg; J2000]

  Refined Position:   [ source = BAT pre-slew burst ]
    RA: 38.9953816386933   Dec: 55.2191173087397  [deg; J2000]
        { 02h 35m 58.9s , +55d 13' 08.8" }
         +/- 2.05706039343107 [arcmin] (estimated 90% radius based on SNR)
         +/- 0.752076884886051 [arcmin] (formal 1-sigma fit error)
    SNR: 10.8548194751621

  Angular difference between the analysis and refined position is 1.051045 arcmin

  Partial Coding Fraction: 0.1933594    [ including projection effects ]

  Duration
     T90: 106.368000030518 +/- 50.8710841159097
        Measured from: -9.20000004768372
                   to: 97.1679999828339     [s; relative to TRIGTIME]
     T50: 22.2719999551773 +/- 11.3319880626803
        Measured from: -0.832000017166138
                   to: 21.4399999380112     [s; relative to TRIGTIME]


  Fluence
     Peak Flux  (peak 1 second)
        Measured from: 0.163999915122986
                   to: 1.16399991512299     [s; relative to TRIGTIME]
     Total Fluence
        Measured from: -11.4400000572205
                   to: 136.975999951363     [s; relative to TRIGTIME]

             Band 1     Band 2     Band 3     Band 4
              15-25      25-50     50-100    100-350     keV
 Total     0.959361   1.853715   1.494157  -0.011466
           0.146305   0.153331   0.134352   0.114120 [error]
 Peak      0.031826   0.088513   0.099325   0.026808
           0.018338   0.020820   0.018372   0.014999 [error]

     [ fluence units of on-axis counts / fully illuminated detector ]

======================================================================


====== Table of the duration information =============================

        Value   tstart    tstop
T100  148.416  -11.440  136.976
T90   106.368   -9.200   97.168
T50    22.272   -0.832   21.440
Peak    1.000    0.164    1.164


====== Spectral Analysis Summary =====================================

Model      : spectral model: simple power-law (PL) and cutoff power-law (CPL)
Ph_index   : photon index: E^{Ph_index}
Ph_90err   : 90% error of the photon index
Epeak      : Epeak in keV
Epeak_90err: 90% error of Epeak
Norm       : normalization at 50 keV in both the PL model and CPL model
Nomr_90err : 90% error of the normalization
chi2       : Chi-Squared
dof        : degree of freedo

=== Time-averaged spectral analysis ===
(Best model with acceptable fit: N/A)

Model Ph_index Ph_90err_low Ph_90err_hi  Epeak  Epeak_90err_low  Epeak_90err_hi  Norm       Nomr_90err_low    Norm_90err_hi    chi2    dof
PL      -1.589    -0.156      0.154       -           -               -         2.20e-03     -2.16e-04          2.16e-04      59.900   57
CPL     -0.259    -0.716      0.850       65.824     -10.208        21.740      1.02e-02     -5.64e-03          1.63e-02      48.550   56


=== 1-s peak spectral analysis ===
(Best model with acceptable fit: N/A)

Model Ph_index Ph_90err_low Ph_90err_hi  Epeak  Epeak_90err_low  Epeak_90err_hi  Norm       Nomr_90err_low    Norm_90err_hi    chi2    dof
PL      -2.937     -0.452     0.391       -           -               -         4.30e-03     -1.71e-03          1.68e-03      88.690   57
CPL      5.790     -3.404    -5.790       54.005      -7.996         9.059      3.93e+01     -3.93e+01          1.25e+03      64.620   56


=== Fluence/Peak Flux Summary ===

              Model    Band1     Band2     Band3     Band4     Band5     Total
                       15-25     25-50    50-100    100-350    15-150    15-350    keV
Fluence         PL   4.53e-07  7.88e-07  1.05e-06  2.84e-06  3.05e-06  5.13e-06   erg/cm2
      90%_error_low -6.92e-08 -7.93e-08 -1.29e-07 -6.61e-07 -3.17e-07 -7.86e-07   erg/cm2
      90%_error_hi   7.21e-08  7.89e-08  1.29e-07  7.76e-07  3.19e-07  8.71e-07   erg/cm2
Peak flux       PL   7.17e-01  3.14e-01  8.20e-02  2.64e-02  1.13e+00  1.14e+00   ph/cm2/s
      90%_error_low -3.27e-01 -1.20e-01 -3.62e-02 -1.56e-02 -4.64e-01 -4.66e-01   ph/cm2/s
      90%_error_hi   3.39e-01  1.20e-01  3.52e-02  1.83e-02  4.67e-01  4.68e-01   ph/cm2/s

Fluence        CPL   3.59e-07  8.95e-07  1.14e-06  6.83e-07  2.85e-06  3.08e-06   erg/cm2
      90%_error_low -8.22e-08 -1.00e-07 -1.54e-07 -3.40e-07 -3.30e-07 -4.67e-07   erg/cm2
      90%_error_hi   8.55e-08  1.04e-07  1.55e-07  6.72e-07  3.36e-07  7.06e-07   erg/cm2
Peak flux      CPL   1.10e-01  7.48e-01  5.44e-01  1.30e-02  1.41e+00  1.42e+00   ph/cm2/s
      90%_error_low -1.10e-01 -3.67e-01 -2.03e-01 -8.22e-03 -4.53e-01 -4.55e-01   ph/cm2/s
      90%_error_hi   3.07e-01  3.11e-01  2.42e-01  9.43e-03  4.94e-01  4.93e-01   ph/cm2/s

======================================================================
Image
Pre-slew 15.0-350.0 keV image (Event data)
#   RAcent    DECcent   POSerr    Theta     Phi              Peak Cts       SNR   Name
   38.9954    55.2191   0.0178    46.9568   -41.1652         3.2013722     10.855 TRIG_01110821

Foreground time interval of the image:
-11.440  23.237 (delta_t =  34.677 [sec])
Background time interval of the image:
-62.763 -11.440 (delta_t =  51.323 [sec])
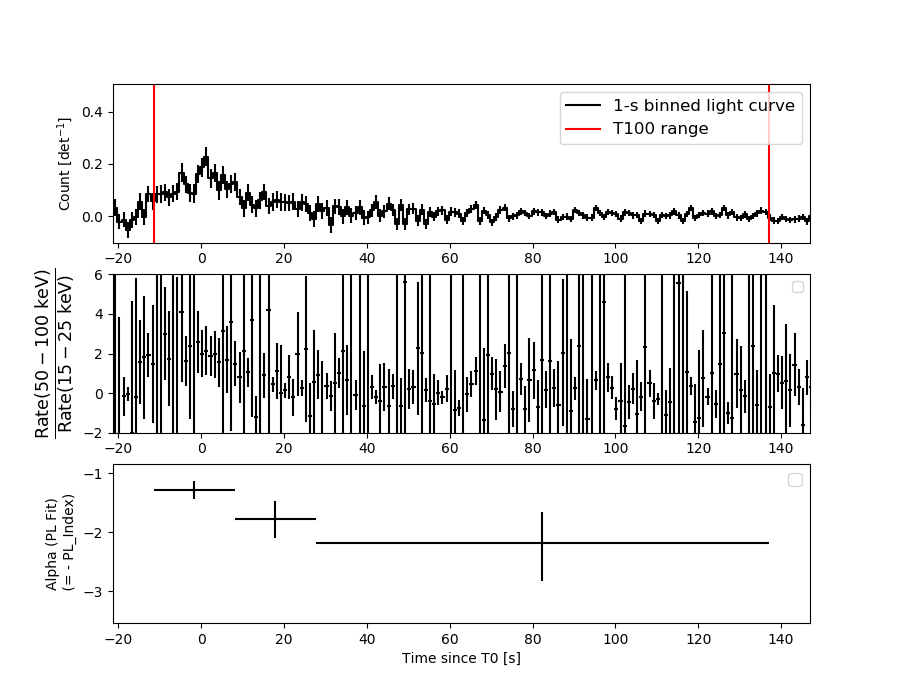
Light Curves
Note: The mask-weighted lightcurves have units of either count/det or counts/sec/det, where a det is 0.4 x 0.4 = 0.16 sq cm.
Full-time range; 1 s binning
Other quick-look light curves:
- 64 ms binning (zoomed)
- 16 ms binning (zoomed)
- 8 ms binning (zoomed)
- 2 ms binning (zoomed)
- SN=5 or 10 s binning (full-time range)
- Raw light curve
Spectra
- 64 ms binning (zoomed)
- 16 ms binning (zoomed)
- 8 ms binning (zoomed)
- 2 ms binning (zoomed)
- SN=5 or 10 s binning (full-time range)
- Raw light curve
Spectra
Notes:
- 1) The fitting includes the systematic errors.
- 2) When the burst includes telescope slew time periods, the fitting uses an average response file made from multiple 5-s response files through out the slew time plus single time preiod for the non-slew times, and weighted by the total counts in the corresponding time period using addrmf. An average response file is needed becuase a spectral fit using the pre-slew DRM will introduce some errors in both a spectral shape and a normalization if the PHA file contains a lot of the slew/post-slew time interval.
- 3) For fits to more complicated models (e.g. a power-law over a cutoff power-law), the BAT team has decided to require a chi-square improvement of more than 6 for each extra dof.
Time averaged spectrum fit using the average DRM
Power-law model
Time interval is from  -11.440 sec. to  136.976 sec.

Spectral model in power-law:
------------------------------------------------------------
Parameters  : value       lower 90%   higher 90%
Photon index: -1.58917     ( -0.155793   0.153745 )
Norm@50keV  : 2.19642E-03    ( -0.000216384   0.000215638 )
------------------------------------------------------------
#Fit statistic  : Chi-Squared                   59.90     using 59 bins.
 Reduced chi-squared = 1.05088
# Null hypothesis probability of 3.71e-01 with 57 degrees of freedom

Photon flux (15-150 keV)    in 148.4 sec: 0.281318 ( -0.027924  0.027992 ) ph/cm2/s
Energy fluence (15-150 keV)             : 3.05284e-06 ( -3.17296e-07  3.19131e-07 ) ergs/cm2
Cutoff power-law model
Time interval is from  -11.440 sec. to  136.976 sec.
Spectral model in the cutoff power-law:
------------------------------------------------------------
Parameters  : value       lower 90%   higher 90%
Photon index: -0.258573     ( -0.716323   0.849729 )
Epeak [keV] : 65.8238      ( -10.2078 21.7398 )
Norm@50keV  : 1.01878E-02    ( -0.00563827   0.0162795 )
------------------------------------------------------------
#Fit statistic  : Chi-Squared                   48.55     using 59 bins.
 Reduced chi-squared = 0.866964
# Null hypothesis probability of 7.50e-01 with 56 degrees of freedom

Photon flux (15-150 keV)    in 148.4 sec: 0.267571 ( -0.028754  0.028859 ) ph/cm2/s
Energy fluence (15-150 keV)             : 2.84823e-06 ( -3.30004e-07  3.36147e-07 ) ergs/cm2
1-s peak spectrum fit
Power-law model
Time interval is from    0.164 sec. to    1.164 sec.

Spectral model in power-law:
------------------------------------------------------------
Parameters  : value       lower 90%   higher 90%
Photon index: -2.93654     ( -0.452846   0.390674 )
Norm@50keV  : 4.29545E-03    ( -0.00171262   0.00168007 )
------------------------------------------------------------
#Fit statistic  : Chi-Squared                   88.69     using 59 bins.
 Reduced chi-squared = 1.55596
# Null hypothesis probability of 4.56e-03 with 57 degrees of freedom

Photon flux (15-150 keV)    in 1 sec: 1.12840 ( -0.464459  0.46694 ) ph/cm2/s
Energy fluence (15-150 keV)             : 5.01718e-08 ( -1.92026e-08  1.91963e-08 ) ergs/cm2
Cutoff power-law model
Time interval is from    0.164 sec. to    1.164 sec.
Spectral model in the cutoff power-law:
------------------------------------------------------------
Parameters  : value       lower 90%   higher 90%
Photon index: 5.7896     ( -3.42894   -5.81476 )
Epeak [keV] : 54.0048      ( -8.06338 8.99196 )
Norm@50keV  : 39.3406    ( -40.7605   1244.45 )
------------------------------------------------------------
#Fit statistic  : Chi-Squared                   64.62     using 59 bins.
 Reduced chi-squared = 1.15393
# Null hypothesis probability of 2.01e-01 with 56 degrees of freedom

Photon flux (15-150 keV)    in 1 sec: 1.41439 ( -0.453142  0.49429 ) ph/cm2/s
Energy fluence (15-150 keV)             : 1.07651e-07 ( -2.71391e-08  2.70963e-08 ) ergs/cm2
Time-resolved spectra
Distribution
T90 vs. Hardness ratio plot
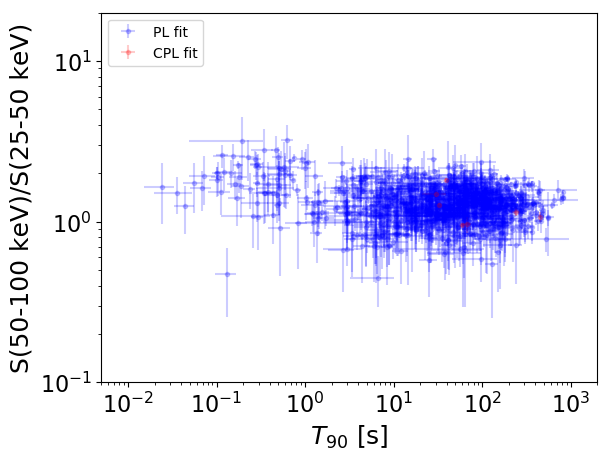
T90                                   = N/A sec.
Hardness ratio (energy fluence ratio) = N/A
S(15-50 keV) vs. S(50-150 keV) plot
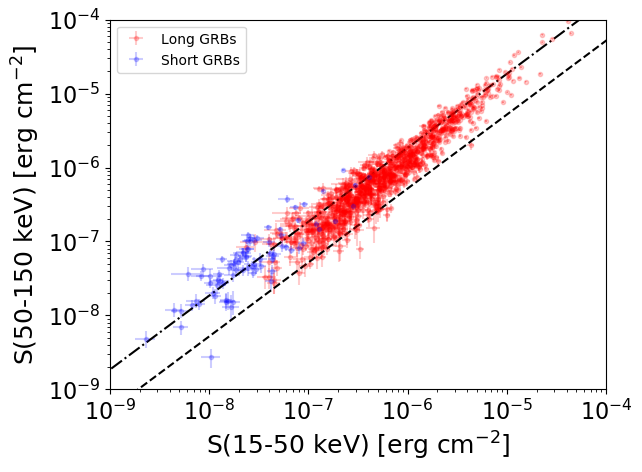
S(15-50 keV)  = N/A
S(50-150 keV) = N/A
The dash-dotted line and the dashed line traces the fluences calculated from the Band function with Epeak = 15 and 150 keV, respectively. Both lines assume a canonical values of alpha = -1 and beta = -2.5.
Mask shadow pattern
IMX = 8.060750188929401E-01, IMY = 7.048003004474200E-01
Spacecraft aspect plot
Bright source in the pre-burst/pre-slew/post-slew images
Pre-burst image of 15-350 keV band
Time interval of the image:
-62.763400 -11.440000

# RAcent  DECcent POSerr Theta    Phi  PeakCts   SNR AngSep     Name
#  [deg]    [deg]    ['] [deg]  [deg]                   [']
190.1226  31.4297    2.4  43.0  143.8   1.5817   4.9 ------	UNKNOWN
167.4409  15.4530    2.8  56.4  173.5   2.3103   4.1 ------	UNKNOWN
120.6038  29.0763    2.4  48.2 -129.3   2.3425   4.9 ------	UNKNOWN
Pre-slew background subtracted image of 15-350 keV band
Time interval of the image:
-11.440000 23.236590

# RAcent  DECcent POSerr Theta    Phi  PeakCts   SNR AngSep     Name
#  [deg]    [deg]    ['] [deg]  [deg]                   [']
242.0685  51.0539    1.9  39.4   77.0   2.2687   6.0 ------	UNKNOWN
 38.9954  55.2191    1.1  47.0  -41.2   3.2011  10.9 ------	UNKNOWN
Post-slew image of 15-350 keV band
Time interval of the image:
130.636590 648.936600

# RAcent  DECcent POSerr Theta    Phi  PeakCts   SNR AngSep     Name
#  [deg]    [deg]    ['] [deg]  [deg]                   [']
356.5595  17.2693    3.3  49.7   35.5   6.1608   3.5 ------	UNKNOWN
 32.0556   8.1828    2.5  47.3  -12.8   5.0651   4.6 ------	UNKNOWN
127.9007  49.7459    2.8  50.7 -145.5   8.4614   4.2 ------	UNKNOWN
 81.6598  27.8292    1.9  41.0  -88.1  18.4145   6.1 ------	UNKNOWN