Analysis Summary
Notes:
- 1) No attempt has been made to eliminate the non-significant decimal places.
- 2) This batgrbproduct analysis is done using the HEASARC data.
- 3) This batgrbproduct analysis is using the flight position for the mask-weighting calculation.
======================================================================
                  BAT GRB EVENT DATA PROCESSING REPORT
    Process Script Ver: batgrbproduct v2.48
    Process Start Time: Mon Oct 24 11:46:01 EDT 2022
             Host Name: batproc1
   Current Working Dir: /local/data/bat1/alien/Swift_3rdBATcatalog/event/batevent_reproc/trigger1111672
======================================================================

  Trigger: 01111672      Segment: 000

  BAT Trigger Time: 677660683.776   [s; MET]
      Trigger Stop: 677660684.8   [s; MET]
               UTC: 2022-06-23T07:04:14.406620    [includes UTCF correction]
       Where From?: TDRSS position message

  BAT
    RA: 145.462239057548   Dec: 75.8284740409551  [deg; J2000]

     Catalogged Source?: NO
     Point Source?:      YES
     GRB Indicated?:     YES    [ by BAT flight software ]
     Image S/N Ratio:    18.9
     Image Trigger?:     NO
     Rate S/N Ratio:     84.4985206971104  [ if not an image trigger ]
     Image S/N Ratio:    18.9

  Analysis Position:   [ source = BAT ]
    RA: 145.462239057548   Dec: 75.8284740409551  [deg; J2000]

  Refined Position:   [ source = BAT pre-slew burst ]
    RA: 145.468106578395   Dec: 75.82314777064  [deg; J2000]
        { 09h 41m 52.3s , +75d 49' 23.3" }
         +/- 0.844273294080949 [arcmin] (estimated 90% radius based on SNR)
         +/- 0.231031888495376 [arcmin] (formal 1-sigma fit error)
    SNR: 38.7384813716631

  Angular difference between the analysis and refined position is 0.330999 arcmin

  Partial Coding Fraction: 0.9453125    [ including projection effects ]

  Duration
     T90: 56.7959998846054 +/- 4.03039509147759
        Measured from: -3.26800000667572
                   to: 53.5279998779297     [s; relative to TRIGTIME]
     T50: 23.675999879837 +/- 4.52679852854081
        Measured from: 1.2960000038147
                   to: 24.9719998836517     [s; relative to TRIGTIME]


  Fluence
     Peak Flux  (peak 1 second)
        Measured from: -0.148000001907349
                   to: 0.851999998092651     [s; relative to TRIGTIME]
     Total Fluence
        Measured from: -3.84399998188019
                   to: 73.7919999361038     [s; relative to TRIGTIME]

             Band 1     Band 2     Band 3     Band 4
              15-25      25-50     50-100    100-350     keV
 Total     1.485779   1.976161   1.667865   0.483371
           0.058966   0.061473   0.055190   0.046972 [error]
 Peak      0.130012   0.204529   0.201120   0.090111
           0.008759   0.010652   0.010804   0.009081 [error]

     [ fluence units of on-axis counts / fully illuminated detector ]

======================================================================


====== Table of the duration information =============================

        Value   tstart    tstop
T100   77.636   -3.844   73.792
T90    56.796   -3.268   53.528
T50    23.676    1.296   24.972
Peak    1.000   -0.148    0.852


====== Spectral Analysis Summary =====================================

Model      : spectral model: simple power-law (PL) and cutoff power-law (CPL)
Ph_index   : photon index: E^{Ph_index}
Ph_90err   : 90% error of the photon index
Epeak      : Epeak in keV
Epeak_90err: 90% error of Epeak
Norm       : normalization at 50 keV in both the PL model and CPL model
Nomr_90err : 90% error of the normalization
chi2       : Chi-Squared
dof        : degree of freedo

=== Time-averaged spectral analysis ===
(Best model with acceptable fit: N/A)

Model Ph_index Ph_90err_low Ph_90err_hi  Epeak  Epeak_90err_low  Epeak_90err_hi  Norm       Nomr_90err_low    Norm_90err_hi    chi2    dof
PL      -1.342    -0.068      0.068       -           -               -         4.62e-03     -1.61e-04          1.61e-04      54.780   57
CPL     -1.342    -0.065      0.072     9999.360    -9999.360      -9999.360      4.63e-03     -1.53e-04          8.85e-04      54.830   56


=== 1-s peak spectral analysis ===
(Best model with acceptable fit: N/A)

Model Ph_index Ph_90err_low Ph_90err_hi  Epeak  Epeak_90err_low  Epeak_90err_hi  Norm       Nomr_90err_low    Norm_90err_hi    chi2    dof
PL      -1.047     -0.103     0.104       -           -               -         3.89e-02     -2.12e-03          2.12e-03      90.080   57
CPL     -1.043     -0.103     0.106     9999.010    -9999.010      -9999.010      3.92e-02     -2.13e-03          7.38e-03      90.190   56


=== Fluence/Peak Flux Summary ===

              Model    Band1     Band2     Band3     Band4     Band5     Total
                       15-25     25-50    50-100    100-350    15-150    15-350    keV
Fluence         PL   3.95e-07  8.00e-07  1.26e-06  4.41e-06  3.51e-06  6.86e-06   erg/cm2
      90%_error_low -2.79e-08 -3.25e-08 -5.53e-08 -4.37e-07 -1.35e-07 -4.68e-07   erg/cm2
      90%_error_hi   2.87e-08  3.23e-08  5.51e-08  4.71e-07  1.36e-07  4.97e-07   erg/cm2
Peak flux       PL   1.04e+00  1.37e+00  1.33e+00  2.29e+00  4.50e+00  6.03e+00   ph/cm2/s
      90%_error_low -1.15e-01 -9.00e-02 -8.68e-02 -3.20e-01 -2.47e-01 -3.83e-01   ph/cm2/s
      90%_error_hi   1.19e-01  8.90e-02  8.60e-02  3.53e-01  2.47e-01  3.94e-01   ph/cm2/s

Fluence        CPL   3.95e-07  7.95e-07  1.25e-06  4.51e-06  3.53e-06  6.84e-06   erg/cm2
      90%_error_low    N/A       N/A       N/A    -1.17e-06    N/A    -9.71e-07   erg/cm2
      90%_error_hi     N/A       N/A       N/A     -6.75e-08    N/A     2.56e-07   erg/cm2
Peak flux      CPL   1.04e+00  1.37e+00  1.33e+00  2.52e+00  4.50e+00  6.05e+00   ph/cm2/s
      90%_error_low -1.15e-01 -9.02e-02 -8.70e-02     N/A   -2.45e-01 -4.73e-01   ph/cm2/s
      90%_error_hi   1.19e-01  8.88e-02  8.61e-02     N/A    2.47e-01  3.44e-01   ph/cm2/s

======================================================================
Image
Pre-slew 15.0-350.0 keV image (Event data)
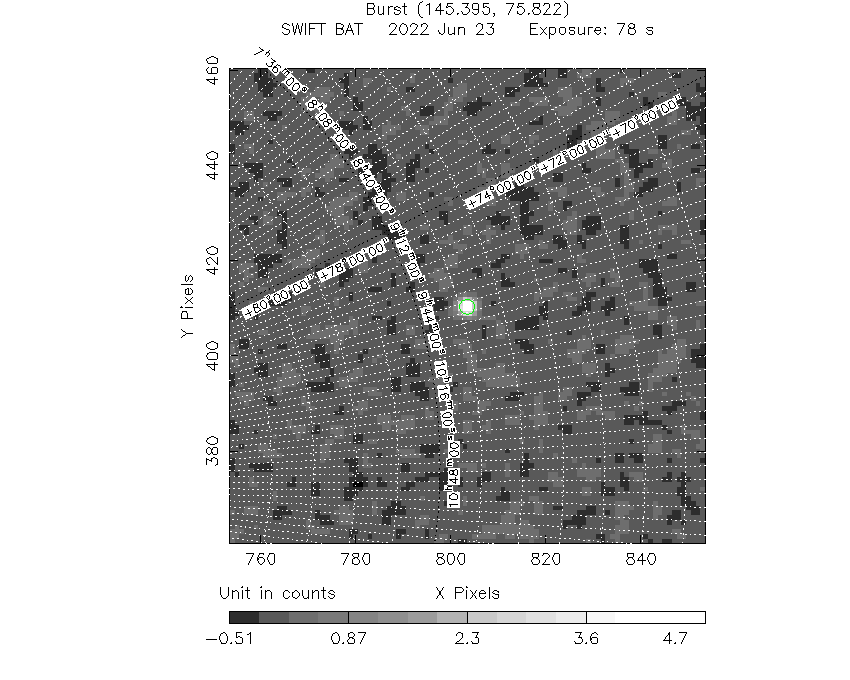
#   RAcent    DECcent   POSerr    Theta     Phi              Peak Cts       SNR   Name
  145.4681    75.8231   0.0050    11.9844    41.0101         5.5486797     38.738 TRIG_01111672

Foreground time interval of the image:
 -3.844  73.792 (delta_t =  77.636 [sec])
Background time interval of the image:
-293.776  -3.844 (delta_t = 289.932 [sec])
Light Curves
Note: The mask-weighted lightcurves have units of either count/det or counts/sec/det, where a det is 0.4 x 0.4 = 0.16 sq cm.
Full-time range; 1 s binning
Other quick-look light curves:
- 64 ms binning (zoomed)
- 16 ms binning (zoomed)
- 8 ms binning (zoomed)
- 2 ms binning (zoomed)
- SN=5 or 10 s binning (full-time range)
- Raw light curve
Spectra
- 64 ms binning (zoomed)
- 16 ms binning (zoomed)
- 8 ms binning (zoomed)
- 2 ms binning (zoomed)
- SN=5 or 10 s binning (full-time range)
- Raw light curve
Spectra
Notes:
- 1) The fitting includes the systematic errors.
- 2) When the burst includes telescope slew time periods, the fitting uses an average response file made from multiple 5-s response files through out the slew time plus single time preiod for the non-slew times, and weighted by the total counts in the corresponding time period using addrmf. An average response file is needed becuase a spectral fit using the pre-slew DRM will introduce some errors in both a spectral shape and a normalization if the PHA file contains a lot of the slew/post-slew time interval.
- 3) For fits to more complicated models (e.g. a power-law over a cutoff power-law), the BAT team has decided to require a chi-square improvement of more than 6 for each extra dof.
Time averaged spectrum fit using the average DRM
Power-law model

Time interval is from   -3.844 sec. to   73.792 sec.

Spectral model in power-law:
------------------------------------------------------------
Parameters  : value       lower 90%   higher 90%
Photon index: -1.34235     ( -0.0681622   0.0682466 )
Norm@50keV  : 4.61898E-03    ( -0.000160989   0.000160979 )
------------------------------------------------------------
#Fit statistic  : Chi-Squared                   54.78     using 59 bins.
 Reduced chi-squared = 0.961053
# Null hypothesis probability of 5.59e-01 with 57 degrees of freedom

Photon flux (15-150 keV)    in 77.64 sec: 0.555593 ( -0.020577  0.020645 ) ph/cm2/s
Energy fluence (15-150 keV)             : 3.50902e-06 ( -1.3517e-07  1.3563e-07 ) ergs/cm2
Cutoff power-law model
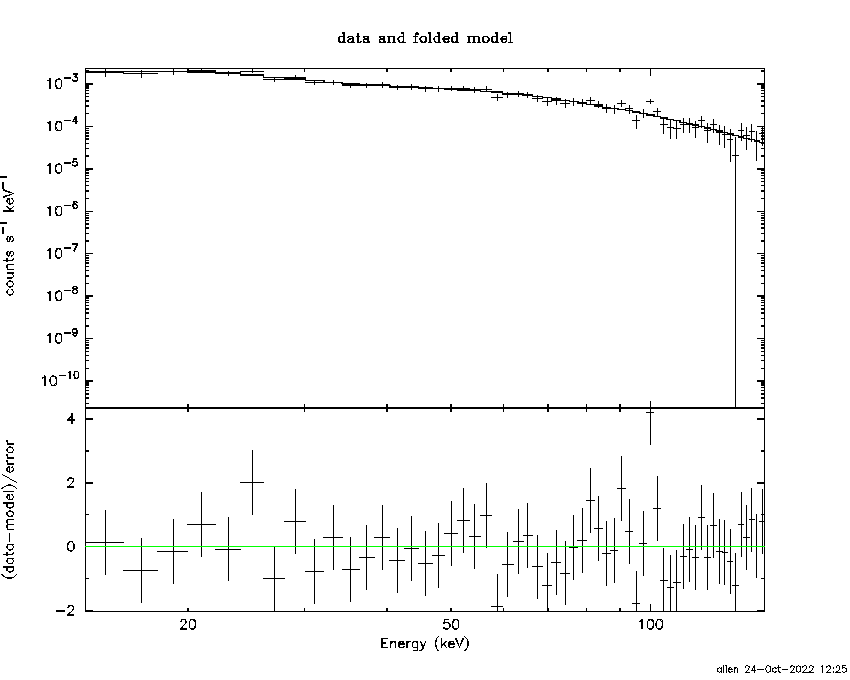
Time interval is from   -3.844 sec. to   73.792 sec.
Spectral model in the cutoff power-law:
------------------------------------------------------------
Parameters  : value       lower 90%   higher 90%
Photon index: -1.34232     ( -0.0663264   0.0713049 )
Epeak [keV] : 9999.36      ( -9999.36 -9999.36 )
Norm@50keV  : 4.62836E-03    ( -0.000161484   0.000876617 )
------------------------------------------------------------
#Fit statistic  : Chi-Squared                   54.83     using 59 bins.
 Reduced chi-squared = 0.979107
# Null hypothesis probability of 5.19e-01 with 56 degrees of freedom

Photon flux (15-150 keV)    in 77.64 sec: 0.559488 (    ) ph/cm2/s
Energy fluence (15-150 keV)             : 3.5309e-06 ( 0  0 ) ergs/cm2
1-s peak spectrum fit
Power-law model
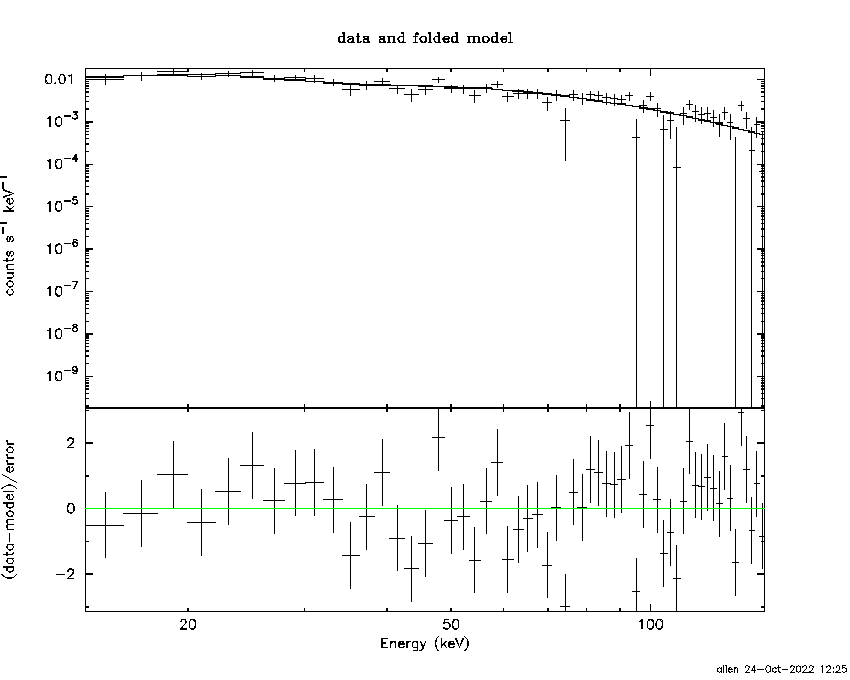
Time interval is from   -0.148 sec. to    0.852 sec.

Spectral model in power-law:
------------------------------------------------------------
Parameters  : value       lower 90%   higher 90%
Photon index: -1.04678     ( -0.103454   0.104253 )
Norm@50keV  : 3.89449E-02    ( -0.00211571   0.00211571 )
------------------------------------------------------------
#Fit statistic  : Chi-Squared                   90.08     using 59 bins.
 Reduced chi-squared = 1.58035
# Null hypothesis probability of 3.42e-03 with 57 degrees of freedom

Photon flux (15-150 keV)    in 1 sec: 4.49692 ( -0.24657  0.24672 ) ph/cm2/s
Energy fluence (15-150 keV)             : 4.1441e-07 ( -2.66973e-08  2.6886e-08 ) ergs/cm2
Cutoff power-law model

Time interval is from   -0.148 sec. to    0.852 sec.
Spectral model in the cutoff power-law:
------------------------------------------------------------
Parameters  : value       lower 90%   higher 90%
Photon index: -1.04257     ( -0.103477   0.105644 )
Epeak [keV] : 9999.01      ( -9999.09 -9999.09 )
Norm@50keV  : 3.91646E-02    ( -0.00212788   0.00738342 )
------------------------------------------------------------
#Fit statistic  : Chi-Squared                   90.19     using 59 bins.
 Reduced chi-squared = 1.61054
# Null hypothesis probability of 2.56e-03 with 56 degrees of freedom

Photon flux (15-150 keV)    in 1 sec: 4.49570 ( -0.24479  0.24663 ) ph/cm2/s
Energy fluence (15-150 keV)             : 4.14171e-07 ( -2.67082e-08  2.68812e-08 ) ergs/cm2
Time-resolved spectra

Distribution
T90 vs. Hardness ratio plot
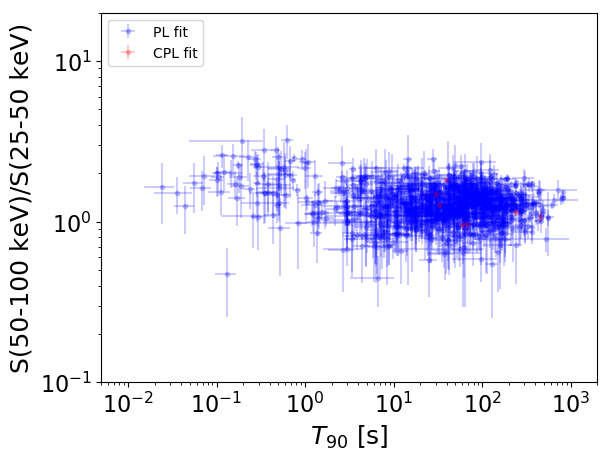
T90                                   = N/A sec.
Hardness ratio (energy fluence ratio) = N/A
S(15-50 keV) vs. S(50-150 keV) plot

S(15-50 keV)  = N/A
S(50-150 keV) = N/A
The dash-dotted line and the dashed line traces the fluences calculated from the Band function with Epeak = 15 and 150 keV, respectively. Both lines assume a canonical values of alpha = -1 and beta = -2.5.
Mask shadow pattern
IMX = 1.601788840656498E-01, IMY = -1.392908094200087E-01
Spacecraft aspect plot

Bright source in the pre-burst/pre-slew/post-slew images
Pre-burst image of 15-350 keV band
Time interval of the image:
-293.776000 -3.844000

# RAcent  DECcent POSerr Theta    Phi  PeakCts   SNR AngSep     Name
#  [deg]    [deg]    ['] [deg]  [deg]                   [']
154.5756  79.3917    3.6  16.0   40.9   1.2796   3.2 ------	UNKNOWN
122.1411  22.9811    3.6  42.2 -136.8   2.1218   3.2 ------	UNKNOWN
Pre-slew background subtracted image of 15-350 keV band
Time interval of the image:
-3.844000 73.792000

# RAcent  DECcent POSerr Theta    Phi  PeakCts   SNR AngSep     Name
#  [deg]    [deg]    ['] [deg]  [deg]                   [']
145.4681  75.8232    0.3  12.0   41.0   5.5487  38.7 ------	UNKNOWN
 54.6769  59.6121    2.3  35.0  -32.9   0.8401   5.0 ------	UNKNOWN
 37.1205  43.0816    2.7  54.6  -35.7   3.1410   4.3 ------	UNKNOWN
Post-slew image of 15-350 keV band
Time interval of the image:
260.924600 618.124680

# RAcent  DECcent POSerr Theta    Phi  PeakCts   SNR AngSep     Name
#  [deg]    [deg]    ['] [deg]  [deg]                   [']
135.5777 -40.5553    2.6  48.7  166.2   7.5090   4.5    2.2	Vela X-1
120.7138 -14.3022    2.1  35.3 -154.0   3.2866   5.5 ------	UNKNOWN
119.8316  43.9287    2.3  45.6  -57.8  10.9346   5.0 ------	UNKNOWN