Analysis Summary
Notes:
- 1) No attempt has been made to eliminate the non-significant decimal places.
- 2) This batgrbproduct analysis is done using the HEASARC data.
- 3) This batgrbproduct analysis is using the flight position for the mask-weighting calculation.
======================================================================
                  BAT GRB EVENT DATA PROCESSING REPORT
    Process Script Ver: batgrbproduct v2.48
    Process Start Time: Mon Oct 24 11:44:18 EDT 2022
             Host Name: batproc1
   Current Working Dir: /local/data/bat1/alien/Swift_3rdBATcatalog/event/batevent_reproc/trigger1114034
======================================================================

  Trigger: 01114034      Segment: 000

  BAT Trigger Time: 678344007.488   [s; MET]
      Trigger Stop: 678344023.872   [s; MET]
               UTC: 2022-07-01T04:52:58.072320    [includes UTCF correction]
       Where From?: TDRSS position message

  BAT
    RA: 242.477608992064   Dec: 55.4205425555552  [deg; J2000]

     Catalogged Source?: NO
     Point Source?:      YES
     GRB Indicated?:     YES    [ by BAT flight software ]
     Image S/N Ratio:    7.65
     Image Trigger?:     NO
     Rate S/N Ratio:     9.16515138991168  [ if not an image trigger ]
     Image S/N Ratio:    7.65

  Analysis Position:   [ source = BAT ]
    RA: 242.477608992064   Dec: 55.4205425555552  [deg; J2000]

  Refined Position:   [ source = BAT pre-slew burst ]
    RA: 242.491688726922   Dec: 55.4244800054922  [deg; J2000]
        { 16h 09m 58.0s , +55d 25' 28.1" }
         +/- 2.3503246957243 [arcmin] (estimated 90% radius based on SNR)
         +/- 1.29577167754501 [arcmin] (formal 1-sigma fit error)
    SNR: 8.97295970113962

  Angular difference between the analysis and refined position is 0.534479 arcmin

  Partial Coding Fraction: 0.5625    [ including projection effects ]

  Duration
     T90: 13.5239999294281 +/- 2.59655303048218
        Measured from: -0.652000069618225
                   to: 12.8719998598099     [s; relative to TRIGTIME]
     T50: 8.06400001049042 +/- 3.1842111039291
        Measured from: 1.48799991607666
                   to: 9.55199992656708     [s; relative to TRIGTIME]


  Fluence
     Peak Flux  (peak 1 second)
        Measured from: 3.64800000190735
                   to: 4.64800000190735     [s; relative to TRIGTIME]
     Total Fluence
        Measured from: -1.39600002765656
                   to: 13.4399999380112     [s; relative to TRIGTIME]

             Band 1     Band 2     Band 3     Band 4
              15-25      25-50     50-100    100-350     keV
 Total     0.111188   0.178439   0.155081   0.044333
           0.030404   0.031479   0.027352   0.023385 [error]
 Peak      0.024393   0.040879   0.014216  -0.001660
           0.008070   0.008398   0.007427   0.005705 [error]

     [ fluence units of on-axis counts / fully illuminated detector ]

======================================================================


====== Table of the duration information =============================

        Value   tstart    tstop
T100   14.836   -1.396   13.440
T90    13.524   -0.652   12.872
T50     8.064    1.488    9.552
Peak    1.000    3.648    4.648


====== Spectral Analysis Summary =====================================

Model      : spectral model: simple power-law (PL) and cutoff power-law (CPL)
Ph_index   : photon index: E^{Ph_index}
Ph_90err   : 90% error of the photon index
Epeak      : Epeak in keV
Epeak_90err: 90% error of Epeak
Norm       : normalization at 50 keV in both the PL model and CPL model
Nomr_90err : 90% error of the normalization
chi2       : Chi-Squared
dof        : degree of freedo

=== Time-averaged spectral analysis ===
(Best model with acceptable fit: N/A)

Model Ph_index Ph_90err_low Ph_90err_hi  Epeak  Epeak_90err_low  Epeak_90err_hi  Norm       Nomr_90err_low    Norm_90err_hi    chi2    dof
PL      -1.520    -0.308      0.303       -           -               -         2.07e-03     -4.16e-04          4.14e-04      64.020   57
CPL      0.690    -1.630      2.518       58.480     -11.867        35.071      2.85e-02     -2.85e-02          5.04e-01      58.060   56


=== 1-s peak spectral analysis ===
(Best model with acceptable fit: N/A)

Model Ph_index Ph_90err_low Ph_90err_hi  Epeak  Epeak_90err_low  Epeak_90err_hi  Norm       Nomr_90err_low    Norm_90err_hi    chi2    dof
PL      -2.327     -0.655     0.510       -           -               -         4.16e-03     -1.83e-03          1.78e-03      51.880   57
CPL     -0.586     -1.505     6.171       29.977     -24.161       -29.977      4.97e-02     -4.97e-02          5.78e+02      50.600   56


=== Fluence/Peak Flux Summary ===

              Model    Band1     Band2     Band3     Band4     Band5     Total
                       15-25     25-50    50-100    100-350    15-150    15-350    keV
Fluence         PL   4.00e-08  7.26e-08  1.01e-07  2.95e-07  2.91e-07  5.09e-07   erg/cm2
      90%_error_low -1.20e-08 -1.50e-08 -2.49e-08 -1.24e-07 -6.18e-08 -1.52e-07   erg/cm2
      90%_error_hi   1.29e-08  1.48e-08  2.49e-08  1.71e-07  6.26e-08  1.88e-07   erg/cm2
Peak flux       PL   3.81e-01  2.37e-01  9.43e-02  5.07e-02  7.38e-01  7.63e-01   ph/cm2/s
      90%_error_low -1.31e-01 -7.39e-02 -4.97e-02 -5.07e-02 -2.10e-01 -2.20e-01   ph/cm2/s
      90%_error_hi   1.36e-01  7.14e-02  5.57e-02  6.85e-02  2.10e-01  2.21e-01   ph/cm2/s

Fluence        CPL   2.84e-08  9.01e-08  1.09e-07  3.38e-08  2.55e-07  2.61e-07   erg/cm2
      90%_error_low -1.39e-08 -2.03e-08 -3.37e-08 -2.82e-08 -6.06e-08 -6.60e-08   erg/cm2
      90%_error_hi   1.53e-08  2.16e-08  3.20e-08  1.08e-07  6.62e-08  1.15e-07   erg/cm2
Peak flux      CPL   3.46e-01  2.89e-01  7.81e-02  5.10e-03  7.18e-01  7.18e-01   ph/cm2/s
      90%_error_low -1.56e-01 -1.02e-01 -6.43e-02 -5.10e-03 -2.09e-01 -2.10e-01   ph/cm2/s
      90%_error_hi   1.50e-01  1.15e-01  6.97e-02  9.84e-02  2.10e-01  2.13e-01   ph/cm2/s

======================================================================
Image
Pre-slew 15.0-350.0 keV image (Event data)
#   RAcent    DECcent   POSerr    Theta     Phi              Peak Cts       SNR   Name
  242.4917    55.4245   0.0215    38.4841     1.7476         0.5240009      8.973 TRIG_01114034

Foreground time interval of the image:
 -1.396  13.440 (delta_t =  14.836 [sec])
Background time interval of the image:
-239.488  -1.396 (delta_t = 238.092 [sec])
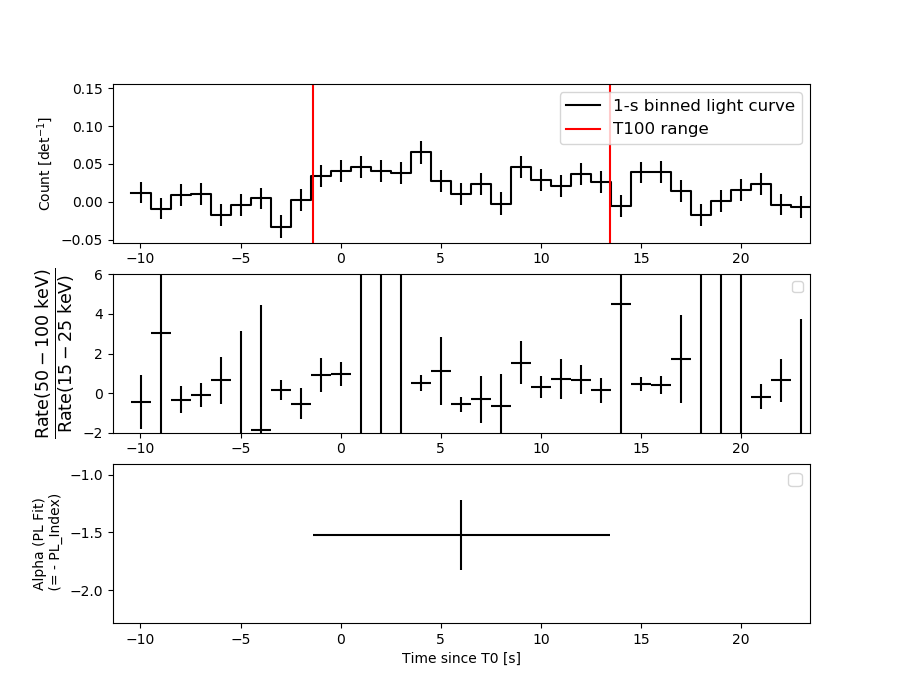
Light Curves
Note: The mask-weighted lightcurves have units of either count/det or counts/sec/det, where a det is 0.4 x 0.4 = 0.16 sq cm.
Full-time range; 1 s binning
Other quick-look light curves:
- 64 ms binning (zoomed)
- 16 ms binning (zoomed)
- 8 ms binning (zoomed)
- 2 ms binning (zoomed)
- SN=5 or 10 s binning (full-time range)
- Raw light curve
Spectra
- 64 ms binning (zoomed)
- 16 ms binning (zoomed)
- 8 ms binning (zoomed)
- 2 ms binning (zoomed)
- SN=5 or 10 s binning (full-time range)
- Raw light curve
Spectra
Notes:
- 1) The fitting includes the systematic errors.
- 2) When the burst includes telescope slew time periods, the fitting uses an average response file made from multiple 5-s response files through out the slew time plus single time preiod for the non-slew times, and weighted by the total counts in the corresponding time period using addrmf. An average response file is needed becuase a spectral fit using the pre-slew DRM will introduce some errors in both a spectral shape and a normalization if the PHA file contains a lot of the slew/post-slew time interval.
- 3) For fits to more complicated models (e.g. a power-law over a cutoff power-law), the BAT team has decided to require a chi-square improvement of more than 6 for each extra dof.
Time averaged spectrum fit using the average DRM
Power-law model
Time interval is from   -1.396 sec. to   13.440 sec.

Spectral model in power-law:
------------------------------------------------------------
Parameters  : value       lower 90%   higher 90%
Photon index: -1.52013     ( -0.3074   0.303699 )
Norm@50keV  : 2.07128E-03    ( -0.000416308   0.000414253 )
------------------------------------------------------------
#Fit statistic  : Chi-Squared                   64.02     using 59 bins.
 Reduced chi-squared = 1.12316
# Null hypothesis probability of 2.44e-01 with 57 degrees of freedom

Photon flux (15-150 keV)    in 14.84 sec: 0.260015 ( -0.052246  0.052444 ) ph/cm2/s
Energy fluence (15-150 keV)             : 2.90686e-07 ( -6.18027e-08  6.26468e-08 ) ergs/cm2
Cutoff power-law model
Time interval is from   -1.396 sec. to   13.440 sec.
Spectral model in the cutoff power-law:
------------------------------------------------------------
Parameters  : value       lower 90%   higher 90%
Photon index: 0.690416     ( -1.63425   2.51423 )
Epeak [keV] : 58.4797      ( -11.8336 35.1042 )
Norm@50keV  : 2.85500E-02    ( -0.0287389   0.503946 )
------------------------------------------------------------
#Fit statistic  : Chi-Squared                   58.06     using 59 bins.
 Reduced chi-squared = 1.03679
# Null hypothesis probability of 3.99e-01 with 56 degrees of freedom

Photon flux (15-150 keV)    in 14.84 sec: 0.242581 ( -0.053301  0.053921 ) ph/cm2/s
Energy fluence (15-150 keV)             : 2.55478e-07 ( -6.0604e-08  6.62241e-08 ) ergs/cm2
1-s peak spectrum fit
Power-law model
Time interval is from    3.648 sec. to    4.648 sec.

Spectral model in power-law:
------------------------------------------------------------
Parameters  : value       lower 90%   higher 90%
Photon index: -2.32697     ( -0.654947   0.509862 )
Norm@50keV  : 4.16071E-03    ( -0.00183452   0.00177711 )
------------------------------------------------------------
#Fit statistic  : Chi-Squared                   51.88     using 59 bins.
 Reduced chi-squared = 0.910175
# Null hypothesis probability of 6.67e-01 with 57 degrees of freedom

Photon flux (15-150 keV)    in 1 sec: 0.738301 ( -0.209706  0.209764 ) ph/cm2/s
Energy fluence (15-150 keV)             : 3.99742e-08 ( -1.38496e-08  1.48964e-08 ) ergs/cm2
Cutoff power-law model
Time interval is from    3.648 sec. to    4.648 sec.
Spectral model in the cutoff power-law:
------------------------------------------------------------
Parameters  : value       lower 90%   higher 90%
Photon index: -0.586452     ( -1.57018   6.10634 )
Epeak [keV] : 29.9766      ( -24.4245 -30.2398 )
Norm@50keV  : 4.97447E-02    ( -0.0591161   578.419 )
------------------------------------------------------------
#Fit statistic  : Chi-Squared                   50.60     using 59 bins.
 Reduced chi-squared = 0.903571
# Null hypothesis probability of 6.79e-01 with 56 degrees of freedom

Photon flux (15-150 keV)    in 1 sec: 0.717741 ( -0.209156  0.210458 ) ph/cm2/s
Energy fluence (15-150 keV)             : 3.55672e-08 ( -1.21109e-08  1.56741e-08 ) ergs/cm2
Time-resolved spectra
Distribution
T90 vs. Hardness ratio plot
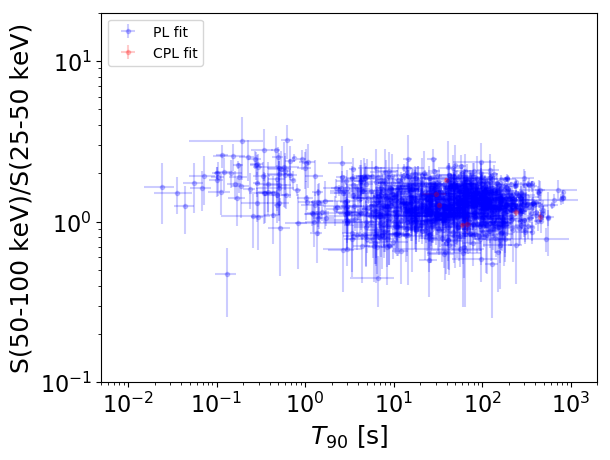
T90                                   = N/A sec.
Hardness ratio (energy fluence ratio) = N/A
S(15-50 keV) vs. S(50-150 keV) plot
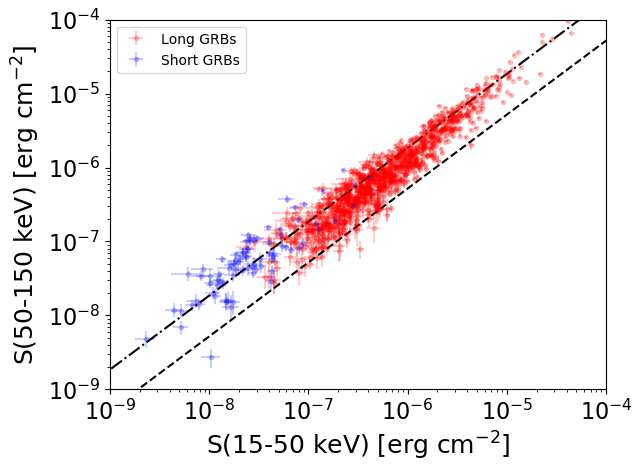
S(15-50 keV)  = N/A
S(50-150 keV) = N/A
The dash-dotted line and the dashed line traces the fluences calculated from the Band function with Epeak = 15 and 150 keV, respectively. Both lines assume a canonical values of alpha = -1 and beta = -2.5.
Mask shadow pattern
IMX = 7.946120681721145E-01, IMY = -2.424431433485136E-02
Spacecraft aspect plot
Bright source in the pre-burst/pre-slew/post-slew images
Pre-burst image of 15-350 keV band
Time interval of the image:
-239.488000 -1.396000

# RAcent  DECcent POSerr Theta    Phi  PeakCts   SNR AngSep     Name
#  [deg]    [deg]    ['] [deg]  [deg]                   [']
254.4201  35.4863    7.6  41.0   35.5   0.7528   1.5    8.8	Her X-1
184.9840 -26.0978    2.2  56.9  173.9   6.1617   5.2 ------	UNKNOWN
183.8276  -4.7645    2.7  38.7 -170.8   1.7377   4.2 ------	UNKNOWN
196.5479  25.4191    3.2   9.6 -124.7   1.0423   3.6 ------	UNKNOWN
158.7357   7.6523    2.0  49.7 -133.3   8.2138   5.8 ------	UNKNOWN
159.6582  25.9710    2.3  42.4 -109.8   5.6982   5.0 ------	UNKNOWN
Pre-slew background subtracted image of 15-350 keV band
Time interval of the image:
-1.396000 13.440000

# RAcent  DECcent POSerr Theta    Phi  PeakCts   SNR AngSep     Name
#  [deg]    [deg]    ['] [deg]  [deg]                   [']
254.4825  35.2091    4.8  41.1   35.9  -0.2196  -2.4    8.1	Her X-1
268.5041  39.4776    2.8  52.0   29.2   0.9189   4.1 ------	UNKNOWN
242.4918  55.4245    1.3  38.5    1.7   0.5243   9.0 ------	UNKNOWN
196.1569  23.6315    2.1  10.4 -134.1   0.1996   5.4 ------	UNKNOWN
177.1081 -18.7075    2.7  53.9 -174.0   0.5346   4.3 ------	UNKNOWN
265.8274  70.6619    2.1  54.8   -9.8   0.7425   5.5 ------	UNKNOWN
158.6717   7.8605    2.6  49.6 -133.0   0.8677   4.5 ------	UNKNOWN
Post-slew image of 15-350 keV band
Time interval of the image:
154.012600 962.565600

# RAcent  DECcent POSerr Theta    Phi  PeakCts   SNR AngSep     Name
#  [deg]    [deg]    ['] [deg]  [deg]                   [']
254.4411  35.3305    6.3  21.7   97.3   2.3763   1.8    1.1	Her X-1
299.5707  35.1736    0.8  43.4   37.8  27.1730  15.3    1.9	Cyg X-1
308.2018  41.0008    4.5  44.3   24.9   4.4194   2.6    5.1	Cyg X-3
268.4406  62.3725    3.0  15.0   -3.6   3.4436   3.9 ------	UNKNOWN
169.5852  39.4267    2.3  49.3 -132.2  24.1486   5.1 ------	UNKNOWN