Analysis Summary
Notes:
- 1) No attempt has been made to eliminate the non-significant decimal places.
- 2) This batgrbproduct analysis is done using the HEASARC data.
- 3) This batgrbproduct analysis is using the flight position for the mask-weighting calculation.
======================================================================
BAT GRB EVENT DATA PROCESSING REPORT
Process Script Ver: batgrbproduct v2.48
Process Start Time: Mon Oct 24 11:42:09 EDT 2022
Host Name: batproc1
Current Working Dir: /local/data/bat1/alien/Swift_3rdBATcatalog/event/batevent_reproc/trigger1114937
======================================================================
Trigger: 01114937 Segment: 000
BAT Trigger Time: 678816583.744 [s; MET]
Trigger Stop: 678816585.792 [s; MET]
UTC: 2022-07-06T16:09:14.296300 [includes UTCF correction]
Where From?: TDRSS position message
BAT
RA: 0.586794992558329 Dec: -16.3913692713963 [deg; J2000]
Catalogged Source?: NO
Point Source?: YES
GRB Indicated?: YES [ by BAT flight software ]
Image S/N Ratio: 8.84
Image Trigger?: NO
Rate S/N Ratio: 11.6189500386223 [ if not an image trigger ]
Image S/N Ratio: 8.84
Analysis Position: [ source = BAT ]
RA: 0.586794992558329 Dec: -16.3913692713963 [deg; J2000]
Refined Position: [ source = BAT pre-slew burst ]
RA: 0.576635887418828 Dec: -16.4099403096171 [deg; J2000]
{ 00h 02m 18.4s , -16d 24' 35.8" }
+/- 1.83874457719802 [arcmin] (estimated 90% radius based on SNR)
+/- 0.69680251666877 [arcmin] (formal 1-sigma fit error)
SNR: 12.7417963243122
Angular difference between the analysis and refined position is 1.258374 arcmin
Partial Coding Fraction: 0.7421875 [ including projection effects ]
Duration
T90: 85.9960000514984 +/- 18.3338030110254
Measured from: -55.3880000114441
to: 30.6080000400543 [s; relative to TRIGTIME]
T50: 24.4279999732971 +/- 10.183611313527
Measured from: -12.055999994278
to: 12.3719999790192 [s; relative to TRIGTIME]
Fluence
Peak Flux (peak 1 second)
Measured from: 3.72400009632111
to: 4.72400009632111 [s; relative to TRIGTIME]
Total Fluence
Measured from: -71.039999961853
to: 36.0360000133514 [s; relative to TRIGTIME]
Band 1 Band 2 Band 3 Band 4
15-25 25-50 50-100 100-350 keV
Total 0.786151 0.922146 0.528778 0.226466
0.067553 0.069822 0.062252 0.058334 [error]
Peak 0.029890 0.050888 0.025863 0.013277
0.006969 0.007331 0.006415 0.005816 [error]
[ fluence units of on-axis counts / fully illuminated detector ]
======================================================================
====== Table of the duration information =============================
Value tstart tstop
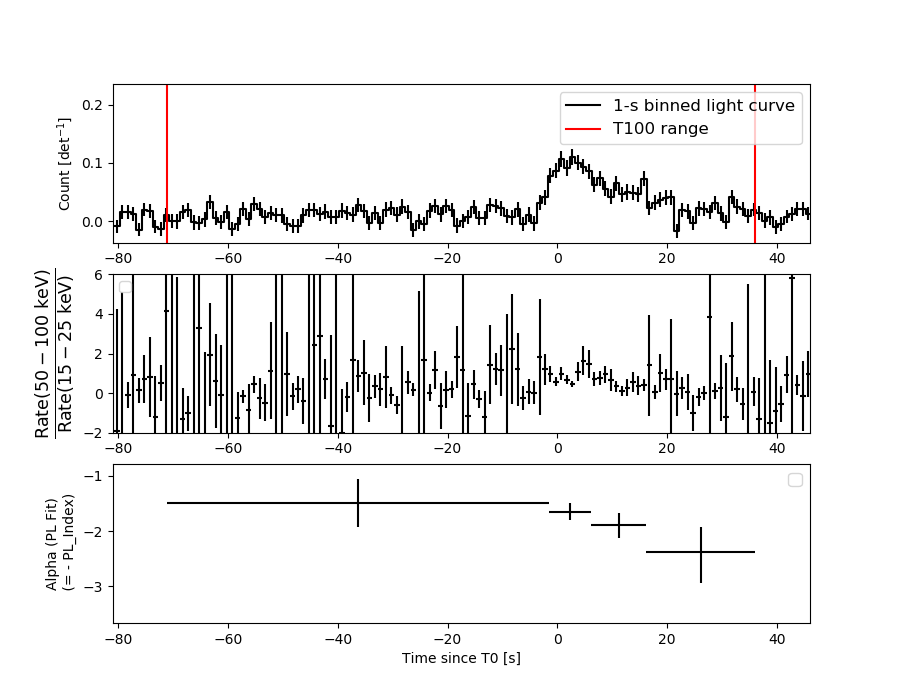
T100 107.076 -71.040 36.036
T90 85.996 -55.388 30.608
T50 24.428 -12.056 12.372
Peak 1.000 3.724 4.724
====== Spectral Analysis Summary =====================================
Model : spectral model: simple power-law (PL) and cutoff power-law (CPL)
Ph_index : photon index: E^{Ph_index}
Ph_90err : 90% error of the photon index
Epeak : Epeak in keV
Epeak_90err: 90% error of Epeak
Norm : normalization at 50 keV in both the PL model and CPL model
Nomr_90err : 90% error of the normalization
chi2 : Chi-Squared
dof : degree of freedo
=== Time-averaged spectral analysis ===
(Best model with acceptable fit: N/A)
Model Ph_index Ph_90err_low Ph_90err_hi Epeak Epeak_90err_low Epeak_90err_hi Norm Nomr_90err_low Norm_90err_hi chi2 dof
PL -1.757 -0.176 0.171 - - - 1.36e-03 -1.40e-04 1.37e-04 41.570 57
CPL -1.757 -0.176 0.307 9999.350 -9999.340 -9999.350 1.36e-03 -9.16e-04 1.21e-03 41.570 56
=== 1-s peak spectral analysis ===
(Best model with acceptable fit: N/A)
Model Ph_index Ph_90err_low Ph_90err_hi Epeak Epeak_90err_low Epeak_90err_hi Norm Nomr_90err_low Norm_90err_hi chi2 dof
PL -1.632 -0.351 0.340 - - - 6.98e-03 -1.49e-03 1.44e-03 68.890 57
CPL -1.644 -0.341 0.599 9999.360 -9999.350 -9999.360 6.93e-03 -1.45e-03 2.91e-02 68.890 56
=== Fluence/Peak Flux Summary ===
Model Band1 Band2 Band3 Band4 Band5 Total
15-25 25-50 50-100 100-350 15-150 15-350 keV
Fluence PL 2.36e-07 3.72e-07 4.40e-07 1.01e-06 1.34e-06 2.06e-06 erg/cm2
90%_error_low -3.28e-08 -3.26e-08 -6.28e-08 -2.71e-07 -1.42e-07 -3.34e-07 erg/cm2
90%_error_hi 3.39e-08 3.27e-08 6.32e-08 3.34e-07 1.45e-07 3.85e-07 erg/cm2
Peak flux PL 3.26e-01 3.03e-01 1.96e-01 1.95e-01 9.06e-01 1.02e+00 ph/cm2/s
90%_error_low -9.40e-02 -5.76e-02 -5.39e-02 -8.89e-02 -1.69e-01 -1.97e-01 ph/cm2/s
90%_error_hi 9.88e-02 5.73e-02 5.40e-02 1.28e-01 1.70e-01 2.00e-01 ph/cm2/s
Fluence CPL 2.38e-07 3.69e-07 4.40e-07 1.05e-06 1.36e-06 2.04e-06 erg/cm2
90%_error_low -3.79e-08 -3.15e-08 N/A -6.57e-07 -1.70e-07 -6.19e-07 erg/cm2
90%_error_hi 3.49e-08 4.32e-08 N/A 1.37e-07 1.24e-07 2.37e-07 erg/cm2
Peak flux CPL 3.29e-01 2.99e-01 1.94e-01 1.97e-01 9.07e-01 1.02e+00 ph/cm2/s
90%_error_low -1.05e-01 -5.48e-02 -5.25e-02 N/A -1.71e-01 -2.42e-01 ph/cm2/s
90%_error_hi 1.03e-01 7.42e-02 5.59e-02 N/A 1.69e-01 1.82e-01 ph/cm2/s
======================================================================
Image
Pre-slew 15.0-350.0 keV image (Event data)
#   RAcent    DECcent   POSerr    Theta     Phi              Peak Cts       SNR   Name
    0.5766   -16.4099   0.0151    21.1586   123.7046         2.2697742     12.742 TRIG_01114937

Foreground time interval of the image:
-66.443  29.757 (delta_t =  96.200 [sec])
Background time interval of the image:
Light Curves
Note: The mask-weighted lightcurves have units of either count/det or counts/sec/det, where a det is 0.4 x 0.4 = 0.16 sq cm.
Full-time range; 1 s binning
Other quick-look light curves:
- 64 ms binning (zoomed)
- 16 ms binning (zoomed)
- 8 ms binning (zoomed)
- 2 ms binning (zoomed)
- SN=5 or 10 s binning (full-time range)
- Raw light curve
Spectra
- 64 ms binning (zoomed)
- 16 ms binning (zoomed)
- 8 ms binning (zoomed)
- 2 ms binning (zoomed)
- SN=5 or 10 s binning (full-time range)
- Raw light curve
Spectra
Notes:
- 1) The fitting includes the systematic errors.
- 2) When the burst includes telescope slew time periods, the fitting uses an average response file made from multiple 5-s response files through out the slew time plus single time preiod for the non-slew times, and weighted by the total counts in the corresponding time period using addrmf. An average response file is needed becuase a spectral fit using the pre-slew DRM will introduce some errors in both a spectral shape and a normalization if the PHA file contains a lot of the slew/post-slew time interval.
- 3) For fits to more complicated models (e.g. a power-law over a cutoff power-law), the BAT team has decided to require a chi-square improvement of more than 6 for each extra dof.
Time averaged spectrum fit using the average DRM
Power-law model
Time interval is from  -71.040 sec. to   36.036 sec.

Spectral model in power-law:
------------------------------------------------------------
Parameters  : value       lower 90%   higher 90%
Photon index: -1.75727     ( -0.175708   0.170512 )
Norm@50keV  : 1.35756E-03    ( -0.000140061   0.000137261 )
------------------------------------------------------------
#Fit statistic  : Chi-Squared                   41.57     using 59 bins.
 Reduced chi-squared = 0.729298
# Null hypothesis probability of 9.38e-01 with 57 degrees of freedom

Photon flux (15-150 keV)    in 107.1 sec: 0.184069 ( -0.01629  0.016303 ) ph/cm2/s
Energy fluence (15-150 keV)             : 1.34128e-06 ( -1.42083e-07  1.44827e-07 ) ergs/cm2
Cutoff power-law model

Time interval is from  -71.040 sec. to   36.036 sec.
Spectral model in the cutoff power-law:
------------------------------------------------------------
Parameters  : value       lower 90%   higher 90%
Photon index: -1.75687     ( -0.176068   0.306485 )
Epeak [keV] : 9999.35      ( -9999.35 -9999.36 )
Norm@50keV  : 1.35920E-03    ( -0.000916072   0.00120603 )
------------------------------------------------------------
#Fit statistic  : Chi-Squared                   41.57     using 59 bins.
 Reduced chi-squared = 0.742321
# Null hypothesis probability of 9.25e-01 with 56 degrees of freedom

Photon flux (15-150 keV)    in 107.1 sec: 0.184749 ( -0.018036  0.017164 ) ph/cm2/s
Energy fluence (15-150 keV)             : 1.35931e-06 ( -1.69882e-07  1.23989e-07 ) ergs/cm2
1-s peak spectrum fit
Power-law model

Time interval is from    3.724 sec. to    4.724 sec.

Spectral model in power-law:
------------------------------------------------------------
Parameters  : value       lower 90%   higher 90%
Photon index: -1.63229     ( -0.351311   0.340244 )
Norm@50keV  : 6.97527E-03    ( -0.00149228   0.00144308 )
------------------------------------------------------------
#Fit statistic  : Chi-Squared                   68.89     using 59 bins.
 Reduced chi-squared = 1.2086
# Null hypothesis probability of 1.34e-01 with 57 degrees of freedom

Photon flux (15-150 keV)    in 1 sec: 0.905586 ( -0.16948  0.169524 ) ph/cm2/s
Energy fluence (15-150 keV)             : 6.5001e-08 ( -1.45871e-08  1.5069e-08 ) ergs/cm2
Cutoff power-law model
Time interval is from    3.724 sec. to    4.724 sec.
Spectral model in the cutoff power-law:
------------------------------------------------------------
Parameters  : value       lower 90%   higher 90%
Photon index: -1.64362     ( -0.34451   0.595479 )
Epeak [keV] : 9999.36      ( -9999.35 -9999.36 )
Norm@50keV  : 6.93325E-03    ( -0.00148624   0.0290993 )
------------------------------------------------------------
#Fit statistic  : Chi-Squared                   68.89     using 59 bins.
 Reduced chi-squared = 1.23018
# Null hypothesis probability of 1.16e-01 with 56 degrees of freedom

Photon flux (15-150 keV)    in 1 sec: 0.906672 ( -0.170951  0.169008 ) ph/cm2/s
Energy fluence (15-150 keV)             : 6.55813e-08 ( -1.11097e-08  9.2839e-09 ) ergs/cm2
Time-resolved spectra
Distribution
T90 vs. Hardness ratio plot
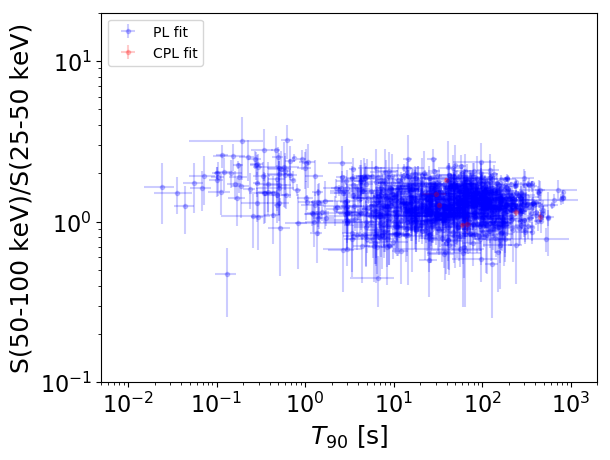
T90                                   = N/A sec.
Hardness ratio (energy fluence ratio) = N/A
S(15-50 keV) vs. S(50-150 keV) plot
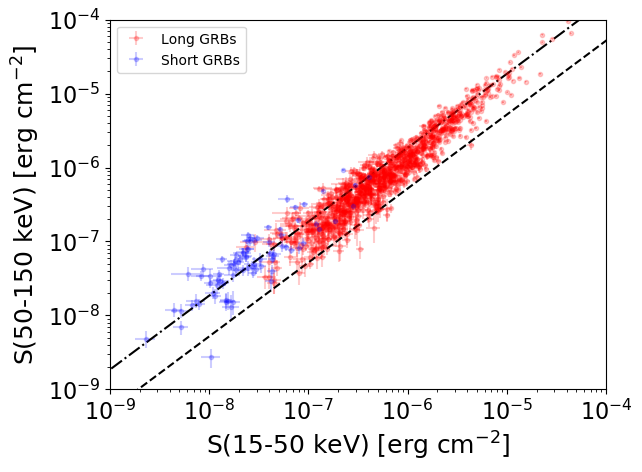
S(15-50 keV)  = N/A
S(50-150 keV) = N/A
The dash-dotted line and the dashed line traces the fluences calculated from the Band function with Epeak = 15 and 150 keV, respectively. Both lines assume a canonical values of alpha = -1 and beta = -2.5.
Mask shadow pattern
IMX = -2.147751411164212E-01, IMY = -3.219851867981682E-01
Spacecraft aspect plot
Bright source in the pre-burst/pre-slew/post-slew images
Pre-burst image of 15-350 keV band
Time interval of the image:
Pre-slew background subtracted image of 15-350 keV band
Time interval of the image:
-66.443400 29.756600

# RAcent  DECcent POSerr Theta    Phi  PeakCts   SNR AngSep     Name
#  [deg]    [deg]    ['] [deg]  [deg]                   [']
  0.5767 -16.4099    0.9  21.2  123.7   2.2699  12.7 ------	UNKNOWN
357.7671  27.3931    2.5  54.5  176.0   2.8226   4.7 ------	UNKNOWN
 37.1112 -40.5479    3.1  22.6   -7.5   0.5926   3.7 ------	UNKNOWN
 83.5318 -64.2880    2.1  58.2   -3.7   4.0965   5.4 ------	UNKNOWN
 17.0660  37.5543    3.3  59.5 -161.9   4.3609   3.4 ------	UNKNOWN
 45.9774  11.5197    2.2  40.6 -119.8   1.9741   5.2 ------	UNKNOWN
 38.2799  27.7386    2.7  51.8 -139.0   3.2406   4.3 ------	UNKNOWN
 70.2957 -19.7388    4.1  44.8  -60.5   2.1593   2.8 ------	UNKNOWN
 54.7887   5.0056    3.0  41.6 -103.3   2.7844   3.9 ------	UNKNOWN
Post-slew image of 15-350 keV band
Time interval of the image:
85.756600 962.357100

# RAcent  DECcent POSerr Theta    Phi  PeakCts   SNR AngSep     Name
#  [deg]    [deg]    ['] [deg]  [deg]                   [']
354.0971  21.7203    3.2  38.6 -170.8   5.5903   3.6 ------	UNKNOWN
 25.2807 -45.0858    4.7  35.4  -11.7   3.4438   2.4 ------	UNKNOWN
 11.3175  17.8471    2.5  35.8 -143.5   6.7445   4.6 ------	UNKNOWN
 47.2531 -18.5531    2.2  44.4  -61.1  27.2329   5.2 ------	UNKNOWN