Analysis Summary
Notes:
- 1) No attempt has been made to eliminate the non-significant decimal places.
- 2) This batgrbproduct analysis is done using the HEASARC data.
- 3) This batgrbproduct analysis is using the flight position for the mask-weighting calculation.
======================================================================
                  BAT GRB EVENT DATA PROCESSING REPORT
    Process Script Ver: batgrbproduct v2.48
    Process Start Time: Mon Oct 24 11:36:43 EDT 2022
             Host Name: batproc1
   Current Working Dir: /local/data/bat1/alien/Swift_3rdBATcatalog/event/batevent_reproc/trigger1115156
======================================================================

  Trigger: 01115156      Segment: 000

  BAT Trigger Time: 678947999.296   [s; MET]
      Trigger Stop: 678948001.344   [s; MET]
               UTC: 2022-07-08T04:39:29.839400    [includes UTCF correction]
       Where From?: TDRSS position message

  BAT
    RA: 103.118496522178   Dec: 72.1912587827694  [deg; J2000]

     Catalogged Source?: NO
     Point Source?:      YES
     GRB Indicated?:     YES    [ by BAT flight software ]
     Image S/N Ratio:    7.34
     Image Trigger?:     NO
     Rate S/N Ratio:     11.5325625946708  [ if not an image trigger ]
     Image S/N Ratio:    7.34

  Analysis Position:   [ source = BAT ]
    RA: 103.118496522178   Dec: 72.1912587827694  [deg; J2000]

  Refined Position:   [ source = BAT pre-slew burst ]
    RA: 103.084685413375   Dec: 72.1868699652895  [deg; J2000]
        { 06h 52m 20.3s , +72d 11' 12.7" }
         +/- 2.19372609018111 [arcmin] (estimated 90% radius based on SNR)
         +/- 0.980261171236673 [arcmin] (formal 1-sigma fit error)
    SNR: 9.90181825844404

  Angular difference between the analysis and refined position is 0.674085 arcmin

  Partial Coding Fraction: 0.7578125    [ including projection effects ]

  Duration
     T90: 4 +/- 1.4142135623731
        Measured from: -1.2960000038147
                   to: 2.7039999961853     [s; relative to TRIGTIME]
     T50: 2 +/- 1
        Measured from: -0.296000003814697
                   to: 1.7039999961853     [s; relative to TRIGTIME]


  Fluence
     Peak Flux  (peak 1 second)
        Measured from: 1.7039999961853
                   to: 2.7039999961853     [s; relative to TRIGTIME]
     Total Fluence
        Measured from: -1.2960000038147
                   to: 2.7039999961853     [s; relative to TRIGTIME]

             Band 1     Band 2     Band 3     Band 4
              15-25      25-50     50-100    100-350     keV
 Total     0.090086   0.105002   0.033711  -0.012993
           0.013403   0.013722   0.011509   0.009836 [error]
 Peak      0.026401   0.035034   0.013580   0.000605
           0.006792   0.007202   0.005870   0.005158 [error]

     [ fluence units of on-axis counts / fully illuminated detector ]

======================================================================


====== Table of the duration information =============================

        Value   tstart    tstop
T100    4.000   -1.296    2.704
T90     4.000   -1.296    2.704
T50     2.000   -0.296    1.704
Peak    1.000    1.704    2.704


====== Spectral Analysis Summary =====================================

Model      : spectral model: simple power-law (PL) and cutoff power-law (CPL)
Ph_index   : photon index: E^{Ph_index}
Ph_90err   : 90% error of the photon index
Epeak      : Epeak in keV
Epeak_90err: 90% error of Epeak
Norm       : normalization at 50 keV in both the PL model and CPL model
Nomr_90err : 90% error of the normalization
chi2       : Chi-Squared
dof        : degree of freedo

=== Time-averaged spectral analysis ===
(Best model with acceptable fit: N/A)

Model Ph_index Ph_90err_low Ph_90err_hi  Epeak  Epeak_90err_low  Epeak_90err_hi  Norm       Nomr_90err_low    Norm_90err_hi    chi2    dof
PL      -2.226    -0.339      0.299       -           -               -         3.15e-03     -7.56e-04          7.35e-04      64.530   57
CPL     -0.741    -1.338      2.314       32.130     -22.154        11.641      2.55e-02     -2.55e-02          6.84e-01      61.890   56


=== 1-s peak spectral analysis ===
(Best model with acceptable fit: N/A)

Model Ph_index Ph_90err_low Ph_90err_hi  Epeak  Epeak_90err_low  Epeak_90err_hi  Norm       Nomr_90err_low    Norm_90err_hi    chi2    dof
PL      -1.916     -0.511     0.455       -           -               -         4.84e-03     -1.56e-03          1.46e-03      62.830   57
CPL     -1.925     -2.406     3.029     9995.040       2.490      -9995.040      4.81e-03     -1.53e-03          6.21e-01      62.830   56


=== Fluence/Peak Flux Summary ===

              Model    Band1     Band2     Band3     Band4     Band5     Total
                       15-25     25-50    50-100    100-350    15-150    15-350    keV
Fluence         PL   3.20e-08  3.79e-08  3.24e-08  4.71e-08  1.19e-07  1.49e-07   erg/cm2
      90%_error_low -6.37e-09 -6.58e-09 -1.01e-08 -2.31e-08 -2.37e-08 -3.82e-08   erg/cm2
      90%_error_hi   6.51e-09  6.45e-09  1.07e-08  3.43e-08  2.47e-08  4.68e-08   erg/cm2
Peak flux       PL   2.97e-01  2.34e-01  1.24e-01  9.55e-02  6.99e-01  7.51e-01   ph/cm2/s
      90%_error_low -1.02e-01 -5.68e-02 -5.04e-02 -5.84e-02 -1.69e-01 -1.85e-01   ph/cm2/s
      90%_error_hi   1.06e-01  5.67e-02  5.18e-02  9.69e-02  1.69e-01  1.87e-01   ph/cm2/s

Fluence        CPL   2.95e-08  4.48e-08  2.72e-08  5.12e-09  1.06e-07  1.07e-07   erg/cm2
      90%_error_low -7.50e-09 -9.71e-09 -1.32e-08 -4.79e-09 -2.19e-08 -2.27e-08   erg/cm2
      90%_error_hi   7.26e-09  1.02e-08  1.34e-08  4.27e-08  2.67e-08  4.96e-08   erg/cm2
Peak flux      CPL   2.74e-01  1.76e-01  7.66e-02  5.30e-02  5.47e-01  5.83e-01   ph/cm2/s
      90%_error_low -1.20e-01 -7.71e-02 -7.66e-02 -5.30e-02 -2.38e-01 -2.54e-01   ph/cm2/s
      90%_error_hi   1.18e-01  1.05e-01  4.90e-02  5.11e-02  3.70e-01  4.44e-01   ph/cm2/s

======================================================================
Image
Pre-slew 15.0-350.0 keV image (Event data)
#   RAcent    DECcent   POSerr    Theta     Phi              Peak Cts       SNR   Name
  103.0847    72.1869   0.0194    25.4132  -136.2464         0.2297943      9.902 TRIG_01115156

Foreground time interval of the image:
 -1.296   2.704 (delta_t =   4.000 [sec])
Background time interval of the image:
-239.296  -1.296 (delta_t = 238.000 [sec])
Light Curves
Note: The mask-weighted lightcurves have units of either count/det or counts/sec/det, where a det is 0.4 x 0.4 = 0.16 sq cm.
Full-time range; 1 s binning
Other quick-look light curves:
- 64 ms binning (zoomed)
- 16 ms binning (zoomed)
- 8 ms binning (zoomed)
- 2 ms binning (zoomed)
- SN=5 or 10 s binning (full-time range)
- Raw light curve
Spectra
- 64 ms binning (zoomed)
- 16 ms binning (zoomed)
- 8 ms binning (zoomed)
- 2 ms binning (zoomed)
- SN=5 or 10 s binning (full-time range)
- Raw light curve
Spectra
Notes:
- 1) The fitting includes the systematic errors.
- 2) When the burst includes telescope slew time periods, the fitting uses an average response file made from multiple 5-s response files through out the slew time plus single time preiod for the non-slew times, and weighted by the total counts in the corresponding time period using addrmf. An average response file is needed becuase a spectral fit using the pre-slew DRM will introduce some errors in both a spectral shape and a normalization if the PHA file contains a lot of the slew/post-slew time interval.
- 3) For fits to more complicated models (e.g. a power-law over a cutoff power-law), the BAT team has decided to require a chi-square improvement of more than 6 for each extra dof.
Time averaged spectrum fit using the average DRM
Power-law model
Time interval is from   -1.296 sec. to    2.704 sec.

Spectral model in power-law:
------------------------------------------------------------
Parameters  : value       lower 90%   higher 90%
Photon index: -2.22601     ( -0.338638   0.298668 )
Norm@50keV  : 3.14958E-03    ( -0.000756148   0.000735086 )
------------------------------------------------------------
#Fit statistic  : Chi-Squared                   64.53     using 59 bins.
 Reduced chi-squared = 1.13211
# Null hypothesis probability of 2.30e-01 with 57 degrees of freedom

Photon flux (15-150 keV)    in 4 sec: 0.528714 ( -0.084406  0.08442 ) ph/cm2/s
Energy fluence (15-150 keV)             : 1.18927e-07 ( -2.37305e-08  2.47379e-08 ) ergs/cm2
Cutoff power-law model
Time interval is from   -1.296 sec. to    2.704 sec.
Spectral model in the cutoff power-law:
------------------------------------------------------------
Parameters  : value       lower 90%   higher 90%
Photon index: -0.740987     ( -1.35196   2.29997 )
Epeak [keV] : 32.1304      ( -22.2313 11.5636 )
Norm@50keV  : 2.55415E-02    ( -0.026402   0.682803 )
------------------------------------------------------------
#Fit statistic  : Chi-Squared                   61.89     using 59 bins.
 Reduced chi-squared = 1.10518
# Null hypothesis probability of 2.74e-01 with 56 degrees of freedom

Photon flux (15-150 keV)    in 4 sec: 0.510523 ( -0.085232  0.08582 ) ph/cm2/s
Energy fluence (15-150 keV)             : 1.05755e-07 ( -2.19208e-08  2.66641e-08 ) ergs/cm2
1-s peak spectrum fit
Power-law model
Time interval is from    1.704 sec. to    2.704 sec.

Spectral model in power-law:
------------------------------------------------------------
Parameters  : value       lower 90%   higher 90%
Photon index: -1.91564     ( -0.511279   0.454814 )
Norm@50keV  : 4.83648E-03    ( -0.00156183   0.00145902 )
------------------------------------------------------------
#Fit statistic  : Chi-Squared                   62.83     using 59 bins.
 Reduced chi-squared = 1.10228
# Null hypothesis probability of 2.77e-01 with 57 degrees of freedom

Photon flux (15-150 keV)    in 1 sec: 0.698784 ( -0.169076  0.169081 ) ph/cm2/s
Energy fluence (15-150 keV)             : 4.44805e-08 ( -1.32442e-08  1.38855e-08 ) ergs/cm2
Cutoff power-law model
Time interval is from    1.704 sec. to    2.704 sec.
Spectral model in the cutoff power-law:
------------------------------------------------------------
Parameters  : value       lower 90%   higher 90%
Photon index: -1.92526     ( -2.40673   3.02827 )
Epeak [keV] : 9995.04      ( -1.77464 -9999.3 )
Norm@50keV  : 4.80689E-03    ( -0.00153843   0.620708 )
------------------------------------------------------------
#Fit statistic  : Chi-Squared                   62.83     using 59 bins.
 Reduced chi-squared = 1.12196
# Null hypothesis probability of 2.47e-01 with 56 degrees of freedom

Photon flux (15-150 keV)    in 1 sec: 0.547305 ( -0.238201  0.370426 ) ph/cm2/s
Energy fluence (15-150 keV)             : 3.98281e-08 ( -1.72025e-08  1.36468e-08 ) ergs/cm2
Time-resolved spectra
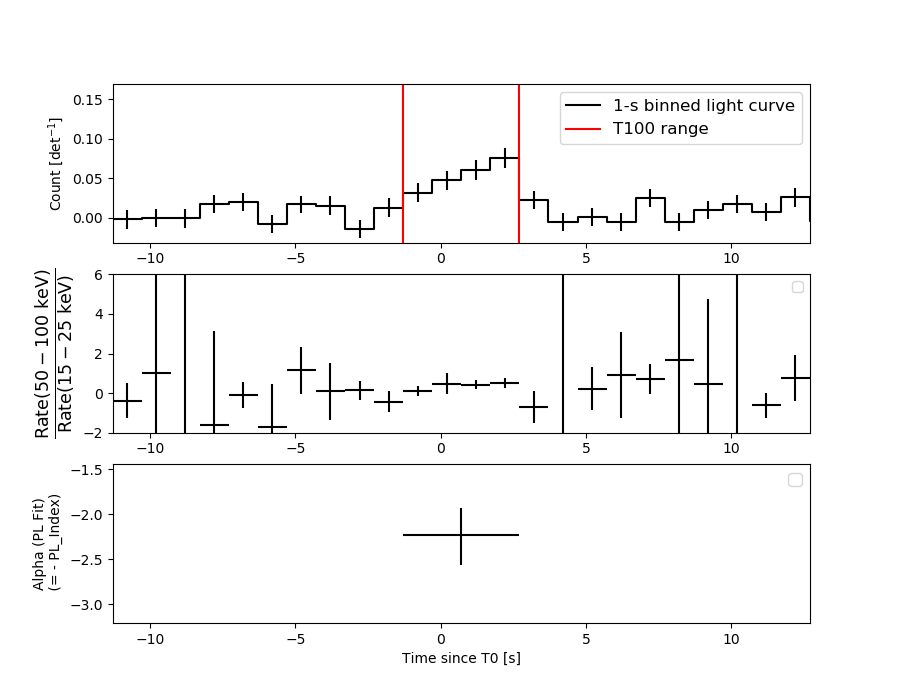
Distribution
T90 vs. Hardness ratio plot
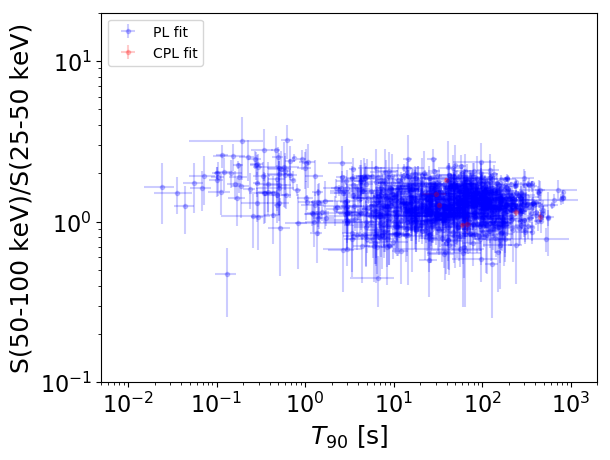
T90                                   = N/A sec.
Hardness ratio (energy fluence ratio) = N/A
S(15-50 keV) vs. S(50-150 keV) plot
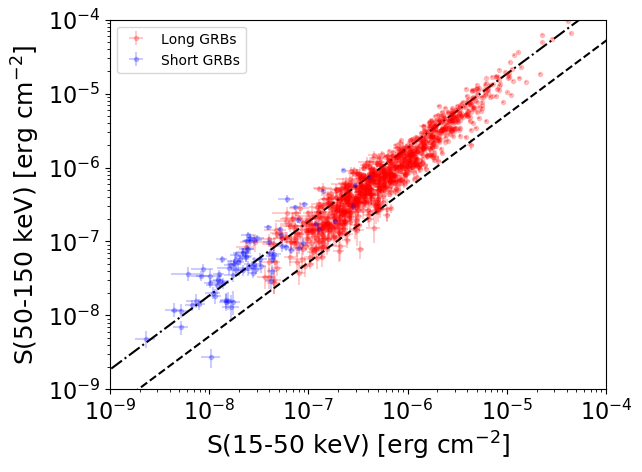
S(15-50 keV)  = N/A
S(50-150 keV) = N/A
The dash-dotted line and the dashed line traces the fluences calculated from the Band function with Epeak = 15 and 150 keV, respectively. Both lines assume a canonical values of alpha = -1 and beta = -2.5.
Mask shadow pattern
IMX = -3.431872264327344E-01, IMY = 3.285711767069660E-01
Spacecraft aspect plot
Bright source in the pre-burst/pre-slew/post-slew images
Pre-burst image of 15-350 keV band
Time interval of the image:
-239.296000 -1.296000

# RAcent  DECcent POSerr Theta    Phi  PeakCts   SNR AngSep     Name
#  [deg]    [deg]    ['] [deg]  [deg]                   [']
 37.7085  30.7404    3.2  35.3  -11.7   1.3634   3.6 ------	UNKNOWN
 75.4420  30.9378    2.6  44.5  -61.1   6.0523   4.4 ------	UNKNOWN
Pre-slew background subtracted image of 15-350 keV band
Time interval of the image:
-1.296000 2.704000

# RAcent  DECcent POSerr Theta    Phi  PeakCts   SNR AngSep     Name
#  [deg]    [deg]    ['] [deg]  [deg]                   [']
202.4701  59.4937    2.0  54.7 -175.1   0.3887   5.7 ------	UNKNOWN
103.0848  72.1869    1.2  25.4 -136.2   0.2299   9.9 ------	UNKNOWN
 81.0614  52.6992    2.2  28.4  -87.5   0.1657   5.2 ------	UNKNOWN
Post-slew image of 15-350 keV band
Time interval of the image:
280.004590 713.474000
720.704000 775.732300
780.704000 962.711100

# RAcent  DECcent POSerr Theta    Phi  PeakCts   SNR AngSep     Name
#  [deg]    [deg]    ['] [deg]  [deg]                   [']
135.3236 -40.5462   24.5  40.8  -39.9   0.6329   0.5    9.4	Vela X-1
170.2779 -60.6076    2.7  38.2    6.8   5.4849   4.3    1.4	Cen X-3
186.8781 -62.8609    6.2  41.3   18.6  -2.3491  -1.9    8.2	GX 301-2
 33.7895 -20.9584    3.4  53.0 -174.2   8.5300   3.4 ------	UNKNOWN
151.1399 -55.3018    3.9  35.4  -11.7   3.2034   2.9 ------	UNKNOWN
138.5173 -43.3636    3.1  39.8  -34.5   4.6412   3.8 ------	UNKNOWN
 72.7455 -34.3967    3.3  31.8 -127.7   4.1261   3.5 ------	UNKNOWN
121.7852 -30.6527    2.3  44.5  -61.1  19.0446   5.0 ------	UNKNOWN
 70.7537 -18.3006    2.6  48.0 -129.0  17.0745   4.3 ------	UNKNOWN