Analysis Summary
Notes:
- 1) No attempt has been made to eliminate the non-significant decimal places.
- 2) This batgrbproduct analysis is done using the HEASARC data.
- 3) This batgrbproduct analysis is using the flight position for the mask-weighting calculation.
======================================================================
BAT GRB EVENT DATA PROCESSING REPORT
Process Script Ver: batgrbproduct v2.48
Process Start Time: Mon Oct 24 11:34:57 EDT 2022
Host Name: batproc1
Current Working Dir: /local/data/bat1/alien/Swift_3rdBATcatalog/event/batevent_reproc/trigger1115766
======================================================================
Trigger: 01115766 Segment: 000
BAT Trigger Time: 679256218.176 [s; MET]
Trigger Stop: 679256219.2 [s; MET]
UTC: 2022-07-11T18:16:28.698520 [includes UTCF correction]
Where From?: TDRSS position message
BAT
RA: 261.993124762887 Dec: 24.6695933765762 [deg; J2000]
Catalogged Source?: NO
Point Source?: YES
GRB Indicated?: YES [ by BAT flight software ]
Image S/N Ratio: 9.6
Image Trigger?: NO
Rate S/N Ratio: 20.3715487874634 [ if not an image trigger ]
Image S/N Ratio: 9.6
Analysis Position: [ source = BAT ]
RA: 261.993124762887 Dec: 24.6695933765762 [deg; J2000]
Refined Position: [ source = BAT pre-slew burst ]
RA: 262.017940308421 Dec: 24.6750002115334 [deg; J2000]
{ 17h 28m 04.3s , +24d 40' 30.0" }
+/- 1.27242467600038 [arcmin] (estimated 90% radius based on SNR)
+/- 0.571123707529293 [arcmin] (formal 1-sigma fit error)
SNR: 21.5597626819381
Angular difference between the analysis and refined position is 1.391357 arcmin
Partial Coding Fraction: 0.1953125 [ including projection effects ]
Duration
T90: 87.055999994278 +/- 9.32164452855154
Measured from: -29.7519999742508
to: 57.3040000200272 [s; relative to TRIGTIME]
T50: 29.5360000133514 +/- 15.1248161917351
Measured from: -1.94400000572205
to: 27.5920000076294 [s; relative to TRIGTIME]
Fluence
Peak Flux (peak 1 second)
Measured from: -0.0199999809265137
to: 0.980000019073486 [s; relative to TRIGTIME]
Total Fluence
Measured from: -37.4960000514984
to: 79.6879999637604 [s; relative to TRIGTIME]
Band 1 Band 2 Band 3 Band 4
15-25 25-50 50-100 100-350 keV
Total 2.815780 3.794684 2.333959 0.579195
0.128060 0.131831 0.112694 0.093472 [error]
Peak 0.048944 0.163606 0.139369 0.047999
0.016263 0.018449 0.016296 0.013147 [error]
[ fluence units of on-axis counts / fully illuminated detector ]
======================================================================
====== Table of the duration information =============================
Value tstart tstop
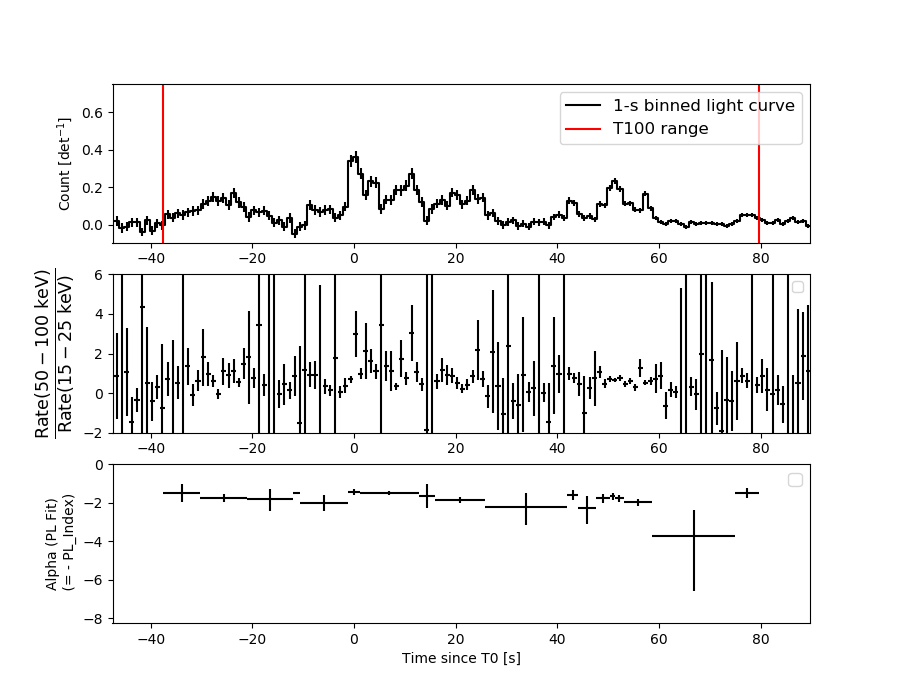
T100 117.184 -37.496 79.688
T90 87.056 -29.752 57.304
T50 29.536 -1.944 27.592
Peak 1.000 -0.020 0.980
====== Spectral Analysis Summary =====================================
Model : spectral model: simple power-law (PL) and cutoff power-law (CPL)
Ph_index : photon index: E^{Ph_index}
Ph_90err : 90% error of the photon index
Epeak : Epeak in keV
Epeak_90err: 90% error of Epeak
Norm : normalization at 50 keV in both the PL model and CPL model
Nomr_90err : 90% error of the normalization
chi2 : Chi-Squared
dof : degree of freedo
=== Time-averaged spectral analysis ===
(Best model with acceptable fit: N/A)
Model Ph_index Ph_90err_low Ph_90err_hi Epeak Epeak_90err_low Epeak_90err_hi Norm Nomr_90err_low Norm_90err_hi chi2 dof
PL -1.738 -0.080 0.080 - - - 5.33e-03 -2.41e-04 2.40e-04 53.550 57
CPL -1.488 -0.282 0.327 100.165 -32.130 -100.165 7.15e-03 -1.94e-03 3.28e-03 51.600 56
=== 1-s peak spectral analysis ===
(Best model with acceptable fit: N/A)
Model Ph_index Ph_90err_low Ph_90err_hi Epeak Epeak_90err_low Epeak_90err_hi Norm Nomr_90err_low Norm_90err_hi chi2 dof
PL -1.436 -0.192 0.190 - - - 2.48e-02 -3.40e-03 3.40e-03 88.190 57
CPL 0.162 -0.871 1.102 76.115 -13.830 28.115 1.37e-01 -8.15e-02 2.90e-01 76.990 56
=== Fluence/Peak Flux Summary ===
Model Band1 Band2 Band3 Band4 Band5 Total
15-25 25-50 50-100 100-350 15-150 15-350 keV
Fluence PL 9.97e-07 1.59e-06 1.90e-06 4.45e-06 5.77e-06 8.94e-06 erg/cm2
90%_error_low -7.40e-08 -7.13e-08 -1.15e-07 -5.51e-07 -2.70e-07 -6.46e-07 erg/cm2
90%_error_hi 7.57e-08 7.11e-08 1.15e-07 6.02e-07 2.71e-07 6.83e-07 erg/cm2
Peak flux PL 9.60e-01 1.00e+00 7.41e-01 8.84e-01 3.04e+00 3.59e+00 ph/cm2/s
90%_error_low -2.07e-01 -1.52e-01 -1.14e-01 -2.31e-01 -4.35e-01 -4.93e-01 ph/cm2/s
90%_error_hi 2.20e-01 1.51e-01 1.13e-01 2.64e-01 4.36e-01 4.93e-01 ph/cm2/s
Fluence CPL 9.57e-07 1.62e-06 1.92e-06 3.03e-06 5.65e-06 7.53e-06 erg/cm2
90%_error_low -8.81e-08 -8.47e-08 -1.20e-07 -1.09e-06 -3.08e-07 -1.13e-06 erg/cm2
90%_error_hi 8.96e-08 8.61e-08 1.21e-07 1.60e-06 3.07e-07 1.67e-06 erg/cm2
Peak flux CPL 6.70e-01 1.14e+00 9.30e-01 3.30e-01 2.99e+00 3.07e+00 ph/cm2/s
90%_error_low -2.36e-01 -1.88e-01 -1.56e-01 -1.60e-01 -4.37e-01 -4.67e-01 ph/cm2/s
90%_error_hi 2.58e-01 1.92e-01 1.61e-01 2.38e-01 4.39e-01 4.81e-01 ph/cm2/s
======================================================================
Image
Pre-slew 15.0-350.0 keV image (Event data)
#   RAcent    DECcent   POSerr    Theta     Phi              Peak Cts       SNR   Name
  262.0179    24.6750   0.0089    36.3866   115.4109         5.7745610     21.560 TRIG_01115766

Foreground time interval of the image:
-37.496  15.325 (delta_t =  52.821 [sec])
Background time interval of the image:
-239.176 -37.496 (delta_t = 201.680 [sec])
Light Curves
Note: The mask-weighted lightcurves have units of either count/det or counts/sec/det, where a det is 0.4 x 0.4 = 0.16 sq cm.
Full-time range; 1 s binning
Other quick-look light curves:
- 64 ms binning (zoomed)
- 16 ms binning (zoomed)
- 8 ms binning (zoomed)
- 2 ms binning (zoomed)
- SN=5 or 10 s binning (full-time range)
- Raw light curve
Spectra
- 64 ms binning (zoomed)
- 16 ms binning (zoomed)
- 8 ms binning (zoomed)
- 2 ms binning (zoomed)
- SN=5 or 10 s binning (full-time range)
- Raw light curve
Spectra
Notes:
- 1) The fitting includes the systematic errors.
- 2) When the burst includes telescope slew time periods, the fitting uses an average response file made from multiple 5-s response files through out the slew time plus single time preiod for the non-slew times, and weighted by the total counts in the corresponding time period using addrmf. An average response file is needed becuase a spectral fit using the pre-slew DRM will introduce some errors in both a spectral shape and a normalization if the PHA file contains a lot of the slew/post-slew time interval.
- 3) For fits to more complicated models (e.g. a power-law over a cutoff power-law), the BAT team has decided to require a chi-square improvement of more than 6 for each extra dof.
Time averaged spectrum fit using the average DRM
Power-law model
Time interval is from  -37.496 sec. to   79.688 sec.

Spectral model in power-law:
------------------------------------------------------------
Parameters  : value       lower 90%   higher 90%
Photon index: -1.73758     ( -0.080335   0.079686 )
Norm@50keV  : 5.33038E-03    ( -0.000241046   0.000240137 )
------------------------------------------------------------
#Fit statistic  : Chi-Squared                   53.55     using 59 bins.
 Reduced chi-squared = 0.939474
# Null hypothesis probability of 6.05e-01 with 57 degrees of freedom

Photon flux (15-150 keV)    in 117.2 sec: 0.717518 ( -0.032676  0.032751 ) ph/cm2/s
Energy fluence (15-150 keV)             : 5.76963e-06 ( -2.69944e-07  2.71078e-07 ) ergs/cm2
Cutoff power-law model
Time interval is from  -37.496 sec. to   79.688 sec.
Spectral model in the cutoff power-law:
------------------------------------------------------------
Parameters  : value       lower 90%   higher 90%
Photon index: -1.48826     ( -0.282003   0.326741 )
Epeak [keV] : 100.165      ( -32.131 -100.166 )
Norm@50keV  : 7.15027E-03    ( -0.00194076   0.00327532 )
------------------------------------------------------------
#Fit statistic  : Chi-Squared                   51.60     using 59 bins.
 Reduced chi-squared = 0.921429
# Null hypothesis probability of 6.42e-01 with 56 degrees of freedom

Photon flux (15-150 keV)    in 117.2 sec: 0.706980 ( -0.034985  0.035036 ) ph/cm2/s
Energy fluence (15-150 keV)             : 5.6496e-06 ( -3.07925e-07  3.0685e-07 ) ergs/cm2
1-s peak spectrum fit
Power-law model
Time interval is from   -0.020 sec. to    0.980 sec.

Spectral model in power-law:
------------------------------------------------------------
Parameters  : value       lower 90%   higher 90%
Photon index: -1.43626     ( -0.191683   0.190057 )
Norm@50keV  : 2.47838E-02    ( -0.00340061   0.00339995 )
------------------------------------------------------------
#Fit statistic  : Chi-Squared                   88.19     using 59 bins.
 Reduced chi-squared = 1.54719
# Null hypothesis probability of 5.05e-03 with 57 degrees of freedom

Photon flux (15-150 keV)    in 1 sec: 3.04412 ( -0.43481  0.43603 ) ph/cm2/s
Energy fluence (15-150 keV)             : 2.37799e-07 ( -3.39822e-08  3.40326e-08 ) ergs/cm2
Cutoff power-law model
Time interval is from   -0.020 sec. to    0.980 sec.
Spectral model in the cutoff power-law:
------------------------------------------------------------
Parameters  : value       lower 90%   higher 90%
Photon index: 0.162297     ( -0.87092   1.10152 )
Epeak [keV] : 76.1146      ( -13.8299 28.1152 )
Norm@50keV  : 0.137160    ( -0.0815291   0.289641 )
------------------------------------------------------------
#Fit statistic  : Chi-Squared                   76.99     using 59 bins.
 Reduced chi-squared = 1.37482
# Null hypothesis probability of 3.29e-02 with 56 degrees of freedom

Photon flux (15-150 keV)    in 1 sec: 2.98696 ( -0.43697  0.43873 ) ph/cm2/s
Energy fluence (15-150 keV)             : 2.38556e-07 ( -3.5741e-08  3.55067e-08 ) ergs/cm2
Time-resolved spectra
Distribution
T90 vs. Hardness ratio plot
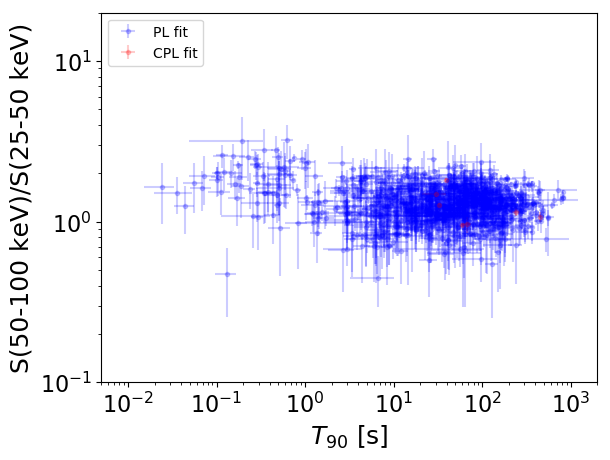
T90                                   = N/A sec.
Hardness ratio (energy fluence ratio) = N/A
S(15-50 keV) vs. S(50-150 keV) plot
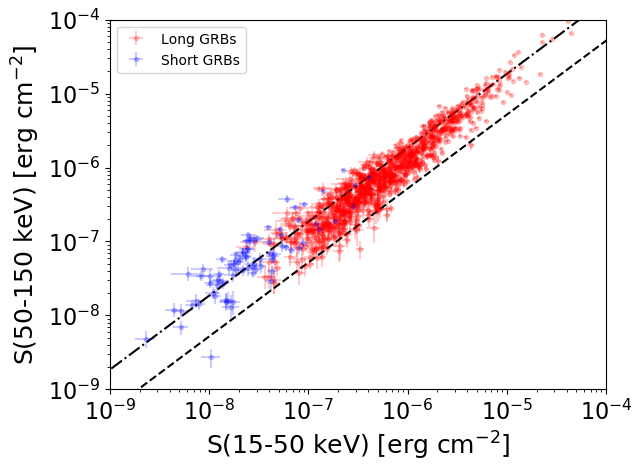
S(15-50 keV)  = N/A
S(50-150 keV) = N/A
The dash-dotted line and the dashed line traces the fluences calculated from the Band function with Epeak = 15 and 150 keV, respectively. Both lines assume a canonical values of alpha = -1 and beta = -2.5.
Mask shadow pattern
IMX = -3.162101658055748E-01, IMY = -6.656095864535490E-01
Spacecraft aspect plot
Bright source in the pre-burst/pre-slew/post-slew images
Pre-burst image of 15-350 keV band
Time interval of the image:
-239.176000 -37.496000

# RAcent  DECcent POSerr Theta    Phi  PeakCts   SNR AngSep     Name
#  [deg]    [deg]    ['] [deg]  [deg]                   [']
254.3402  35.2923    3.6  26.3  129.8   1.2095   3.2    6.5	Her X-1
299.5427  35.1568    3.4  35.1   55.5   1.9985   3.4    3.6	Cyg X-1
307.9830  40.9640    6.3  34.0   40.0   0.8213   1.8    5.8	Cyg X-3
326.2156  38.3771    5.8  44.8   25.1   1.0372   2.0    3.9	Cyg X-2
227.5894  32.6691    2.2  36.2  169.3   2.0573   5.1 ------	UNKNOWN
  2.1046  49.9006    2.5  52.0  -11.3   2.4745   4.6 ------	UNKNOWN
  9.6326  48.2349    2.7  56.2  -15.0   3.3485   4.2 ------	UNKNOWN
 72.1239  74.3248    2.8  44.4  -61.1   4.9880   4.2 ------	UNKNOWN
175.6612  47.9084    2.2  48.0 -129.1   6.0149   5.2 ------	UNKNOWN
Pre-slew background subtracted image of 15-350 keV band
Time interval of the image:
-37.496000 15.324600

# RAcent  DECcent POSerr Theta    Phi  PeakCts   SNR AngSep     Name
#  [deg]    [deg]    ['] [deg]  [deg]                   [']
254.4038  35.1561    0.0  26.4  129.6   0.2087   1.5   11.5	Her X-1
299.6687  35.3219    3.7  35.0   55.2   0.6575   3.1    8.2	Cyg X-1
308.0544  40.8211    4.6  34.2   40.1   0.4253   2.5    8.3	Cyg X-3
326.1501  38.3106   47.3  44.8   25.2   0.0573   0.2    1.2	Cyg X-2
262.0179  24.6750    0.5  36.4  115.4   5.7753  21.6 ------	UNKNOWN
  8.6295  54.7813    2.2  50.5  -19.1   1.1168   5.3 ------	UNKNOWN
178.8448  68.4959    2.1  33.4 -106.3   0.7847   5.4 ------	UNKNOWN
104.2716  76.2733    2.4  42.0  -72.6   1.7504   4.8 ------	UNKNOWN
Post-slew image of 15-350 keV band
Time interval of the image:
91.324590 914.024600

# RAcent  DECcent POSerr Theta    Phi  PeakCts   SNR AngSep     Name
#  [deg]    [deg]    ['] [deg]  [deg]                   [']
244.9658 -15.6358    0.7  43.6  147.9  59.5385  15.9    0.8	Sco X-1
254.3688  35.3548    3.1  12.5  -86.3   4.0488   3.8    4.4	Her X-1
268.4023  -1.6008    7.5  27.0  109.5  -2.8444  -1.5    9.1	SW J1753.5-0127
274.0646 -13.9816    8.1  40.4  105.5  -7.3739  -1.4    4.7	GX 17+2
288.9287  10.9945    5.9  29.0   57.1  -3.4686  -1.9    8.2	GRS 1915+105
299.6045  35.1757    1.0  34.0    6.8  16.3910  11.4    1.7	Cyg X-1
308.1889  40.8607    3.4  41.5   -0.8   5.6279   3.4    6.6	Cyg X-3
326.1689  38.2967    6.3  55.3    3.0   3.9369   1.8    1.5	Cyg X-2
255.6583 -19.1149    3.1  44.2  132.3  21.2079   3.7 ------	UNKNOWN
286.9479  23.4120    2.8  22.8   31.7   4.7537   4.1 ------	UNKNOWN
237.1069  -2.1731    2.3  36.1  169.3   7.9195   5.0 ------	UNKNOWN
297.6442  45.6825    3.6  35.4  -11.7   4.3505   3.2 ------	UNKNOWN
289.7819  59.4383    2.8  39.8  -34.6   6.1713   4.1 ------	UNKNOWN
252.6636  68.7751    2.5  44.4  -61.1  23.3120   4.7 ------	UNKNOWN
207.9921  28.6858    2.5  48.0 -129.0  21.7211   4.6 ------	UNKNOWN