Analysis Summary
Notes:
- 1) No attempt has been made to eliminate the non-significant decimal places.
- 2) This batgrbproduct analysis is done using the HEASARC data.
- 3) This batgrbproduct analysis is using the flight position for the mask-weighting calculation.
======================================================================
BAT GRB EVENT DATA PROCESSING REPORT
Process Script Ver: batgrbproduct v2.48
Process Start Time: Mon Oct 24 11:29:49 EDT 2022
Host Name: batproc1
Current Working Dir: /local/data/bat1/alien/Swift_3rdBATcatalog/event/batevent_reproc/trigger1116221
======================================================================
Trigger: 01116221 Segment: 000
BAT Trigger Time: 679499914.048 [s; MET]
Trigger Stop: 679499914.56 [s; MET]
UTC: 2022-07-14T13:58:04.554000 [includes UTCF correction]
Where From?: TDRSS position message
BAT
RA: 47.0721354244508 Dec: -19.334163611719 [deg; J2000]
Catalogged Source?: NO
Point Source?: YES
GRB Indicated?: YES [ by BAT flight software ]
Image S/N Ratio: 7.45
Image Trigger?: NO
Rate S/N Ratio: 15.2970585407784 [ if not an image trigger ]
Image S/N Ratio: 7.45
Analysis Position: [ source = BAT ]
RA: 47.0721354244508 Dec: -19.334163611719 [deg; J2000]
Refined Position: [ source = BAT pre-slew burst ]
RA: 47.0831291182172 Dec: -19.318844639361 [deg; J2000]
{ 03h 08m 20.0s , -19d 19' 07.8" }
+/- 1.24168732108811 [arcmin] (estimated 90% radius based on SNR)
+/- 0.467216231850978 [arcmin] (formal 1-sigma fit error)
SNR: 22.3262184947459
Angular difference between the analysis and refined position is 1.110072 arcmin
Partial Coding Fraction: 0.8828125 [ including projection effects ]
Duration
T90: 49.039999961853 +/- 7.73532831636294
Measured from: -19.6840000152588
to: 29.3559999465942 [s; relative to TRIGTIME]
T50: 16.7039999961853 +/- 0.667269054245118
Measured from: 3.25199997425079
to: 19.9559999704361 [s; relative to TRIGTIME]
Fluence
Peak Flux (peak 1 second)
Measured from: 12.892000079155
to: 13.892000079155 [s; relative to TRIGTIME]
Total Fluence
Measured from: -47.7999999523163
to: 45.7480000257492 [s; relative to TRIGTIME]
Band 1 Band 2 Band 3 Band 4
15-25 25-50 50-100 100-350 keV
Total 2.941126 3.174516 1.788501 0.391118
0.065341 0.068402 0.062079 0.061136 [error]
Peak 0.139469 0.187965 0.114798 0.033108
0.008660 0.009765 0.008482 0.006822 [error]
[ fluence units of on-axis counts / fully illuminated detector ]
======================================================================
====== Table of the duration information =============================
Value tstart tstop
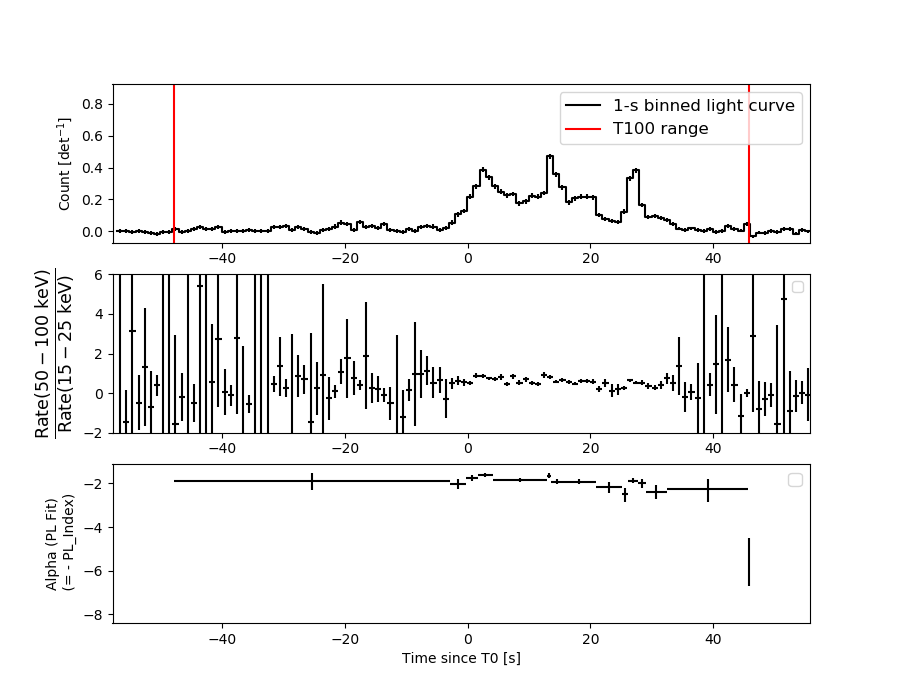
T100 93.548 -47.800 45.748
T90 49.040 -19.684 29.356
T50 16.704 3.252 19.956
Peak 1.000 12.892 13.892
====== Spectral Analysis Summary =====================================
Model : spectral model: simple power-law (PL) and cutoff power-law (CPL)
Ph_index : photon index: E^{Ph_index}
Ph_90err : 90% error of the photon index
Epeak : Epeak in keV
Epeak_90err: 90% error of Epeak
Norm : normalization at 50 keV in both the PL model and CPL model
Nomr_90err : 90% error of the normalization
chi2 : Chi-Squared
dof : degree of freedo
=== Time-averaged spectral analysis ===
(Best model with acceptable fit: N/A)
Model Ph_index Ph_90err_low Ph_90err_hi Epeak Epeak_90err_low Epeak_90err_hi Norm Nomr_90err_low Norm_90err_hi chi2 dof
PL -1.909 -0.066 0.065 - - - 5.18e-03 -1.72e-04 1.71e-04 45.500 57
CPL -1.909 -0.066 0.066 9999.280 -9999.270 -9999.280 5.19e-03 -1.43e-03 1.10e-03 45.510 56
=== 1-s peak spectral analysis ===
(Best model with acceptable fit: N/A)
Model Ph_index Ph_90err_low Ph_90err_hi Epeak Epeak_90err_low Epeak_90err_hi Norm Nomr_90err_low Norm_90err_hi chi2 dof
PL -1.648 -0.114 0.112 - - - 2.94e-02 -1.97e-03 1.95e-03 40.800 57
CPL -1.449 -0.293 0.462 131.456 -62.435 -131.456 3.75e-02 -9.73e-03 2.77e-02 40.160 56
=== Fluence/Peak Flux Summary ===
Model Band1 Band2 Band3 Band4 Band5 Total
15-25 25-50 50-100 100-350 15-150 15-350 keV
Fluence PL 9.10e-07 1.30e-06 1.39e-06 2.74e-06 4.46e-06 6.35e-06 erg/cm2
90%_error_low -5.13e-08 -4.10e-08 -6.60e-08 -2.79e-07 -1.46e-07 -3.26e-07 erg/cm2
90%_error_hi 5.25e-08 4.09e-08 6.61e-08 3.01e-07 1.47e-07 3.42e-07 erg/cm2
Peak flux PL 1.40e+00 1.29e+00 8.22e-01 8.06e-01 3.84e+00 4.31e+00 ph/cm2/s
90%_error_low -1.41e-01 -8.16e-02 -7.18e-02 -1.34e-01 -2.39e-01 -2.68e-01 ph/cm2/s
90%_error_hi 1.45e-01 8.14e-02 7.16e-02 1.50e-01 2.39e-01 2.69e-01 ph/cm2/s
Fluence CPL 9.22e-07 1.30e-06 1.39e-06 2.97e-06 4.49e-06 6.34e-06 erg/cm2
90%_error_low -6.33e-08 -4.41e-08 -4.55e-08 N/A -1.91e-07 -7.02e-07 erg/cm2
90%_error_hi 4.15e-08 5.07e-08 6.64e-08 N/A 1.08e-07 3.31e-07 erg/cm2
Peak flux CPL 1.35e+00 1.31e+00 8.31e-01 6.22e-01 3.81e+00 4.12e+00 ph/cm2/s
90%_error_low -1.66e-01 -9.74e-02 -7.52e-02 -2.61e-01 -2.51e-01 -3.77e-01 ph/cm2/s
90%_error_hi 1.68e-01 1.01e-01 7.64e-02 2.27e-01 2.50e-01 4.19e-01 ph/cm2/s
======================================================================
Image
Pre-slew 15.0-350.0 keV image (Event data)
#   RAcent    DECcent   POSerr    Theta     Phi              Peak Cts       SNR   Name
   47.0831   -19.3188   0.0086    19.4986    32.0722         3.8084303     22.326 TRIG_01116221

Foreground time interval of the image:
-47.800   9.853 (delta_t =  57.653 [sec])
Background time interval of the image:
-179.048 -47.800 (delta_t = 131.248 [sec])
Light Curves
Note: The mask-weighted lightcurves have units of either count/det or counts/sec/det, where a det is 0.4 x 0.4 = 0.16 sq cm.
Full-time range; 1 s binning
Other quick-look light curves:
- 64 ms binning (zoomed)
- 16 ms binning (zoomed)
- 8 ms binning (zoomed)
- 2 ms binning (zoomed)
- SN=5 or 10 s binning (full-time range)
- Raw light curve
Spectra
- 64 ms binning (zoomed)
- 16 ms binning (zoomed)
- 8 ms binning (zoomed)
- 2 ms binning (zoomed)
- SN=5 or 10 s binning (full-time range)
- Raw light curve
Spectra
Notes:
- 1) The fitting includes the systematic errors.
- 2) When the burst includes telescope slew time periods, the fitting uses an average response file made from multiple 5-s response files through out the slew time plus single time preiod for the non-slew times, and weighted by the total counts in the corresponding time period using addrmf. An average response file is needed becuase a spectral fit using the pre-slew DRM will introduce some errors in both a spectral shape and a normalization if the PHA file contains a lot of the slew/post-slew time interval.
- 3) For fits to more complicated models (e.g. a power-law over a cutoff power-law), the BAT team has decided to require a chi-square improvement of more than 6 for each extra dof.
Time averaged spectrum fit using the average DRM
Power-law model
Time interval is from  -47.800 sec. to   45.748 sec.

Spectral model in power-law:
------------------------------------------------------------
Parameters  : value       lower 90%   higher 90%
Photon index: -1.90924     ( -0.0660206   0.0654537 )
Norm@50keV  : 5.18304E-03    ( -0.000172178   0.000171299 )
------------------------------------------------------------
#Fit statistic  : Chi-Squared                   45.50     using 59 bins.
 Reduced chi-squared = 0.798246
# Null hypothesis probability of 8.63e-01 with 57 degrees of freedom

Photon flux (15-150 keV)    in 93.55 sec: 0.746802 ( -0.024864  0.02498 ) ph/cm2/s
Energy fluence (15-150 keV)             : 4.45896e-06 ( -1.45915e-07  1.46511e-07 ) ergs/cm2
Cutoff power-law model

Time interval is from  -47.800 sec. to   45.748 sec.
Spectral model in the cutoff power-law:
------------------------------------------------------------
Parameters  : value       lower 90%   higher 90%
Photon index: -1.90907     ( -0.0660937   0.0659907 )
Epeak [keV] : 9999.28      ( -9999.35 -9999.36 )
Norm@50keV  : 5.18578E-03    ( -0.00142886   0.00110149 )
------------------------------------------------------------
#Fit statistic  : Chi-Squared                   45.51     using 59 bins.
 Reduced chi-squared = 0.812679
# Null hypothesis probability of 8.41e-01 with 56 degrees of freedom

Photon flux (15-150 keV)    in 93.55 sec: 0.751730 ( -0.029813  0.020048 ) ph/cm2/s
Energy fluence (15-150 keV)             : 4.49369e-06 ( -1.91362e-07  1.07536e-07 ) ergs/cm2
1-s peak spectrum fit
Power-law model
Time interval is from   12.892 sec. to   13.892 sec.

Spectral model in power-law:
------------------------------------------------------------
Parameters  : value       lower 90%   higher 90%
Photon index: -1.64781     ( -0.113563   0.11165 )
Norm@50keV  : 2.94449E-02    ( -0.00196958   0.00195286 )
------------------------------------------------------------
#Fit statistic  : Chi-Squared                   40.80     using 59 bins.
 Reduced chi-squared = 0.715789
# Null hypothesis probability of 9.48e-01 with 57 degrees of freedom

Photon flux (15-150 keV)    in 1 sec: 3.84215 ( -0.23894  0.2391 ) ph/cm2/s
Energy fluence (15-150 keV)             : 2.73949e-07 ( -1.95649e-08  1.97483e-08 ) ergs/cm2
Cutoff power-law model
Time interval is from   12.892 sec. to   13.892 sec.
Spectral model in the cutoff power-law:
------------------------------------------------------------
Parameters  : value       lower 90%   higher 90%
Photon index: -1.44887     ( -0.292979   0.462165 )
Epeak [keV] : 131.456      ( -62.4369 -131.458 )
Norm@50keV  : 3.75032E-02    ( -0.00973007   0.0276511 )
------------------------------------------------------------
#Fit statistic  : Chi-Squared                   40.16     using 59 bins.
 Reduced chi-squared = 0.717143
# Null hypothesis probability of 9.45e-01 with 56 degrees of freedom

Photon flux (15-150 keV)    in 1 sec: 3.80617 ( -0.25068  0.25043 ) ph/cm2/s
Energy fluence (15-150 keV)             : 2.68955e-07 ( -2.23738e-08  2.21971e-08 ) ergs/cm2
Time-resolved spectra
Distribution
T90 vs. Hardness ratio plot
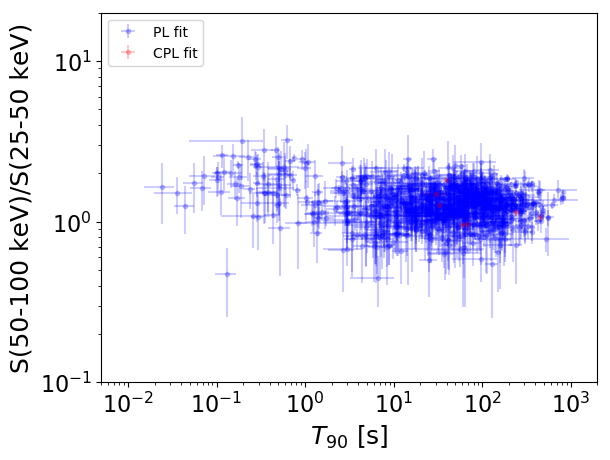
T90                                   = N/A sec.
Hardness ratio (energy fluence ratio) = N/A
S(15-50 keV) vs. S(50-150 keV) plot
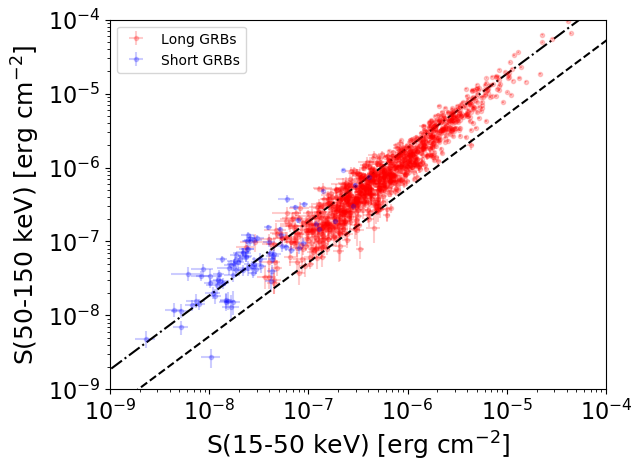
S(15-50 keV)  = N/A
S(50-150 keV) = N/A
The dash-dotted line and the dashed line traces the fluences calculated from the Band function with Epeak = 15 and 150 keV, respectively. Both lines assume a canonical values of alpha = -1 and beta = -2.5.
Mask shadow pattern
IMX = 3.000499177724512E-01, IMY = -1.880177922912658E-01
Spacecraft aspect plot
Bright source in the pre-burst/pre-slew/post-slew images
Pre-burst image of 15-350 keV band
Time interval of the image:
-179.048000 -47.800000

# RAcent  DECcent POSerr Theta    Phi  PeakCts   SNR AngSep     Name
#  [deg]    [deg]    ['] [deg]  [deg]                   [']
 83.6967  21.9831    6.1  39.5 -102.2   2.5538   1.9    4.0	Crab
 72.4191 -27.8842    3.6  35.2  -12.0   1.5638   3.2 ------	UNKNOWN
 58.9584  34.8267    2.1  35.9 -143.5   3.0515   5.5 ------	UNKNOWN
 85.2533 -19.6583    3.1  39.7  -34.4   2.4389   3.8 ------	UNKNOWN
Pre-slew background subtracted image of 15-350 keV band
Time interval of the image:
-47.800000 9.852600

# RAcent  DECcent POSerr Theta    Phi  PeakCts   SNR AngSep     Name
#  [deg]    [deg]    ['] [deg]  [deg]                   [']
 83.6656  21.9975    3.6  39.5 -102.3   1.7127   3.3    2.1	Crab
 10.9775  25.2815    3.3  45.4  150.7   1.6612   3.6 ------	UNKNOWN
 25.5824  24.3932    2.7  34.0  161.5   0.9060   4.2 ------	UNKNOWN
 47.0831 -19.3189    0.5  19.5   32.1   3.8083  22.3 ------	UNKNOWN
 92.9719   0.5780    2.5  43.0  -67.0   3.2141   4.7 ------	UNKNOWN
Post-slew image of 15-350 keV band
Time interval of the image:
64.052590 178.652590

# RAcent  DECcent POSerr Theta    Phi  PeakCts   SNR AngSep     Name
#  [deg]    [deg]    ['] [deg]  [deg]                   [']
  7.8703  -6.0722    3.2  40.4  132.8   2.3631   3.7  595.7	UNKNOWN
  9.5149   8.4101    2.9  46.3  152.4   2.7262   3.9 ------	UNKNOWN
 35.8127 -53.0843    2.3  34.9   40.8   1.7661   5.1 ------	UNKNOWN
 52.1352 -47.1919    2.2  28.2   21.7   1.2019   5.2 ------	UNKNOWN
 25.6212  29.4226    2.9  53.0 -174.6   2.3236   3.9 ------	UNKNOWN
 78.2218 -43.1341    3.2  35.3  -11.8   0.9251   3.6 ------	UNKNOWN