Analysis Summary
Notes:
- 1) No attempt has been made to eliminate the non-significant decimal places.
- 2) This batgrbproduct analysis is done using the HEASARC data.
- 3) This batgrbproduct analysis is using the flight position for the mask-weighting calculation.
======================================================================
BAT GRB EVENT DATA PROCESSING REPORT
Process Script Ver: batgrbproduct v2.48
Process Start Time: Mon Oct 24 11:28:02 EDT 2022
Host Name: batproc1
Current Working Dir: /local/data/bat1/alien/Swift_3rdBATcatalog/event/batevent_reproc/trigger1116441
======================================================================
Trigger: 01116441 Segment: 000
BAT Trigger Time: 679616711.68 [s; MET]
Trigger Stop: 679616712.704 [s; MET]
UTC: 2022-07-15T22:24:42.178080 [includes UTCF correction]
Where From?: TDRSS position message
BAT
RA: 254.88862245431 Dec: -33.5970201018269 [deg; J2000]
Catalogged Source?: NO
Point Source?: YES
GRB Indicated?: YES [ by BAT flight software ]
Image S/N Ratio: 11.46
Image Trigger?: NO
Rate S/N Ratio: 24.8596057893121 [ if not an image trigger ]
Image S/N Ratio: 11.46
Analysis Position: [ source = BAT ]
RA: 254.88862245431 Dec: -33.5970201018269 [deg; J2000]
Refined Position: [ source = BAT pre-slew burst ]
RA: 254.855592534367 Dec: -33.5841742333509 [deg; J2000]
{ 16h 59m 25.3s , -33d 35' 03.0" }
+/- 1.06689006436006 [arcmin] (estimated 90% radius based on SNR)
+/- 0.486809626556817 [arcmin] (formal 1-sigma fit error)
SNR: 27.7298437120188
Angular difference between the analysis and refined position is 1.821921 arcmin
Partial Coding Fraction: 0.953125 [ including projection effects ]
Duration
T90: 40.4079998731613 +/- 1.21780951493553
Measured from: 0.400000095367432
to: 40.8079999685287 [s; relative to TRIGTIME]
T50: 15.1599999666214 +/- 3.22868138718018
Measured from: 3.75200009346008
to: 18.9120000600815 [s; relative to TRIGTIME]
Fluence
Peak Flux (peak 1 second)
Measured from: -0.0759999752044678
to: 0.924000024795532 [s; relative to TRIGTIME]
Total Fluence
Measured from: -0.148000001907349
to: 42.1720000505447 [s; relative to TRIGTIME]
Band 1 Band 2 Band 3 Band 4
15-25 25-50 50-100 100-350 keV
Total 0.484531 0.719718 0.539886 0.148399
0.043971 0.041845 0.035184 0.029214 [error]
Peak 0.038440 0.055275 0.062199 0.035441
0.006909 0.007038 0.006612 0.005433 [error]
[ fluence units of on-axis counts / fully illuminated detector ]
======================================================================
====== Table of the duration information =============================
Value tstart tstop
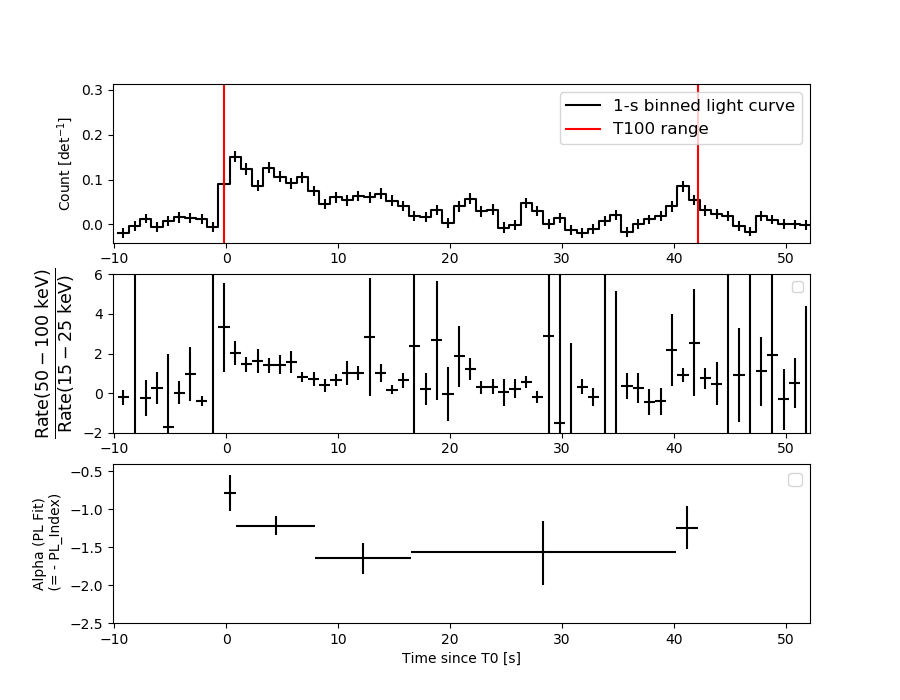
T100 42.320 -0.148 42.172
T90 40.408 0.400 40.808
T50 15.160 3.752 18.912
Peak 1.000 -0.076 0.924
====== Spectral Analysis Summary =====================================
Model : spectral model: simple power-law (PL) and cutoff power-law (CPL)
Ph_index : photon index: E^{Ph_index}
Ph_90err : 90% error of the photon index
Epeak : Epeak in keV
Epeak_90err: 90% error of Epeak
Norm : normalization at 50 keV in both the PL model and CPL model
Nomr_90err : 90% error of the normalization
chi2 : Chi-Squared
dof : degree of freedo
=== Time-averaged spectral analysis ===
(Best model with acceptable fit: N/A)
Model Ph_index Ph_90err_low Ph_90err_hi Epeak Epeak_90err_low Epeak_90err_hi Norm Nomr_90err_low Norm_90err_hi chi2 dof
PL -1.358 -0.112 0.113 - - - 2.90e-03 -1.84e-04 1.84e-04 73.410 57
CPL -1.010 -0.395 0.502 144.007 -57.560 -144.007 4.32e-03 -1.52e-03 3.26e-03 71.670 56
=== 1-s peak spectral analysis ===
(Best model with acceptable fit: N/A)
Model Ph_index Ph_90err_low Ph_90err_hi Epeak Epeak_90err_low Epeak_90err_hi Norm Nomr_90err_low Norm_90err_hi chi2 dof
PL -0.785 -0.233 0.247 - - - 1.13e-02 -1.43e-03 1.39e-03 51.020 57
CPL -0.795 -0.218 0.267 9999.360 -9999.360 -9999.360 1.15e-02 -1.47e-03 1.26e-03 51.090 56
=== Fluence/Peak Flux Summary ===
Model Band1 Band2 Band3 Band4 Band5 Total
15-25 25-50 50-100 100-350 15-150 15-350 keV
Fluence PL 1.37e-07 2.75e-07 4.29e-07 1.47e-06 1.19e-06 2.31e-06 erg/cm2
90%_error_low -1.59e-08 -1.94e-08 -3.38e-08 -2.42e-07 -8.34e-08 -2.67e-07 erg/cm2
90%_error_hi 1.64e-08 1.92e-08 3.37e-08 2.75e-07 8.40e-08 2.94e-07 erg/cm2
Peak flux PL 2.36e-01 3.65e-01 4.24e-01 9.47e-01 1.30e+00 1.97e+00 ph/cm2/s
90%_error_low -6.60e-02 -6.40e-02 -5.08e-02 -2.50e-01 -1.57e-01 -2.65e-01 ph/cm2/s
90%_error_hi 7.39e-02 6.21e-02 5.03e-02 3.14e-01 1.57e-01 2.90e-01 ph/cm2/s
Fluence CPL 1.29e-07 2.84e-07 4.38e-07 8.68e-07 1.16e-06 1.72e-06 erg/cm2
90%_error_low -1.89e-08 -2.30e-08 -3.65e-08 -4.06e-07 -9.64e-08 -4.12e-07 erg/cm2
90%_error_hi 1.93e-08 2.36e-08 3.71e-08 6.10e-07 9.54e-08 9.88e-07 erg/cm2
Peak flux CPL 2.36e-01 3.65e-01 4.24e-01 9.37e-01 1.30e+00 2.08e+00 ph/cm2/s
90%_error_low -6.62e-02 -6.41e-02 -5.09e-02 N/A -1.57e-01 -4.33e-01 ph/cm2/s
90%_error_hi 7.38e-02 6.21e-02 5.05e-02 N/A 1.57e-01 1.75e-01 ph/cm2/s
======================================================================
Image
Pre-slew 15.0-350.0 keV image (Event data)
#   RAcent    DECcent   POSerr    Theta     Phi              Peak Cts       SNR   Name
  254.8556   -33.5842   0.0069    12.4793    43.2912         1.4608360     27.730 TRIG_01116441

Foreground time interval of the image:
 -0.148  17.621 (delta_t =  17.769 [sec])
Background time interval of the image:
-239.680  -0.148 (delta_t = 239.532 [sec])
Light Curves
Note: The mask-weighted lightcurves have units of either count/det or counts/sec/det, where a det is 0.4 x 0.4 = 0.16 sq cm.
Full-time range; 1 s binning
Other quick-look light curves:
- 64 ms binning (zoomed)
- 16 ms binning (zoomed)
- 8 ms binning (zoomed)
- 2 ms binning (zoomed)
- SN=5 or 10 s binning (full-time range)
- Raw light curve
Spectra
- 64 ms binning (zoomed)
- 16 ms binning (zoomed)
- 8 ms binning (zoomed)
- 2 ms binning (zoomed)
- SN=5 or 10 s binning (full-time range)
- Raw light curve
Spectra
Notes:
- 1) The fitting includes the systematic errors.
- 2) When the burst includes telescope slew time periods, the fitting uses an average response file made from multiple 5-s response files through out the slew time plus single time preiod for the non-slew times, and weighted by the total counts in the corresponding time period using addrmf. An average response file is needed becuase a spectral fit using the pre-slew DRM will introduce some errors in both a spectral shape and a normalization if the PHA file contains a lot of the slew/post-slew time interval.
- 3) For fits to more complicated models (e.g. a power-law over a cutoff power-law), the BAT team has decided to require a chi-square improvement of more than 6 for each extra dof.
Time averaged spectrum fit using the average DRM
Power-law model

Time interval is from   -0.148 sec. to   42.172 sec.

Spectral model in power-law:
------------------------------------------------------------
Parameters  : value       lower 90%   higher 90%
Photon index: -1.35758     ( -0.112202   0.112959 )
Norm@50keV  : 2.89559E-03    ( -0.000183862   0.000183779 )
------------------------------------------------------------
#Fit statistic  : Chi-Squared                   73.41     using 59 bins.
 Reduced chi-squared = 1.28789
# Null hypothesis probability of 7.06e-02 with 57 degrees of freedom

Photon flux (15-150 keV)    in 42.32 sec: 0.349389 ( -0.022965  0.023008 ) ph/cm2/s
Energy fluence (15-150 keV)             : 1.19496e-06 ( -8.34487e-08  8.39917e-08 ) ergs/cm2
Cutoff power-law model

Time interval is from   -0.148 sec. to   42.172 sec.
Spectral model in the cutoff power-law:
------------------------------------------------------------
Parameters  : value       lower 90%   higher 90%
Photon index: -1.00952     ( -0.394883   0.50159 )
Epeak [keV] : 144.007      ( -57.5944 -144.041 )
Norm@50keV  : 4.32107E-03    ( -0.0015217   0.00326071 )
------------------------------------------------------------
#Fit statistic  : Chi-Squared                   71.67     using 59 bins.
 Reduced chi-squared = 1.27982
# Null hypothesis probability of 7.74e-02 with 56 degrees of freedom

Photon flux (15-150 keV)    in 42.32 sec: 0.343463 ( -0.024246  0.024213 ) ph/cm2/s
Energy fluence (15-150 keV)             : 1.15978e-06 ( -9.64067e-08  9.53707e-08 ) ergs/cm2
1-s peak spectrum fit
Power-law model

Time interval is from   -0.076 sec. to    0.924 sec.

Spectral model in power-law:
------------------------------------------------------------
Parameters  : value       lower 90%   higher 90%
Photon index: -0.78456     ( -0.232652   0.247336 )
Norm@50keV  : 1.13388E-02    ( -0.00143196   0.00139311 )
------------------------------------------------------------
#Fit statistic  : Chi-Squared                   51.02     using 59 bins.
 Reduced chi-squared = 0.895088
# Null hypothesis probability of 6.98e-01 with 57 degrees of freedom

Photon flux (15-150 keV)    in 1 sec: 1.30396 ( -0.15694  0.15745 ) ph/cm2/s
Energy fluence (15-150 keV)             : 1.33386e-07 ( -1.66459e-08  1.67207e-08 ) ergs/cm2
Cutoff power-law model

Time interval is from   -0.076 sec. to    0.924 sec.
Spectral model in the cutoff power-law:
------------------------------------------------------------
Parameters  : value       lower 90%   higher 90%
Photon index: -0.778049     ( -0.219208   0.2665 )
Epeak [keV] : 1.00000E+04      ( -10000 -10000 )
Norm@50keV  : 1.14211E-02    ( -0.0014371   0.00130132 )
------------------------------------------------------------
#Fit statistic  : Chi-Squared                   51.08     using 59 bins.
 Reduced chi-squared = 0.912143
# Null hypothesis probability of 6.61e-01 with 56 degrees of freedom

Photon flux (15-150 keV)    in 1 sec: 1.30382 ( -0.15725  0.15711 ) ph/cm2/s
Energy fluence (15-150 keV)             : 1.3326e-07 ( -1.65952e-08  1.67637e-08 ) ergs/cm2
Time-resolved spectra
Distribution
T90 vs. Hardness ratio plot

T90                                   = N/A sec.
Hardness ratio (energy fluence ratio) = N/A
S(15-50 keV) vs. S(50-150 keV) plot

S(15-50 keV)  = N/A
S(50-150 keV) = N/A
The dash-dotted line and the dashed line traces the fluences calculated from the Band function with Epeak = 15 and 150 keV, respectively. Both lines assume a canonical values of alpha = -1 and beta = -2.5.
Mask shadow pattern
IMX = 1.610911034732715E-01, IMY = -1.517577110956456E-01
Spacecraft aspect plot

Bright source in the pre-burst/pre-slew/post-slew images
Pre-burst image of 15-350 keV band
Time interval of the image:
-239.680000 -0.148000

# RAcent  DECcent POSerr Theta    Phi  PeakCts   SNR AngSep     Name
#  [deg]    [deg]    ['] [deg]  [deg]                   [']
186.7346 -62.8520    6.0  39.4 -108.2   2.2630   2.0    5.3	GX 301-2
245.0058 -15.6276    0.8  30.7   18.4   7.1681  14.8    1.7	Sco X-1
256.0129 -37.7967    2.5   8.6   54.3   1.6348   4.7    3.1	4U 1700-377
256.3864 -36.6283    0.0   9.8   53.6   1.2458   3.6   12.5	GX 349+2
262.8358 -24.7230    5.7  22.9   57.9  -0.8617  -2.0    9.5	GX 1+4
264.4502 -44.4337    0.0   9.1  116.9   0.3709   1.0   12.6	4U 1735-44
270.2815 -25.1114    2.8  25.5   73.2   2.0095   4.1    1.9	GX 5-1
270.2001 -25.7008    5.7  25.0   73.7   0.9393   2.0    6.1	GRS 1758-258
274.0719 -13.9620    5.8  37.0   69.0   2.3184   2.0    5.9	GX 17+2
275.9198 -30.5700    0.0  24.2   90.5   0.4433   0.8   12.2	H1820-303
285.0093 -24.7684   87.4  34.0   94.3   0.1044   0.1    9.2	HT1900.1-2455
263.0606 -33.9224    9.7  14.7   71.1   0.4495   1.2    6.4	GX 354-0
314.5762 -44.9886    2.4  42.9  143.7   4.8969   4.8 ------	UNKNOWN
310.4903 -46.9949    2.8  39.5  144.9   3.3846   4.1 ------	UNKNOWN
259.1886 -35.1358    2.9  12.1   61.6   1.2506   4.0 ------	UNKNOWN
352.4221 -58.9168    2.7  56.8  173.9   5.8376   4.2 ------	UNKNOWN
227.3310 -16.8243    3.9  35.4  -11.9   1.2919   3.0 ------	UNKNOWN
228.0111 -29.2642    3.0  24.9  -25.3   1.4274   3.9 ------	UNKNOWN
Pre-slew background subtracted image of 15-350 keV band
Time interval of the image:
-0.148000 17.620640

# RAcent  DECcent POSerr Theta    Phi  PeakCts   SNR AngSep     Name
#  [deg]    [deg]    ['] [deg]  [deg]                   [']
186.6205 -62.6246    9.7  39.5 -107.8   0.1914   1.2    8.8	GX 301-2
245.0753 -15.5385    5.9  30.8   18.6  -0.1293  -1.9    8.2	Sco X-1
256.0579 -37.8237    4.5   8.6   54.6  -0.1365  -2.5    3.6	4U 1700-377
256.4842 -36.2179    0.0  10.3   53.2   0.0915   1.7   12.5	GX 349+2
263.0163 -24.7397    6.7  23.0   58.3  -0.1149  -1.7    0.5	GX 1+4
264.7677 -44.2389    0.0   9.3  116.0  -0.0878  -1.7   12.7	4U 1735-44
270.5137 -25.0809    0.0  25.6   73.5  -0.0639  -0.8   12.5	GX 5-1
270.2242 -25.7652    8.2  24.9   73.9   0.1112   1.4    4.4	GRS 1758-258
273.9052 -14.0736    9.5  36.8   68.8  -0.1720  -1.2    6.3	GX 17+2
275.9059 -30.2349   18.7  24.4   89.9  -0.0457  -0.6    8.0	H1820-303
285.0394 -24.8927   12.7  33.9   94.5   0.1037   0.9    1.7	HT1900.1-2455
262.8184 -33.7605    4.7  14.7   70.1   0.1477   2.5    9.6	GX 354-0
254.8556 -33.5842    0.4  12.5   43.3   1.4609  27.8 ------	UNKNOWN
203.6501 -13.9711    2.1  51.3  -36.5   1.0366   5.6 ------	UNKNOWN
Post-slew image of 15-350 keV band
Time interval of the image:
80.020600 962.383100

# RAcent  DECcent POSerr Theta    Phi  PeakCts   SNR AngSep     Name
#  [deg]    [deg]    ['] [deg]  [deg]                   [']
186.5747 -62.6170   49.5  50.8 -138.1   1.2725   0.2    9.5	GX 301-2
244.9894 -15.6547    0.5  20.0  -20.5  27.4043  21.5    1.0	Sco X-1
255.9906 -37.8454    0.6   4.4  177.0  21.2714  18.0    0.2	4U 1700-377
256.4466 -36.4315    5.0   3.1  164.9   2.7582   2.3    0.7	GX 349+2
262.8657 -24.8436    7.4  11.2   49.0   1.8689   1.6    9.8	GX 1+4
264.6336 -44.3164   14.1  13.1  156.2   1.0188   0.8    9.3	4U 1735-44
268.5075  -1.4552    6.0  34.6   32.9  -4.0688  -1.9    8.4	SW J1753.5-0127
270.0792 -24.9795    0.0  15.8   69.4  -1.4034  -1.0   12.6	GX 5-1
270.0964 -25.6438    0.0  15.4   71.4  -1.8369  -1.3   12.6	GRS 1758-258
274.0350 -13.9265    4.0  26.2   54.5   5.2390   2.9    6.8	GX 17+2
276.0580 -30.4770    5.7  18.2   94.4   2.9320   2.0    9.5	H1820-303
285.2126 -24.9121    9.1  27.7   88.3  -2.5285  -1.3    9.6	HT1900.1-2455
263.1404 -33.7119    7.0   6.9  101.8   1.8989   1.6   10.5	GX 354-0
255.4341  20.6696    2.5  54.3    9.1  12.9587   4.6 ------	UNKNOWN
250.5265  21.0413    2.6  54.8    3.4  12.2025   4.5 ------	UNKNOWN
243.3844   0.0022    4.2  35.3  -11.8   4.5494   2.8 ------	UNKNOWN
229.0279  17.9528    2.1  57.1  -21.2  23.1793   5.5 ------	UNKNOWN
163.1119 -77.3096    3.3  57.7 -156.5  28.2698   3.5 ------	UNKNOWN
219.8935  -2.7769    3.7  44.9  -45.8  10.6829   3.2 ------	UNKNOWN