Analysis Summary
Notes:
- 1) No attempt has been made to eliminate the non-significant decimal places.
- 2) This batgrbproduct analysis is done using the HEASARC data.
- 3) This batgrbproduct analysis is using the flight position for the mask-weighting calculation.
======================================================================
BAT GRB EVENT DATA PROCESSING REPORT
Process Script Ver: batgrbproduct v2.48
Process Start Time: Wed Jun 14 12:34:54 EDT 2023
Host Name: batproc1
Current Working Dir: /local/data/bat1/alien/Swift_3rdBATcatalog/event/batevent_reproc/trigger1116441
======================================================================
Trigger: 01116441 Segment: 000
BAT Trigger Time: 679616711.68 [s; MET]
Trigger Stop: 679616712.704 [s; MET]
UTC: 2022-07-15T22:24:42.178080 [includes UTCF correction]
Where From?: TDRSS position message
BAT
RA: 254.88862245431 Dec: -33.5970201018269 [deg; J2000]
Catalogged Source?: NO
Point Source?: YES
GRB Indicated?: YES [ by BAT flight software ]
Image S/N Ratio: 11.46
Image Trigger?: NO
Rate S/N Ratio: 24.8596057893121 [ if not an image trigger ]
Image S/N Ratio: 11.46
Analysis Position: [ source = BAT ]
RA: 254.88862245431 Dec: -33.5970201018269 [deg; J2000]
Refined Position: [ source = BAT pre-slew burst ]
RA: 254.855500913043 Dec: -33.5838779953871 [deg; J2000]
{ 16h 59m 25.3s , -33d 35' 02.0" }
+/- 1.06660894523745 [arcmin] (estimated 90% radius based on SNR)
+/- 0.489443145922677 [arcmin] (formal 1-sigma fit error)
SNR: 27.7402851202301
Angular difference between the analysis and refined position is 1.833647 arcmin
Partial Coding Fraction: 0.953125 [ including projection effects ]
Duration
T90: 40.4079998731613 +/- 1.21540936134993
Measured from: 0.400000095367432
to: 40.8079999685287 [s; relative to TRIGTIME]
T50: 15.1599999666214 +/- 3.21611759045006
Measured from: 3.75200009346008
to: 18.9120000600815 [s; relative to TRIGTIME]
Fluence
Peak Flux (peak 1 second)
Measured from: -0.0759999752044678
to: 0.924000024795532 [s; relative to TRIGTIME]
Total Fluence
Measured from: -0.148000001907349
to: 42.1720000505447 [s; relative to TRIGTIME]
Band 1 Band 2 Band 3 Band 4
15-25 25-50 50-100 100-350 keV
Total 0.484280 0.719838 0.539314 0.148205
0.043959 0.041835 0.035174 0.029207 [error]
Peak 0.038389 0.055216 0.062142 0.035530
0.006906 0.007035 0.006610 0.005433 [error]
[ fluence units of on-axis counts / fully illuminated detector ]
======================================================================
====== Table of the duration information =============================
Value tstart tstop
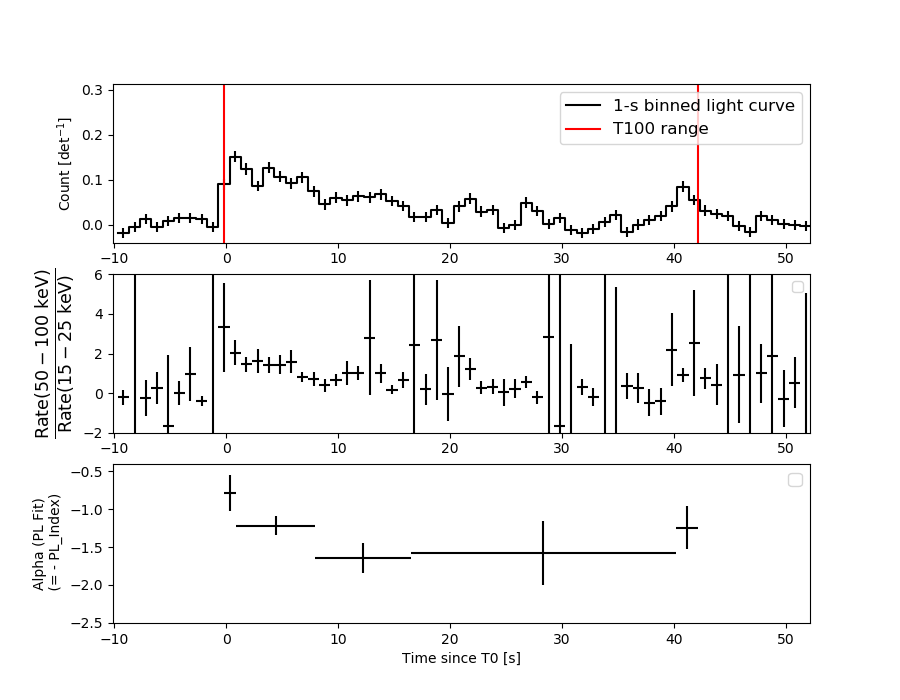
T100 42.320 -0.148 42.172
T90 40.408 0.400 40.808
T50 15.160 3.752 18.912
Peak 1.000 -0.076 0.924
====== Spectral Analysis Summary =====================================
Model : spectral model: simple power-law (PL) and cutoff power-law (CPL)
Ph_index : photon index: E^{Ph_index}
Ph_90err : 90% error of the photon index
Epeak : Epeak in keV
Epeak_90err: 90% error of Epeak
Norm : normalization at 50 keV in both the PL model and CPL model
Nomr_90err : 90% error of the normalization
chi2 : Chi-Squared
dof : degree of freedo
=== Time-averaged spectral analysis ===
(Best model with acceptable fit: N/A)
Model Ph_index Ph_90err_low Ph_90err_hi Epeak Epeak_90err_low Epeak_90err_hi Norm Nomr_90err_low Norm_90err_hi chi2 dof
PL -1.358 -0.112 0.113 - - - 2.89e-03 -1.84e-04 1.84e-04 73.480 57
CPL -1.005 -0.399 0.502 142.557 -56.511 -142.557 4.34e-03 -1.54e-03 3.29e-03 71.690 56
=== 1-s peak spectral analysis ===
(Best model with acceptable fit: PL)
Model Ph_index Ph_90err_low Ph_90err_hi Epeak Epeak_90err_low Epeak_90err_hi Norm Nomr_90err_low Norm_90err_hi chi2 dof
PL -0.784 -0.233 0.248 - - - 1.13e-02 -1.43e-03 1.39e-03 51.010 57
CPL -0.794 -0.218 0.268 9999.360 -9999.360 -9999.360 1.14e-02 -1.47e-03 1.26e-03 51.090 56
=== Fluence/Peak Flux Summary ===
Model Band1 Band2 Band3 Band4 Band5 Total
15-25 25-50 50-100 100-350 15-150 15-350 keV
Fluence PL 1.37e-07 2.74e-07 4.28e-07 1.47e-06 1.19e-06 2.31e-06 erg/cm2
90%_error_low -1.58e-08 -1.93e-08 -3.38e-08 -2.42e-07 -8.34e-08 -2.67e-07 erg/cm2
90%_error_hi 1.64e-08 1.92e-08 3.37e-08 2.74e-07 8.40e-08 2.93e-07 erg/cm2
Peak flux PL 2.36e-01 3.65e-01 4.23e-01 9.46e-01 1.30e+00 1.97e+00 ph/cm2/s
90%_error_low -6.60e-02 -6.40e-02 -5.08e-02 -2.50e-01 -1.57e-01 -2.65e-01 ph/cm2/s
90%_error_hi 7.39e-02 6.21e-02 5.03e-02 3.14e-01 1.57e-01 2.90e-01 ph/cm2/s
Fluence CPL 1.29e-07 2.84e-07 4.38e-07 8.61e-07 1.16e-06 1.71e-06 erg/cm2
90%_error_low -1.89e-08 -2.30e-08 -3.65e-08 -4.02e-07 -9.64e-08 -4.09e-07 erg/cm2
90%_error_hi 1.93e-08 2.36e-08 3.71e-08 6.54e-07 9.54e-08 6.03e-07 erg/cm2
Peak flux CPL 2.36e-01 3.65e-01 4.24e-01 9.37e-01 1.30e+00 2.08e+00 ph/cm2/s
90%_error_low -6.62e-02 -6.41e-02 -5.08e-02 N/A -1.57e-01 -4.33e-01 ph/cm2/s
90%_error_hi 7.37e-02 6.21e-02 5.05e-02 N/A 1.57e-01 1.75e-01 ph/cm2/s
======================================================================
Image
Pre-slew 15.0-350.0 keV image (Event data)
#   RAcent    DECcent   POSerr    Theta     Phi              Peak Cts       SNR   Name
  254.8555   -33.5839   0.0069    12.4796    43.2906         1.4608527     27.740 TRIG_01116441

Foreground time interval of the image:
 -0.148  17.621 (delta_t =  17.769 [sec])
Background time interval of the image:
-239.680  -0.148 (delta_t = 239.532 [sec])
Light Curves
Note: The mask-weighted lightcurves have units of either count/det or counts/sec/det, where a det is 0.4 x 0.4 = 0.16 sq cm.
Full-time range; 1 s binning
Other quick-look light curves:
- 64 ms binning (zoomed)
- 16 ms binning (zoomed)
- 8 ms binning (zoomed)
- 2 ms binning (zoomed)
- SN=5 or 10 s binning (full-time range)
- Raw light curve
Spectra
- 64 ms binning (zoomed)
- 16 ms binning (zoomed)
- 8 ms binning (zoomed)
- 2 ms binning (zoomed)
- SN=5 or 10 s binning (full-time range)
- Raw light curve
Spectra
Notes:
- 1) The fitting includes the systematic errors.
- 2) When the burst includes telescope slew time periods, the fitting uses an average response file made from multiple 5-s response files through out the slew time plus single time preiod for the non-slew times, and weighted by the total counts in the corresponding time period using addrmf. An average response file is needed becuase a spectral fit using the pre-slew DRM will introduce some errors in both a spectral shape and a normalization if the PHA file contains a lot of the slew/post-slew time interval.
- 3) For fits to more complicated models (e.g. a power-law over a cutoff power-law), the BAT team has decided to require a chi-square improvement of more than 6 for each extra dof.
Time averaged spectrum fit using the average DRM
Power-law model
Time interval is from   -0.148 sec. to   42.172 sec.

Spectral model in power-law:
------------------------------------------------------------
Parameters  : value       lower 90%   higher 90%
Photon index: -1.35819     ( -0.112224   0.112874 )
Norm@50keV  : 2.89411E-03    ( -0.000183883   0.000183725 )
------------------------------------------------------------
#Fit statistic  : Chi-Squared                   73.48     using 59 bins.
 Reduced chi-squared = 1.28912
# Null hypothesis probability of 6.99e-02 with 57 degrees of freedom

Photon flux (15-150 keV)    in 42.32 sec: 0.349258 ( -0.022958  0.023 ) ph/cm2/s
Energy fluence (15-150 keV)             : 1.19417e-06 ( -8.34203e-08  8.39629e-08 ) ergs/cm2
Cutoff power-law model
Time interval is from   -0.148 sec. to   42.172 sec.
Spectral model in the cutoff power-law:
------------------------------------------------------------
Parameters  : value       lower 90%   higher 90%
Photon index: -1.00543     ( -0.399018   0.502506 )
Epeak [keV] : 142.557      ( -56.5442 -142.59 )
Norm@50keV  : 4.34349E-03    ( -0.00154324   0.00328875 )
------------------------------------------------------------
#Fit statistic  : Chi-Squared                   71.69     using 59 bins.
 Reduced chi-squared = 1.28018
# Null hypothesis probability of 7.72e-02 with 56 degrees of freedom

Photon flux (15-150 keV)    in 42.32 sec: 0.343260 ( -0.024239  0.024207 ) ph/cm2/s
Energy fluence (15-150 keV)             : 1.15847e-06 ( -9.64202e-08  9.54071e-08 ) ergs/cm2
1-s peak spectrum fit
Power-law model

Time interval is from   -0.076 sec. to    0.924 sec.

Spectral model in power-law:
------------------------------------------------------------
Parameters  : value       lower 90%   higher 90%
Photon index: -0.784164     ( -0.232793   0.247507 )
Norm@50keV  : 1.13267E-02    ( -0.00143159   0.00139265 )
------------------------------------------------------------
#Fit statistic  : Chi-Squared                   51.01     using 59 bins.
 Reduced chi-squared = 0.894912
# Null hypothesis probability of 6.98e-01 with 57 degrees of freedom

Photon flux (15-150 keV)    in 1 sec: 1.30259 ( -0.15688  0.15738 ) ph/cm2/s
Energy fluence (15-150 keV)             : 1.33266e-07 ( -1.66414e-08  1.67128e-08 ) ergs/cm2
Cutoff power-law model
Time interval is from   -0.076 sec. to    0.924 sec.
Spectral model in the cutoff power-law:
------------------------------------------------------------
Parameters  : value       lower 90%   higher 90%
Photon index: -0.777649     ( -0.219368   0.266654 )
Epeak [keV] : 1.00000E+04      ( -10000 -10000 )
Norm@50keV  : 1.14089E-02    ( -0.00143673   0.00130069 )
------------------------------------------------------------
#Fit statistic  : Chi-Squared                   51.07     using 59 bins.
 Reduced chi-squared = 0.911964
# Null hypothesis probability of 6.61e-01 with 56 degrees of freedom

Photon flux (15-150 keV)    in 1 sec: 1.30244 ( -0.15717  0.15705 ) ph/cm2/s
Energy fluence (15-150 keV)             : 1.3314e-07 ( -1.65906e-08  1.6756e-08 ) ergs/cm2
Time-resolved spectra
Distribution
T90 vs. Hardness ratio plot
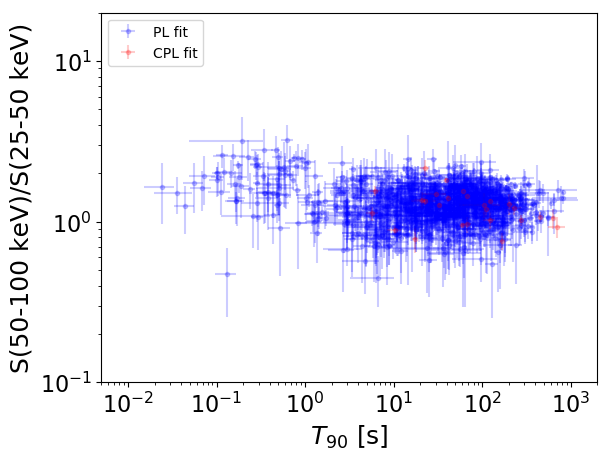
T90                                   = N/A sec.
Hardness ratio (energy fluence ratio) = N/A
S(15-50 keV) vs. S(50-150 keV) plot
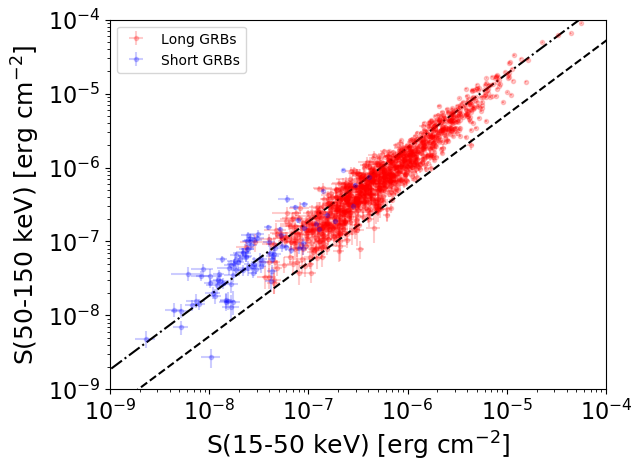
S(15-50 keV)  = N/A
S(50-150 keV) = N/A
The dash-dotted line and the dashed line traces the fluences calculated from the Band function with Epeak = 15 and 150 keV, respectively. Both lines assume a canonical values of alpha = -1 and beta = -2.5.
Mask shadow pattern
IMX = 1.610963696020557E-01, IMY = -1.517595504118485E-01
Spacecraft aspect plot
Bright source in the pre-burst/pre-slew/post-slew images
Pre-burst image of 15-350 keV band
Time interval of the image:
-239.680000 -0.148000

# RAcent  DECcent POSerr Theta    Phi  PeakCts   SNR AngSep     Name
#  [deg]    [deg]    ['] [deg]  [deg]                   [']
186.7250 -62.8581    5.9  39.4 -108.2   2.2779   2.0    5.6	GX 301-2
245.0059 -15.6279    0.8  30.7   18.4   7.1493  14.7    1.7	Sco X-1
256.0113 -37.7973    2.5   8.6   54.3   1.6148   4.6    3.0	4U 1700-377
256.3864 -36.6283    0.0   9.8   53.6   1.2257   3.6   12.5	GX 349+2
262.8340 -24.7265    5.8  22.9   57.9  -0.8454  -2.0    9.6	GX 1+4
264.4868 -44.4368    8.2   9.1  116.9   0.4999   1.4   11.0	4U 1735-44
270.2825 -25.1113    2.8  25.5   73.2   2.0132   4.2    1.9	GX 5-1
270.1999 -25.6996    5.7  25.0   73.7   0.9479   2.1    6.1	GRS 1758-258
274.0719 -13.9620    5.8  37.0   69.0   2.3183   2.0    5.9	GX 17+2
275.9198 -30.5700    0.0  24.2   90.5   0.4619   0.9   12.2	H1820-303
285.0091 -24.7675   88.1  34.0   94.3   0.1035   0.1    9.3	HT1900.1-2455
263.0591 -33.9224    9.7  14.7   71.1   0.4516   1.2    6.3	GX 354-0
314.5761 -44.9886    2.4  42.9  143.7   4.8907   4.8 ------	UNKNOWN
310.4916 -46.9959    2.8  39.5  144.9   3.4120   4.1 ------	UNKNOWN
259.2064 -35.1361    2.9  12.1   61.7   1.2447   4.0 ------	UNKNOWN
352.4228 -58.9172    2.7  56.8  173.9   5.8523   4.3 ------	UNKNOWN
227.3472 -16.8322    3.8  35.4  -11.8   1.3284   3.1 ------	UNKNOWN
228.0115 -29.2648    3.0  24.9  -25.3   1.4106   3.8 ------	UNKNOWN
Pre-slew background subtracted image of 15-350 keV band
Time interval of the image:
-0.148000 17.620640

# RAcent  DECcent POSerr Theta    Phi  PeakCts   SNR AngSep     Name
#  [deg]    [deg]    ['] [deg]  [deg]                   [']
186.6204 -62.6246    9.6  39.5 -107.8   0.1941   1.2    8.8	GX 301-2
245.0753 -15.5385    5.9  30.8   18.6  -0.1306  -2.0    8.2	Sco X-1
256.0599 -37.8224    4.5   8.6   54.6  -0.1375  -2.6    3.7	4U 1700-377
256.4842 -36.2179    0.0  10.3   53.2   0.0916   1.7   12.5	GX 349+2
263.0163 -24.7398    6.7  23.0   58.3  -0.1141  -1.7    0.5	GX 1+4
264.7677 -44.2389    0.0   9.3  116.0  -0.0874  -1.7   12.7	4U 1735-44
270.5137 -25.0809    0.0  25.6   73.5  -0.0632  -0.8   12.5	GX 5-1
270.2267 -25.7628    8.0  24.9   73.9   0.1138   1.4    4.3	GRS 1758-258
273.9051 -14.0737    9.5  36.8   68.8  -0.1721  -1.2    6.3	GX 17+2
275.9061 -30.2349   17.6  24.4   89.9  -0.0485  -0.7    8.0	H1820-303
285.0420 -24.8929   13.3  33.9   94.5   0.0988   0.9    1.7	HT1900.1-2455
262.8212 -33.7586    4.7  14.7   70.1   0.1467   2.4    9.5	GX 354-0
254.8555 -33.5839    0.4  12.5   43.3   1.4609  27.8 ------	UNKNOWN
203.6501 -13.9711    2.1  51.3  -36.5   1.0366   5.6 ------	UNKNOWN
Post-slew image of 15-350 keV band
Time interval of the image:
80.020600 962.383100

# RAcent  DECcent POSerr Theta    Phi  PeakCts   SNR AngSep     Name
#  [deg]    [deg]    ['] [deg]  [deg]                   [']
186.5747 -62.6171   50.1  50.8 -138.1   1.2569   0.2    9.5	GX 301-2
244.9898 -15.6547    0.5  20.0  -20.5  27.4449  21.6    1.1	Sco X-1
255.9910 -37.8452    0.6   4.4  177.0  21.3238  18.0    0.2	4U 1700-377
256.4384 -36.4334    4.9   3.1  165.0   2.8033   2.3    0.6	GX 349+2
262.8656 -24.8433    7.2  11.2   49.0   1.9210   1.6    9.8	GX 1+4
264.6244 -44.3182   16.7  13.1  156.2   0.8627   0.7    9.4	4U 1735-44
268.5075  -1.4552    5.8  34.6   32.9  -4.1900  -2.0    8.4	SW J1753.5-0127
270.0792 -24.9795    0.0  15.8   69.4  -1.3937  -1.0   12.6	GX 5-1
270.0964 -25.6438    0.0  15.4   71.4  -1.9081  -1.3   12.6	GRS 1758-258
274.0414 -13.9252    4.4  26.2   54.5   4.7754   2.6    7.0	GX 17+2
276.0541 -30.4783    5.6  18.2   94.4   2.9976   2.0    9.4	H1820-303
285.1893 -24.8641    5.3  27.7   88.2  -4.3864  -2.2    9.0	HT1900.1-2455
263.1402 -33.7115    7.1   6.9  101.8   1.8963   1.6   10.6	GX 354-0
255.4341  20.6696    2.5  54.3    9.1  12.9573   4.6 ------	UNKNOWN
250.5265  21.0413    2.6  54.8    3.4  12.1996   4.5 ------	UNKNOWN
243.3861   0.0031    4.0  35.3  -11.8   4.6793   2.9 ------	UNKNOWN
229.0279  17.9524    2.1  57.1  -21.2  23.4173   5.5 ------	UNKNOWN
163.1085 -77.3110    3.3  57.7 -156.5  27.8925   3.5 ------	UNKNOWN
219.8927  -2.7777    3.7  44.9  -45.8  10.6012   3.1 ------	UNKNOWN