Analysis Summary
Notes:
- 1) No attempt has been made to eliminate the non-significant decimal places.
- 2) This batgrbproduct analysis is done using the HEASARC data.
- 3) This batgrbproduct analysis is using the flight position for the mask-weighting calculation.
======================================================================
BAT GRB EVENT DATA PROCESSING REPORT
Process Script Ver: batgrbproduct v2.48
Process Start Time: Wed Jun 14 12:32:44 EDT 2023
Host Name: batproc1
Current Working Dir: /local/data/bat1/alien/Swift_3rdBATcatalog/event/batevent_reproc/trigger1119268
======================================================================
Trigger: 01119268 Segment: 000
BAT Trigger Time: 681502149.44 [s; MET]
Trigger Stop: 681502150.464 [s; MET]
UTC: 2022-08-06T18:08:39.809960 [includes UTCF correction]
Where From?: TDRSS position message
BAT
RA: 260.873417061978 Dec: -26.0230362270796 [deg; J2000]
Catalogged Source?: NO
Point Source?: YES
GRB Indicated?: YES [ by BAT flight software ]
Image S/N Ratio: 9.93
Image Trigger?: NO
Rate S/N Ratio: 14.1774468787578 [ if not an image trigger ]
Image S/N Ratio: 9.93
Analysis Position: [ source = BAT ]
RA: 260.873417061978 Dec: -26.0230362270796 [deg; J2000]
Refined Position: [ source = BAT pre-slew burst ]
RA: 260.853751780465 Dec: -26.0236492102056 [deg; J2000]
{ 17h 23m 24.9s , -26d 01' 25.1" }
+/- 2.05369290554543 [arcmin] (estimated 90% radius based on SNR)
+/- 0.957546966420791 [arcmin] (formal 1-sigma fit error)
SNR: 10.8802554055448
Angular difference between the analysis and refined position is 1.060929 arcmin
Partial Coding Fraction: 1.015625 [ including projection effects ]
Duration
T90: 4.70799994468689 +/- 2.0652602451552
Measured from: -0.0680000782012939
to: 4.6399998664856 [s; relative to TRIGTIME]
T50: 1.75599992275238 +/- 0.837147518388818
Measured from: 0.639999985694885
to: 2.39599990844727 [s; relative to TRIGTIME]
Fluence
Peak Flux (peak 1 second)
Measured from: 0.763999938964844
to: 1.76399993896484 [s; relative to TRIGTIME]
Total Fluence
Measured from: -0.300000071525574
to: 6.66399991512299 [s; relative to TRIGTIME]
Band 1 Band 2 Band 3 Band 4
15-25 25-50 50-100 100-350 keV
Total 0.195070 0.134494 0.016889 0.006139
0.020001 0.017805 0.014548 0.012580 [error]
Peak 0.069060 0.049788 0.009237 0.001297
0.008295 0.007237 0.005633 0.004682 [error]
[ fluence units of on-axis counts / fully illuminated detector ]
======================================================================
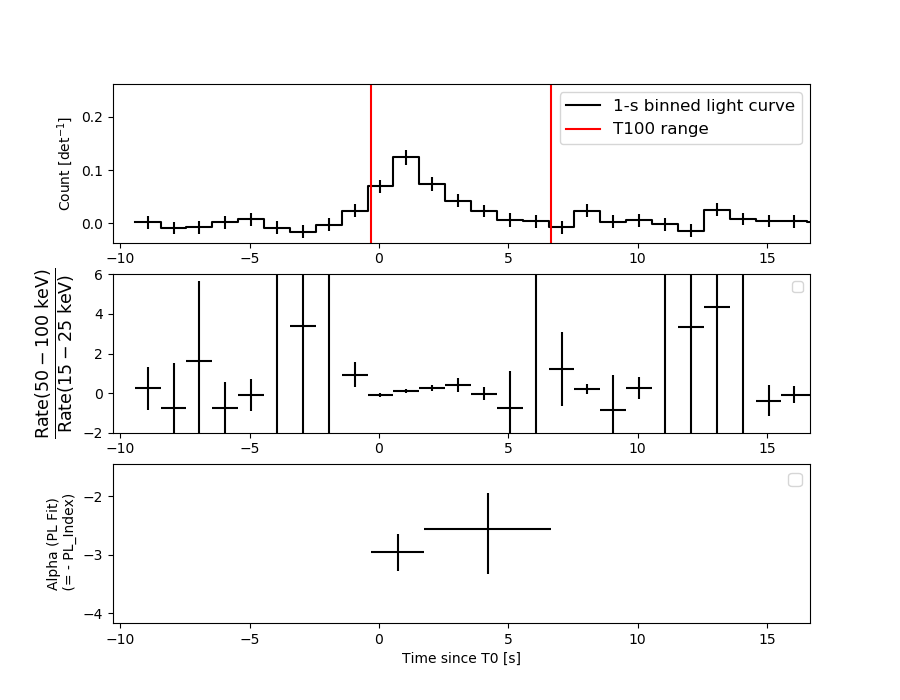
====== Table of the duration information =============================
Value tstart tstop
T100 6.964 -0.300 6.664
T90 4.708 -0.068 4.640
T50 1.756 0.640 2.396
Peak 1.000 0.764 1.764
====== Spectral Analysis Summary =====================================
Model : spectral model: simple power-law (PL) and cutoff power-law (CPL)
Ph_index : photon index: E^{Ph_index}
Ph_90err : 90% error of the photon index
Epeak : Epeak in keV
Epeak_90err: 90% error of Epeak
Norm : normalization at 50 keV in both the PL model and CPL model
Nomr_90err : 90% error of the normalization
chi2 : Chi-Squared
dof : degree of freedo
=== Time-averaged spectral analysis ===
(Best model with acceptable fit: PL)
Model Ph_index Ph_90err_low Ph_90err_hi Epeak Epeak_90err_low Epeak_90err_hi Norm Nomr_90err_low Norm_90err_hi chi2 dof
PL -2.805 -0.346 0.308 - - - 1.86e-03 -4.94e-04 5.14e-04 40.040 57
CPL -0.204 -1.347 4.306 20.213 -20.213 6.025 1.25e-01 -1.25e-01 1.55e+02 34.060 56
=== 1-s peak spectral analysis ===
(Best model with acceptable fit: PL)
Model Ph_index Ph_90err_low Ph_90err_hi Epeak Epeak_90err_low Epeak_90err_hi Norm Nomr_90err_low Norm_90err_hi chi2 dof
PL -2.867 -0.473 0.394 - - - 4.45e-03 -1.49e-03 1.52e-03 50.840 57
CPL -1.967 -0.027 1.856 1.208 -0.807 22.340 1.75e-02 -6.57e-03 1.02e-02 51.040 56
=== Fluence/Peak Flux Summary ===
Model Band1 Band2 Band3 Band4 Band5 Total
15-25 25-50 50-100 100-350 15-150 15-350 keV
Fluence PL 5.74e-08 4.83e-08 2.76e-08 2.35e-08 1.44e-07 1.57e-07 erg/cm2
90%_error_low -9.12e-09 -8.68e-09 -9.23e-09 -1.19e-08 -2.45e-08 -3.07e-08 erg/cm2
90%_error_hi 9.17e-09 8.48e-09 1.07e-08 1.91e-08 2.59e-08 3.57e-08 erg/cm2
Peak flux PL 6.93e-01 3.15e-01 8.64e-02 2.95e-02 1.11e+00 1.12e+00 ph/cm2/s
90%_error_low -1.37e-01 -6.58e-02 -3.54e-02 -1.75e-02 -1.78e-01 -1.81e-01 ph/cm2/s
90%_error_hi 1.39e-01 6.24e-02 4.13e-02 3.00e-02 1.78e-01 1.81e-01 ph/cm2/s
Fluence CPL 5.69e-08 5.52e-08 8.57e-09 8.36e-11 1.21e-07 1.21e-07 erg/cm2
90%_error_low -1.00e-08 -1.16e-08 -6.91e-09 N/A -1.98e-08 -1.98e-08 erg/cm2
90%_error_hi 9.98e-09 1.14e-08 1.50e-08 N/A 2.30e-08 2.31e-08 erg/cm2
Peak flux CPL 6.59e-01 3.31e-01 7.06e-02 7.89e-03 1.08e+00 1.09e+00 ph/cm2/s
90%_error_low -1.27e-01 -4.91e-02 -3.76e-02 -7.89e-03 -1.74e-01 -1.75e-01 ph/cm2/s
90%_error_hi 8.78e-02 7.11e-02 4.84e-02 1.92e-02 1.74e-01 1.73e-01 ph/cm2/s
======================================================================
Image
Pre-slew 15.0-350.0 keV image (Event data)
#   RAcent    DECcent   POSerr    Theta     Phi              Peak Cts       SNR   Name
  260.8538   -26.0236   0.0177     5.6916   -49.0121         0.3633903     10.880 TRIG_01119268

Foreground time interval of the image:
 -0.300   6.664 (delta_t =   6.964 [sec])
Background time interval of the image:
-147.939  -0.300 (delta_t = 147.639 [sec])
Light Curves
Note: The mask-weighted lightcurves have units of either count/det or counts/sec/det, where a det is 0.4 x 0.4 = 0.16 sq cm.
Full-time range; 1 s binning
Other quick-look light curves:
- 64 ms binning (zoomed)
- 16 ms binning (zoomed)
- 8 ms binning (zoomed)
- 2 ms binning (zoomed)
- SN=5 or 10 s binning (full-time range)
- Raw light curve
Spectra
- 64 ms binning (zoomed)
- 16 ms binning (zoomed)
- 8 ms binning (zoomed)
- 2 ms binning (zoomed)
- SN=5 or 10 s binning (full-time range)
- Raw light curve
Spectra
Notes:
- 1) The fitting includes the systematic errors.
- 2) When the burst includes telescope slew time periods, the fitting uses an average response file made from multiple 5-s response files through out the slew time plus single time preiod for the non-slew times, and weighted by the total counts in the corresponding time period using addrmf. An average response file is needed becuase a spectral fit using the pre-slew DRM will introduce some errors in both a spectral shape and a normalization if the PHA file contains a lot of the slew/post-slew time interval.
- 3) For fits to more complicated models (e.g. a power-law over a cutoff power-law), the BAT team has decided to require a chi-square improvement of more than 6 for each extra dof.
Time averaged spectrum fit using the average DRM
Power-law model
Time interval is from   -0.300 sec. to    6.664 sec.

Spectral model in power-law:
------------------------------------------------------------
Parameters  : value       lower 90%   higher 90%
Photon index: -2.8047     ( -0.34629   0.307569 )
Norm@50keV  : 1.86445E-03    ( -0.000494046   0.000513556 )
------------------------------------------------------------
#Fit statistic  : Chi-Squared                   40.04     using 59 bins.
 Reduced chi-squared = 0.702456
# Null hypothesis probability of 9.57e-01 with 57 degrees of freedom

Photon flux (15-150 keV)    in 6.964 sec: 0.446665 ( -0.062169  0.062185 ) ph/cm2/s
Energy fluence (15-150 keV)             : 1.43618e-07 ( -2.45489e-08  2.58623e-08 ) ergs/cm2
Cutoff power-law model
Time interval is from   -0.300 sec. to    6.664 sec.
Spectral model in the cutoff power-law:
------------------------------------------------------------
Parameters  : value       lower 90%   higher 90%
Photon index: 0.418602     ( -1.36784   4.28569 )
Epeak [keV] : 21.6806      ( -20.336 5.90177 )
Norm@50keV  : 0.351386    ( -0.343527   154.998 )
------------------------------------------------------------
#Fit statistic  : Chi-Squared                   33.95     using 59 bins.
 Reduced chi-squared = 0.60625
# Null hypothesis probability of 9.91e-01 with 56 degrees of freedom

Photon flux (15-150 keV)    in 6.964 sec: 0.447366 ( -0.062751  0.061858 ) ph/cm2/s
Energy fluence (15-150 keV)             : 1.20789e-07 ( -1.98363e-08  2.29611e-08 ) ergs/cm2
1-s peak spectrum fit
Power-law model
Time interval is from    0.764 sec. to    1.764 sec.

Spectral model in power-law:
------------------------------------------------------------
Parameters  : value       lower 90%   higher 90%
Photon index: -2.86729     ( -0.472911   0.39443 )
Norm@50keV  : 4.44580E-03    ( -0.00148704   0.00152267 )
------------------------------------------------------------
#Fit statistic  : Chi-Squared                   50.84     using 59 bins.
 Reduced chi-squared = 0.89193
# Null hypothesis probability of 7.04e-01 with 57 degrees of freedom

Photon flux (15-150 keV)    in 1 sec: 1.11231 ( -0.178197  0.17821 ) ph/cm2/s
Energy fluence (15-150 keV)             : 5.04255e-08 ( -9.98002e-09  1.05717e-08 ) ergs/cm2
Cutoff power-law model
Time interval is from    0.764 sec. to    1.764 sec.
Spectral model in the cutoff power-law:
------------------------------------------------------------
Parameters  : value       lower 90%   higher 90%
Photon index: -1.96683     ( -0.0260542   1.85652 )
Epeak [keV] : 1.20779      ( -0.780747 22.3663 )
Norm@50keV  : 1.74946E-02    ( -0.00642967   0.0103788 )
------------------------------------------------------------
#Fit statistic  : Chi-Squared                   51.04     using 59 bins.
 Reduced chi-squared = 0.911429
# Null hypothesis probability of 6.63e-01 with 56 degrees of freedom

Photon flux (15-150 keV)    in 1 sec: 1.08471 ( -0.174346  0.17363 ) ph/cm2/s
Energy fluence (15-150 keV)             : 4.70446e-08 ( -9.54989e-09  1.0206e-08 ) ergs/cm2
Time-resolved spectra
Distribution
T90 vs. Hardness ratio plot
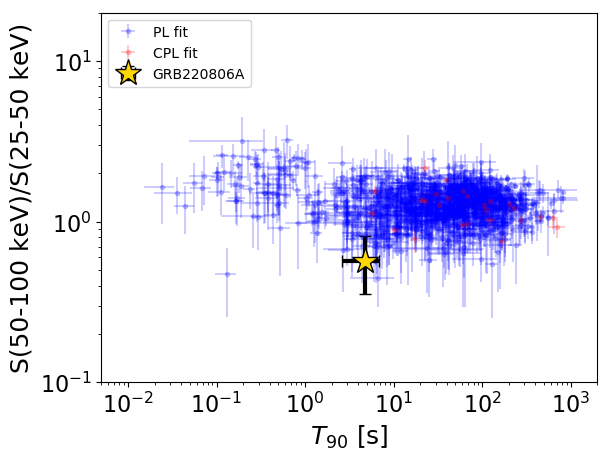
T90                                   = 4.708 sec.
Hardness ratio (energy fluence ratio) = 0.572558606395
S(15-50 keV) vs. S(50-150 keV) plot
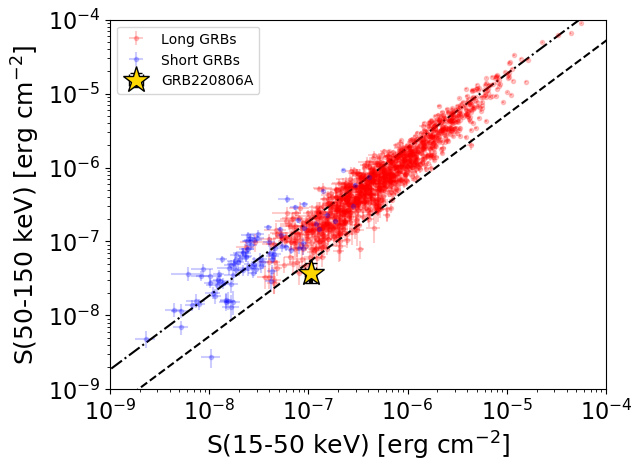
S(15-50 keV)  = 1.0568053e-07
S(50-150 keV) = 3.794022e-08
The dash-dotted line and the dashed line traces the fluences calculated from the Band function with Epeak = 15 and 150 keV, respectively. Both lines assume a canonical values of alpha = -1 and beta = -2.5.
Mask shadow pattern
IMX = 6.537020839191149E-02, IMY = 7.523190730335999E-02
Spacecraft aspect plot
Bright source in the pre-burst/pre-slew/post-slew images
Pre-burst image of 15-350 keV band
Time interval of the image:
-147.939380 -0.300000

# RAcent  DECcent POSerr Theta    Phi  PeakCts   SNR AngSep     Name
#  [deg]    [deg]    ['] [deg]  [deg]                   [']
244.9858 -15.6644    1.0  23.8  -49.3   3.4506  11.4    1.5	Sco X-1
256.0870 -37.9529    2.7  12.4 -127.9   1.0133   4.3    8.1	4U 1700-377
256.4425 -36.4267    2.9  11.2 -123.2   0.9484   3.9    0.4	GX 349+2
263.0219 -24.7404   18.8   5.2  -24.7  -0.1589  -0.6    0.8	GX 1+4
264.9107 -44.3063   28.3  15.4 -164.8   0.1013   0.4   11.2	4U 1735-44
268.3608  -1.4534   14.6  27.6   15.6   0.2330   0.8    0.4	SW J1753.5-0127
270.2438 -25.2333    5.3   5.1   55.1   0.5230   2.2    9.5	GX 5-1
270.5027 -25.8548    0.0   4.8   62.2   0.1362   0.6   12.7	GRS 1758-258
274.1728 -14.0741    4.1  16.5   38.9   0.7392   2.8   10.0	GX 17+2
276.0104 -30.2937    3.1   8.5  112.7  -1.0419  -3.7    6.2	H1820-303
285.0641 -24.9155  197.7  17.1   92.1   0.0179   0.1    1.6	HT1900.1-2455
288.8775  10.9950    3.7  45.5   43.1   2.1433   3.1    5.5	GRS 1915+105
262.9085 -33.9974    9.8   5.8 -139.4   0.2860   1.2   10.6	GX 354-0
327.8155 -55.3580    3.1  50.5  151.0   3.9773   3.7 ------	UNKNOWN
247.8818 -48.8109    2.1  24.4 -138.3   1.5525   5.5 ------	UNKNOWN
Pre-slew background subtracted image of 15-350 keV band
Time interval of the image:
-0.300000 6.664000

# RAcent  DECcent POSerr Theta    Phi  PeakCts   SNR AngSep     Name
#  [deg]    [deg]    ['] [deg]  [deg]                   [']
245.1306 -15.7155    7.1  23.6  -49.2   0.0676   1.6    9.8	Sco X-1
255.7789 -37.7098    0.0  12.4 -126.2   0.0540   1.6   12.7	4U 1700-377
256.2638 -36.5314    4.4  11.4 -123.1   0.0863   2.6   10.5	GX 349+2
263.0818 -24.8862    4.6   5.0  -25.1  -0.0843  -2.5    9.3	GX 1+4
264.6091 -44.4885   27.8  15.6 -164.1  -0.0144  -0.4    6.2	4U 1735-44
268.2651  -1.5980    7.5  27.4   15.4   0.0596   1.5   10.7	SW J1753.5-0127
270.4515 -25.0754    3.3   5.3   55.5  -0.1245  -3.5    9.1	GX 5-1
270.4831 -25.7799    7.3   4.8   61.4   0.0569   1.6   10.0	GRS 1758-258
273.9715 -13.9161    6.5  16.6   38.0  -0.0617  -1.8    7.5	GX 17+2
275.7374 -30.3449   13.6   8.3  113.3   0.0289   0.8    9.8	H1820-303
285.0317 -24.9057   25.2  17.1   92.0   0.0165   0.5    0.9	HT1900.1-2455
288.7757  10.8118    7.1  45.3   43.1   0.1922   1.6    8.1	GRS 1915+105
262.8400 -33.9993    4.1   5.9 -138.9   0.0893   2.8   12.4	GX 354-0
305.1479 -28.0035    2.3  34.0  109.3   0.3448   5.0 ------	UNKNOWN
261.7225 -23.2284    2.3   7.1  -25.8   0.1574   5.1 ------	UNKNOWN
260.8538 -26.0236    1.1   5.7  -49.0   0.3634  10.8 ------	UNKNOWN
Post-slew image of 15-350 keV band
Time interval of the image:
833.860600 962.600000

# RAcent  DECcent POSerr Theta    Phi  PeakCts   SNR AngSep     Name
#  [deg]    [deg]    ['] [deg]  [deg]                   [']
328.3978 -64.7740    2.8  37.7   -1.1   1.0020   4.1 ------	UNKNOWN
 15.5223   3.1214    3.4  38.7 -170.8   0.8619   3.4 ------	UNKNOWN
 33.1389   7.8074    2.0  52.1 -153.5   2.8290   5.7 ------	UNKNOWN
 44.2728 -63.2432    2.9  43.2  -49.5   1.9481   3.9 ------	UNKNOWN
 51.2437 -55.8244    2.8  44.4  -61.2   3.7050   4.1 ------	UNKNOWN
 46.4872 -34.7707    3.3  40.9  -92.4   3.0329   3.5 ------	UNKNOWN