Analysis Summary
Notes:
- 1) No attempt has been made to eliminate the non-significant decimal places.
- 2) This batgrbproduct analysis is done using the HEASARC data.
- 3) This batgrbproduct analysis is using the flight position for the mask-weighting calculation.
======================================================================
                  BAT GRB EVENT DATA PROCESSING REPORT
    Process Script Ver: batgrbproduct v2.48
    Process Start Time: Wed Jun 14 12:31:15 EDT 2023
             Host Name: batproc1
   Current Working Dir: /local/data/bat1/alien/Swift_3rdBATcatalog/event/batevent_reproc/trigger1120270
======================================================================

  Trigger: 01120270      Segment: 000

  BAT Trigger Time: 682111413.248   [s; MET]
      Trigger Stop: 682111417.344   [s; MET]
               UTC: 2022-08-13T19:23:03.576540    [includes UTCF correction]
       Where From?: TDRSS position message

  BAT
    RA: 81.5009850183749   Dec: -32.9854787271802  [deg; J2000]

     Catalogged Source?: NO
     Point Source?:      YES
     GRB Indicated?:     YES    [ by BAT flight software ]
     Image S/N Ratio:    9.31
     Image Trigger?:     NO
     Rate S/N Ratio:     14.6969384566991  [ if not an image trigger ]
     Image S/N Ratio:    9.31

  Analysis Position:   [ source = BAT ]
    RA: 81.5009850183749   Dec: -32.9854787271802  [deg; J2000]

  Refined Position:   [ source = BAT pre-slew burst ]
    RA: 81.5318616030171   Dec: -33.0182804922456  [deg; J2000]
        { 05h 26m 07.6s , -33d 01' 05.8" }
         +/- 1.59762721504959 [arcmin] (estimated 90% radius based on SNR)
         +/- 0.748439264028011 [arcmin] (formal 1-sigma fit error)
    SNR: 15.5753984542622

  Angular difference between the analysis and refined position is 2.507464 arcmin

  Partial Coding Fraction: 0.9609375    [ including projection effects ]

  Duration
     T90: 16.5920000076294 +/- 1.91230227329654
        Measured from: -8.42000007629395
                   to: 8.17199993133545     [s; relative to TRIGTIME]
     T50: 6.567999958992 +/- 3.85143511084278
        Measured from: -0.860000014305115
                   to: 5.70799994468689     [s; relative to TRIGTIME]


  Fluence
     Peak Flux  (peak 1 second)
        Measured from: 1.87599992752075
                   to: 2.87599992752075     [s; relative to TRIGTIME]
     Total Fluence
        Measured from: -9.62800002098083
                   to: 8.87199997901917     [s; relative to TRIGTIME]

             Band 1     Band 2     Band 3     Band 4
              15-25      25-50     50-100    100-350     keV
 Total     0.175953   0.293376   0.234420   0.057985
           0.027611   0.029020   0.026120   0.023943 [error]
 Peak      0.015077   0.032958   0.029060   0.010621
           0.006348   0.006953   0.006340   0.005765 [error]

     [ fluence units of on-axis counts / fully illuminated detector ]

======================================================================


====== Table of the duration information =============================

        Value   tstart    tstop
T100   18.500   -9.628    8.872
T90    16.592   -8.420    8.172
T50     6.568   -0.860    5.708
Peak    1.000    1.876    2.876


====== Spectral Analysis Summary =====================================

Model      : spectral model: simple power-law (PL) and cutoff power-law (CPL)
Ph_index   : photon index: E^{Ph_index}
Ph_90err   : 90% error of the photon index
Epeak      : Epeak in keV
Epeak_90err: 90% error of Epeak
Norm       : normalization at 50 keV in both the PL model and CPL model
Nomr_90err : 90% error of the normalization
chi2       : Chi-Squared
dof        : degree of freedo

=== Time-averaged spectral analysis ===
(Best model with acceptable fit: PL)

Model Ph_index Ph_90err_low Ph_90err_hi  Epeak  Epeak_90err_low  Epeak_90err_hi  Norm       Nomr_90err_low    Norm_90err_hi    chi2    dof
PL      -1.417    -0.192      0.189       -           -               -         2.61e-03     -3.01e-04          2.99e-04      55.070   57
CPL     -0.387    -0.853      1.066       77.484     -18.271       122.366      8.65e-03     -5.37e-03          2.01e-02      50.690   56


=== 1-s peak spectral analysis ===
(Best model with acceptable fit: PL)

Model Ph_index Ph_90err_low Ph_90err_hi  Epeak  Epeak_90err_low  Epeak_90err_hi  Norm       Nomr_90err_low    Norm_90err_hi    chi2    dof
PL      -1.220     -0.412     0.408       -           -               -         5.41e-03     -1.29e-03          1.28e-03      44.570   57
CPL      0.166     -1.567     3.929       84.289     -29.956       -84.289      2.40e-02     -2.40e-02          1.32e+00      43.190   56


=== Fluence/Peak Flux Summary ===

              Model    Band1     Band2     Band3     Band4     Band5     Total
                       15-25     25-50    50-100    100-350    15-150    15-350    keV
Fluence         PL   5.70e-08  1.10e-07  1.65e-07  5.34e-07  4.65e-07  8.67e-07   erg/cm2
      90%_error_low -1.02e-08 -1.26e-08 -2.48e-08 -1.52e-07 -6.00e-08 -1.75e-07   erg/cm2
      90%_error_hi   1.06e-08  1.26e-08  2.47e-08  1.88e-07  6.10e-08  2.05e-07   erg/cm2
Peak flux       PL   1.71e-01  2.03e-01  1.74e-01  2.54e-01  6.37e-01  8.02e-01   ph/cm2/s
      90%_error_low -6.71e-02 -5.38e-02 -5.03e-02 -1.25e-01 -1.52e-01 -2.01e-01   ph/cm2/s
      90%_error_hi   7.66e-02  5.27e-02  4.92e-02  1.81e-01  1.52e-01  2.12e-01   ph/cm2/s

Fluence        CPL   4.79e-08  1.22e-07  1.73e-07  1.46e-07  4.28e-07  4.89e-07   erg/cm2
      90%_error_low -1.28e-08 -1.60e-08 -2.82e-08 -8.86e-08 -6.45e-08 -1.09e-07   erg/cm2
      90%_error_hi   1.30e-08  1.66e-08  2.85e-08  2.62e-07  6.73e-08  2.62e-07   erg/cm2
Peak flux      CPL   1.22e-01  2.20e-01  1.97e-01  8.29e-02  5.99e-01  6.22e-01   ph/cm2/s
      90%_error_low -1.22e-01 -6.40e-02 -6.12e-02 -8.29e-02 -1.69e-01 -1.90e-01   ph/cm2/s
      90%_error_hi   1.02e-01  6.68e-02  6.51e-02  2.25e-01  1.63e-01  2.87e-01   ph/cm2/s

======================================================================
Image
Pre-slew 15.0-350.0 keV image (Event data)
#   RAcent    DECcent   POSerr    Theta     Phi              Peak Cts       SNR   Name
   81.5319   -33.0183   0.0123    11.2603   -65.0072         0.8584158     15.575 TRIG_01120270

Foreground time interval of the image:
 -9.628   8.872 (delta_t =  18.500 [sec])
Background time interval of the image:
-239.248  -9.628 (delta_t = 229.620 [sec])
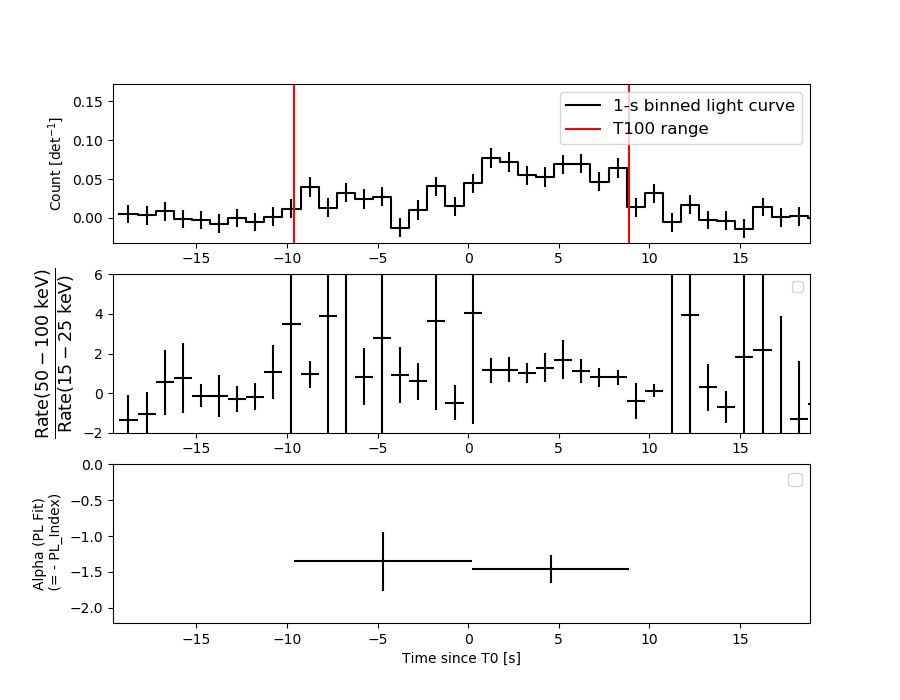
Light Curves
Note: The mask-weighted lightcurves have units of either count/det or counts/sec/det, where a det is 0.4 x 0.4 = 0.16 sq cm.
Full-time range; 1 s binning
Other quick-look light curves:
- 64 ms binning (zoomed)
- 16 ms binning (zoomed)
- 8 ms binning (zoomed)
- 2 ms binning (zoomed)
- SN=5 or 10 s binning (full-time range)
- Raw light curve
Spectra
- 64 ms binning (zoomed)
- 16 ms binning (zoomed)
- 8 ms binning (zoomed)
- 2 ms binning (zoomed)
- SN=5 or 10 s binning (full-time range)
- Raw light curve
Spectra
Notes:
- 1) The fitting includes the systematic errors.
- 2) When the burst includes telescope slew time periods, the fitting uses an average response file made from multiple 5-s response files through out the slew time plus single time preiod for the non-slew times, and weighted by the total counts in the corresponding time period using addrmf. An average response file is needed becuase a spectral fit using the pre-slew DRM will introduce some errors in both a spectral shape and a normalization if the PHA file contains a lot of the slew/post-slew time interval.
- 3) For fits to more complicated models (e.g. a power-law over a cutoff power-law), the BAT team has decided to require a chi-square improvement of more than 6 for each extra dof.
Time averaged spectrum fit using the average DRM
Power-law model
Time interval is from   -9.628 sec. to    8.872 sec.

Spectral model in power-law:
------------------------------------------------------------
Parameters  : value       lower 90%   higher 90%
Photon index: -1.41705     ( -0.192071   0.189279 )
Norm@50keV  : 2.60814E-03    ( -0.000300892   0.000298742 )
------------------------------------------------------------
#Fit statistic  : Chi-Squared                   55.07     using 59 bins.
 Reduced chi-squared = 0.96614
# Null hypothesis probability of 5.48e-01 with 57 degrees of freedom

Photon flux (15-150 keV)    in 18.5 sec: 0.318879 ( -0.035436  0.035455 ) ph/cm2/s
Energy fluence (15-150 keV)             : 4.647e-07 ( -6.00197e-08  6.09686e-08 ) ergs/cm2
Cutoff power-law model
Time interval is from   -9.628 sec. to    8.872 sec.
Spectral model in the cutoff power-law:
------------------------------------------------------------
Parameters  : value       lower 90%   higher 90%
Photon index: -0.38705     ( -0.852988   1.06615 )
Epeak [keV] : 77.4842      ( -18.2712 122.366 )
Norm@50keV  : 8.65316E-03    ( -0.00537162   0.0200663 )
------------------------------------------------------------
#Fit statistic  : Chi-Squared                   50.69     using 59 bins.
 Reduced chi-squared = 0.905179
# Null hypothesis probability of 6.76e-01 with 56 degrees of freedom

Photon flux (15-150 keV)    in 18.5 sec: 0.304566 ( -0.037652  0.037457 ) ph/cm2/s
Energy fluence (15-150 keV)             : 4.28127e-07 ( -6.45204e-08  6.7348e-08 ) ergs/cm2
1-s peak spectrum fit
Power-law model
Time interval is from    1.876 sec. to    2.876 sec.

Spectral model in power-law:
------------------------------------------------------------
Parameters  : value       lower 90%   higher 90%
Photon index: -1.2205     ( -0.412298   0.408046 )
Norm@50keV  : 5.41380E-03    ( -0.00128756   0.00128352 )
------------------------------------------------------------
#Fit statistic  : Chi-Squared                   44.57     using 59 bins.
 Reduced chi-squared = 0.78193
# Null hypothesis probability of 8.85e-01 with 57 degrees of freedom

Photon flux (15-150 keV)    in 1 sec: 0.637368 ( -0.151567  0.151814 ) ph/cm2/s
Energy fluence (15-150 keV)             : 5.46185e-08 ( -1.46636e-08  1.50313e-08 ) ergs/cm2
Cutoff power-law model
Time interval is from    1.876 sec. to    2.876 sec.
Spectral model in the cutoff power-law:
------------------------------------------------------------
Parameters  : value       lower 90%   higher 90%
Photon index: 0.166166     ( -1.58782   3.90814 )
Epeak [keV] : 84.2892      ( -29.4332 -83.7668 )
Norm@50keV  : 2.39772E-02    ( -0.0247485   1.31549 )
------------------------------------------------------------
#Fit statistic  : Chi-Squared                   43.19     using 59 bins.
 Reduced chi-squared = 0.77125
# Null hypothesis probability of 8.95e-01 with 56 degrees of freedom

Photon flux (15-150 keV)    in 1 sec: 0.598702 ( -0.168707  0.163188 ) ph/cm2/s
Energy fluence (15-150 keV)             : 5.03211e-08 ( -1.56937e-08  1.63949e-08 ) ergs/cm2
Time-resolved spectra
Distribution
T90 vs. Hardness ratio plot
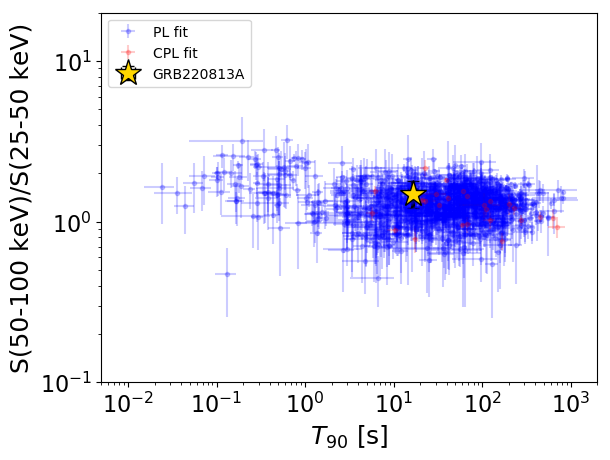
T90                                   = 16.592 sec.
Hardness ratio (energy fluence ratio) = 1.4979600726
S(15-50 keV) vs. S(50-150 keV) plot
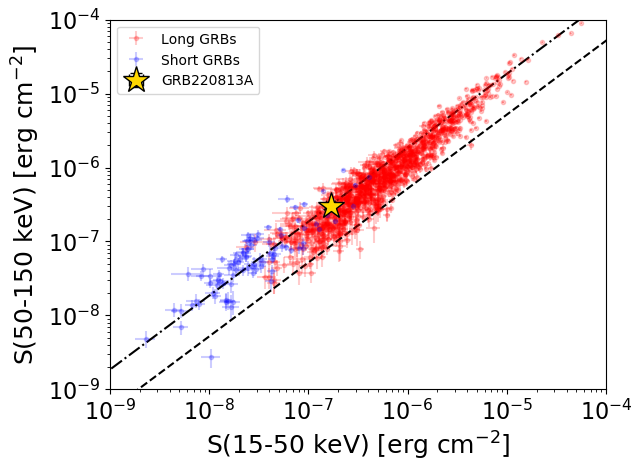
S(15-50 keV)  = 1.6720353e-07
S(50-150 keV) = 2.974885e-07
The dash-dotted line and the dashed line traces the fluences calculated from the Band function with Epeak = 15 and 150 keV, respectively. Both lines assume a canonical values of alpha = -1 and beta = -2.5.
Mask shadow pattern
IMX = 8.411997507449501E-02, IMY = 1.804552305637522E-01
Spacecraft aspect plot
Bright source in the pre-burst/pre-slew/post-slew images
Pre-burst image of 15-350 keV band
Time interval of the image:
-239.248000 -9.628000

# RAcent  DECcent POSerr Theta    Phi  PeakCts   SNR AngSep     Name
#  [deg]    [deg]    ['] [deg]  [deg]                   [']
 29.6394 -21.2291    3.1  35.9  116.7   3.3996   3.8 ------	UNKNOWN
 37.2545  -5.4712    2.8  39.5  144.8   3.3511   4.1 ------	UNKNOWN
 83.9305 -51.8871    2.4  22.6   -7.5   1.6916   4.8 ------	UNKNOWN
 74.3044   5.1353    2.2  38.0 -151.7   2.6149   5.1 ------	UNKNOWN
Pre-slew background subtracted image of 15-350 keV band
Time interval of the image:
-9.628000 8.872000

# RAcent  DECcent POSerr Theta    Phi  PeakCts   SNR AngSep     Name
#  [deg]    [deg]    ['] [deg]  [deg]                   [']
 81.5319 -33.0183    0.7  11.3  -65.0   0.8586  15.5 ------	UNKNOWN
118.5788 -41.5566    2.2  40.7  -43.8   0.5639   5.3 ------	UNKNOWN
146.5851 -54.2317    2.1  57.7  -24.3   2.1318   5.6 ------	UNKNOWN
Post-slew image of 15-350 keV band
Time interval of the image:
78.852590 962.887800

# RAcent  DECcent POSerr Theta    Phi  PeakCts   SNR AngSep     Name
#  [deg]    [deg]    ['] [deg]  [deg]                   [']
 83.6043  22.0042    2.0  55.0 -149.3  36.0094   5.7    1.7	Crab
135.3187 -40.5915    0.0  43.1  -35.4  -3.2724  -1.7    9.8	Vela X-1
 40.3120 -27.1122    3.1  35.9  116.7  12.3934   3.8 ------	UNKNOWN
 40.3062 -26.6510    3.3  36.1  117.4  12.8434   4.1 ------	UNKNOWN
 46.1167 -10.4995    2.7  39.5  144.9  12.2549   4.2 ------	UNKNOWN
101.9016 -49.8008    2.5  22.6   -7.5   5.5177   4.6 ------	UNKNOWN
 69.6391   3.9316    2.8  38.6 -170.8   6.6573   4.1 ------	UNKNOWN
131.5605 -57.4769    3.1  41.5  -10.1   6.8706   3.8 ------	UNKNOWN
 98.5123  12.2022    3.0  48.0 -129.0  22.2834   3.9 ------	UNKNOWN