Analysis Summary
Notes:
- 1) No attempt has been made to eliminate the non-significant decimal places.
- 2) This batgrbproduct analysis is done using the HEASARC data.
- 3) This batgrbproduct analysis is using the flight position for the mask-weighting calculation.
======================================================================
                  BAT GRB EVENT DATA PROCESSING REPORT
    Process Script Ver: batgrbproduct v2.48
    Process Start Time: Wed Jun 14 12:28:24 EDT 2023
             Host Name: batproc1
   Current Working Dir: /local/data/bat1/alien/Swift_3rdBATcatalog/event/batevent_reproc/trigger1121751
======================================================================

  Trigger: 01121751      Segment: 000

  BAT Trigger Time: 683207751.488   [s; MET]
      Trigger Stop: 683207752   [s; MET]
               UTC: 2022-08-26T11:55:21.742040    [includes UTCF correction]
       Where From?: TDRSS position message

  BAT
    RA: 206.43146700875   Dec: -44.0445504797927  [deg; J2000]

     Catalogged Source?: NO
     Point Source?:      YES
     GRB Indicated?:     YES    [ by BAT flight software ]
     Image S/N Ratio:    7.45
     Image Trigger?:     NO
     Rate S/N Ratio:     16.4924225024706  [ if not an image trigger ]
     Image S/N Ratio:    7.45

  Analysis Position:   [ source = BAT ]
    RA: 206.43146700875   Dec: -44.0445504797927  [deg; J2000]

  Refined Position:   [ source = BAT pre-slew burst ]
    RA: 206.427770035127   Dec: -44.0390330797788  [deg; J2000]
        { 13h 45m 42.7s , -44d 02' 20.5" }
         +/- 1.07720523462353 [arcmin] (estimated 90% radius based on SNR)
         +/- 0.284688725264023 [arcmin] (formal 1-sigma fit error)
    SNR: 27.3512846756338

  Angular difference between the analysis and refined position is 0.367443 arcmin

  Partial Coding Fraction: 0.921875    [ including projection effects ]

  Duration
     T90: 11.1399999856949 +/- 1.0195685291616
        Measured from: 0.25599992275238
                   to: 11.3959999084473     [s; relative to TRIGTIME]
     T50: 5.9799998998642 +/- 0.475785645942125
        Measured from: 1.76800000667572
                   to: 7.74799990653992     [s; relative to TRIGTIME]


  Fluence
     Peak Flux  (peak 1 second)
        Measured from: 6.57999992370605
                   to: 7.57999992370605     [s; relative to TRIGTIME]
     Total Fluence
        Measured from: -0.200000047683716
                   to: 13.0080000162125     [s; relative to TRIGTIME]

             Band 1     Band 2     Band 3     Band 4
              15-25      25-50     50-100    100-350     keV
 Total     0.483659   0.681670   0.528291   0.101546
           0.029087   0.031182   0.028694   0.027738 [error]
 Peak      0.056414   0.124926   0.113121   0.038625
           0.008635   0.009931   0.009272   0.008666 [error]

     [ fluence units of on-axis counts / fully illuminated detector ]

======================================================================


====== Table of the duration information =============================

        Value   tstart    tstop
T100   13.208   -0.200   13.008
T90    11.140    0.256   11.396
T50     5.980    1.768    7.748
Peak    1.000    6.580    7.580


====== Spectral Analysis Summary =====================================

Model      : spectral model: simple power-law (PL) and cutoff power-law (CPL)
Ph_index   : photon index: E^{Ph_index}
Ph_90err   : 90% error of the photon index
Epeak      : Epeak in keV
Epeak_90err: 90% error of Epeak
Norm       : normalization at 50 keV in both the PL model and CPL model
Nomr_90err : 90% error of the normalization
chi2       : Chi-Squared
dof        : degree of freedo

=== Time-averaged spectral analysis ===
(Best model with acceptable fit: PL)

Model Ph_index Ph_90err_low Ph_90err_hi  Epeak  Epeak_90err_low  Epeak_90err_hi  Norm       Nomr_90err_low    Norm_90err_hi    chi2    dof
PL      -1.439    -0.097      0.097       -           -               -         9.18e-03     -4.88e-04          4.86e-04      59.950   57
CPL     -1.306    -0.183      0.395      265.724    -265.724      -265.724      1.07e-02     -1.92e-03          5.87e-03      59.580   56


=== 1-s peak spectral analysis ===
(Best model with acceptable fit: PL)

Model Ph_index Ph_90err_low Ph_90err_hi  Epeak  Epeak_90err_low  Epeak_90err_hi  Norm       Nomr_90err_low    Norm_90err_hi    chi2    dof
PL      -1.105     -0.151     0.154       -           -               -         2.25e-02     -1.95e-03          1.95e-03      62.370   57
CPL     -0.859     -0.320     0.674      250.851    -250.851      -250.851      2.94e-02     -8.55e-03          3.07e-02      61.890   56


=== Fluence/Peak Flux Summary ===

              Model    Band1     Band2     Band3     Band4     Band5     Total
                       15-25     25-50    50-100    100-350    15-150    15-350    keV
Fluence         PL   1.46e-07  2.79e-07  4.11e-07  1.30e-06  1.16e-06  2.14e-06   erg/cm2
      90%_error_low -1.38e-08 -1.57e-08 -2.86e-08 -1.90e-07 -6.88e-08 -2.12e-07   erg/cm2
      90%_error_hi   1.42e-08  1.56e-08  2.85e-08  2.12e-07  6.92e-08  2.30e-07   erg/cm2
Peak flux       PL   6.35e-01  8.09e-01  7.53e-01  1.23e+00  2.61e+00  3.43e+00   ph/cm2/s
      90%_error_low -1.05e-01 -8.38e-02 -7.53e-02 -2.45e-01 -2.30e-01 -3.23e-01   ph/cm2/s
      90%_error_hi   1.11e-01  8.27e-02  7.46e-02  2.83e-01  2.30e-01  3.32e-01   ph/cm2/s

Fluence        CPL   1.43e-07  2.82e-07  4.15e-07  1.05e-06  1.15e-06  1.89e-06   erg/cm2
      90%_error_low -1.68e-08 -1.76e-08 -3.01e-08 -4.50e-07 -7.84e-08 -4.54e-07   erg/cm2
      90%_error_hi   1.41e-08  1.84e-08  3.06e-08  2.76e-07  7.69e-08  3.16e-07   erg/cm2
Peak flux      CPL   6.02e-01  8.25e-01  7.72e-01  9.29e-01  2.59e+00  3.13e+00   ph/cm2/s
      90%_error_low -1.31e-01 -8.95e-02 -8.79e-02 -4.42e-01 -2.40e-01 -5.12e-01   ph/cm2/s
      90%_error_hi   1.18e-01  9.45e-02  8.99e-02  3.77e-01  2.39e-01  4.74e-01   ph/cm2/s

======================================================================
Image
Pre-slew 15.0-350.0 keV image (Event data)

#   RAcent    DECcent   POSerr    Theta     Phi              Peak Cts       SNR   Name
  206.4278   -44.0390   0.0070    23.6957    -0.6225         1.5616886     27.351 TRIG_01121751

Foreground time interval of the image:
 -0.200  10.213 (delta_t =  10.413 [sec])
Background time interval of the image:
-239.488  -0.200 (delta_t = 239.288 [sec])
Light Curves
Note: The mask-weighted lightcurves have units of either count/det or counts/sec/det, where a det is 0.4 x 0.4 = 0.16 sq cm.
Full-time range; 1 s binning
Other quick-look light curves:
- 64 ms binning (zoomed)
- 16 ms binning (zoomed)
- 8 ms binning (zoomed)
- 2 ms binning (zoomed)
- SN=5 or 10 s binning (full-time range)
- Raw light curve
Spectra
- 64 ms binning (zoomed)
- 16 ms binning (zoomed)
- 8 ms binning (zoomed)
- 2 ms binning (zoomed)
- SN=5 or 10 s binning (full-time range)
- Raw light curve
Spectra
Notes:
- 1) The fitting includes the systematic errors.
- 2) When the burst includes telescope slew time periods, the fitting uses an average response file made from multiple 5-s response files through out the slew time plus single time preiod for the non-slew times, and weighted by the total counts in the corresponding time period using addrmf. An average response file is needed becuase a spectral fit using the pre-slew DRM will introduce some errors in both a spectral shape and a normalization if the PHA file contains a lot of the slew/post-slew time interval.
- 3) For fits to more complicated models (e.g. a power-law over a cutoff power-law), the BAT team has decided to require a chi-square improvement of more than 6 for each extra dof.
Time averaged spectrum fit using the average DRM
Power-law model
Time interval is from   -0.200 sec. to   13.008 sec.

Spectral model in power-law:
------------------------------------------------------------
Parameters  : value       lower 90%   higher 90%
Photon index: -1.43909     ( -0.0971864   0.0968579 )
Norm@50keV  : 9.17556E-03    ( -0.000488026   0.000486297 )
------------------------------------------------------------
#Fit statistic  : Chi-Squared                   59.95     using 59 bins.
 Reduced chi-squared = 1.05175
# Null hypothesis probability of 3.69e-01 with 57 degrees of freedom

Photon flux (15-150 keV)    in 13.21 sec: 1.12776 ( -0.06046  0.06058 ) ph/cm2/s
Energy fluence (15-150 keV)             : 1.16239e-06 ( -6.8782e-08  6.92444e-08 ) ergs/cm2
Cutoff power-law model
Time interval is from   -0.200 sec. to   13.008 sec.
Spectral model in the cutoff power-law:
------------------------------------------------------------
Parameters  : value       lower 90%   higher 90%
Photon index: -1.30578     ( -0.183188   0.394728 )
Epeak [keV] : 265.724      ( -265.975 -265.975 )
Norm@50keV  : 1.06780E-02    ( -0.00192314   0.00586828 )
------------------------------------------------------------
#Fit statistic  : Chi-Squared                   59.58     using 59 bins.
 Reduced chi-squared = 1.06393
# Null hypothesis probability of 3.47e-01 with 56 degrees of freedom

Photon flux (15-150 keV)    in 13.21 sec: 1.11906 ( -0.06501  0.06481 ) ph/cm2/s
Energy fluence (15-150 keV)             : 1.14898e-06 ( -7.84408e-08  7.69412e-08 ) ergs/cm2
1-s peak spectrum fit
Power-law model

Time interval is from    6.580 sec. to    7.580 sec.

Spectral model in power-law:
------------------------------------------------------------
Parameters  : value       lower 90%   higher 90%
Photon index: -1.10452     ( -0.151309   0.153743 )
Norm@50keV  : 2.25137E-02    ( -0.00194657   0.00194628 )
------------------------------------------------------------
#Fit statistic  : Chi-Squared                   62.37     using 59 bins.
 Reduced chi-squared = 1.09421
# Null hypothesis probability of 2.91e-01 with 57 degrees of freedom

Photon flux (15-150 keV)    in 1 sec: 2.61259 ( -0.23022  0.23046 ) ph/cm2/s
Energy fluence (15-150 keV)             : 2.35072e-07 ( -2.286e-08  2.30589e-08 ) ergs/cm2
Cutoff power-law model

Time interval is from    6.580 sec. to    7.580 sec.
Spectral model in the cutoff power-law:
------------------------------------------------------------
Parameters  : value       lower 90%   higher 90%
Photon index: -0.859342     ( -0.320213   0.674033 )
Epeak [keV] : 250.851      ( -250.868 -250.868 )
Norm@50keV  : 2.94452E-02    ( -0.00855239   0.0307103 )
------------------------------------------------------------
#Fit statistic  : Chi-Squared                   61.89     using 59 bins.
 Reduced chi-squared = 1.10518
# Null hypothesis probability of 2.74e-01 with 56 degrees of freedom

Photon flux (15-150 keV)    in 1 sec: 2.58626 ( -0.23977  0.23895 ) ph/cm2/s
Energy fluence (15-150 keV)             : 2.31143e-07 ( -2.52934e-08  2.47097e-08 ) ergs/cm2
Time-resolved spectra

Distribution
T90 vs. Hardness ratio plot

T90                                   = 11.14 sec.
Hardness ratio (energy fluence ratio) = 1.47523126097
S(15-50 keV) vs. S(50-150 keV) plot
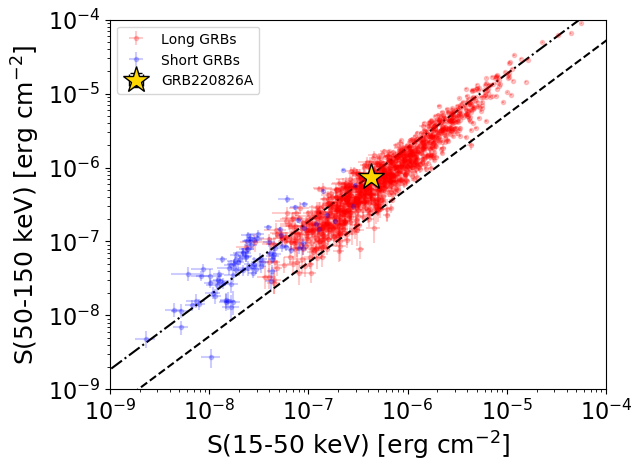
S(15-50 keV)  = 4.250042e-07
S(50-150 keV) = 7.373868e-07
The dash-dotted line and the dashed line traces the fluences calculated from the Band function with Epeak = 15 and 150 keV, respectively. Both lines assume a canonical values of alpha = -1 and beta = -2.5.
Mask shadow pattern
IMX = 4.388532200155590E-01, IMY = 4.767913310125819E-03
Spacecraft aspect plot

Bright source in the pre-burst/pre-slew/post-slew images
Pre-burst image of 15-350 keV band
Time interval of the image:
-239.488000 -0.200000

# RAcent  DECcent POSerr Theta    Phi  PeakCts   SNR AngSep     Name
#  [deg]    [deg]    ['] [deg]  [deg]                   [']
135.5209 -40.5818    3.4  33.3 -128.2   2.1161   3.4    1.7	Vela X-1
170.4556 -60.4223    0.0   4.2 -137.9   0.0233   0.1   12.7	Cen X-3
186.6194 -62.5880    9.1   3.9   56.1   0.5900   1.3   11.0	GX 301-2
 21.8140 -70.7269    3.5  47.0  133.6   7.9432   3.3 ------	UNKNOWN
305.0102 -81.0425    2.5  34.7  110.7   4.7993   4.6 ------	UNKNOWN
329.7758 -81.9303    3.1  35.9  116.8   4.5408   3.7 ------	UNKNOWN
228.0397 -31.5563    2.2  43.4   13.3   3.8768   5.2 ------	UNKNOWN
227.6188 -15.7041    2.2  57.2    3.0   8.4008   5.2 ------	UNKNOWN
217.8959 -18.8621    2.7  50.5   -5.9   3.3671   4.2 ------	UNKNOWN
Pre-slew background subtracted image of 15-350 keV band
Time interval of the image:
-0.200000 10.212600

# RAcent  DECcent POSerr Theta    Phi  PeakCts   SNR AngSep     Name
#  [deg]    [deg]    ['] [deg]  [deg]                   [']
135.3596 -40.6710  175.5  33.3 -128.5  -0.0051  -0.1   10.4	Vela X-1
169.9089 -60.5536    0.0   4.4 -140.5  -0.0727  -1.4   12.7	Cen X-3
186.1959 -62.7523    0.0   3.7   59.4  -0.0156  -0.3   12.7	GX 301-2
206.4278 -44.0390    0.4  23.7   -0.6   1.5617  27.4 ------	UNKNOWN
Post-slew image of 15-350 keV band
Time interval of the image:
69.412600 873.112600

# RAcent  DECcent POSerr Theta    Phi  PeakCts   SNR AngSep     Name
#  [deg]    [deg]    ['] [deg]  [deg]                   [']
135.4457 -40.5591    6.2  51.0 -148.1   6.9572   1.9    3.8	Vela X-1
170.3479 -60.4672  112.3  27.0 -176.0  -0.1564  -0.1    9.4	Cen X-3
187.1092 -62.7877    0.0  21.8  168.3  -0.9530  -0.7   12.5	GX 301-2
245.0052 -15.6413    1.2  43.2   25.5  24.1148   9.9    1.5	Sco X-1
255.9758 -37.8377  824.8  37.4   62.3   0.0579   0.0    0.6	4U 1700-377
256.5352 -36.3501    3.8  38.4   60.4  13.3408   3.0    6.5	GX 349+2
228.5568 -51.9521    2.3  16.7   90.3   7.6471   4.9 ------	UNKNOWN
119.4297 -49.8030    2.7  56.3 -164.9  21.6836   4.4 ------	UNKNOWN
147.6734 -29.7177    2.7  48.1 -129.1  26.2417   4.2 ------	UNKNOWN