Analysis Summary
Notes:
- 1) No attempt has been made to eliminate the non-significant decimal places.
- 2) This batgrbproduct analysis is done using the HEASARC data.
- 3) This batgrbproduct analysis is using the flight position for the mask-weighting calculation.
======================================================================
                  BAT GRB EVENT DATA PROCESSING REPORT
    Process Script Ver: batgrbproduct v2.48
    Process Start Time: Wed Jun 14 12:24:53 EDT 2023
             Host Name: batproc1
   Current Working Dir: /local/data/bat1/alien/Swift_3rdBATcatalog/event/batevent_reproc/trigger1123129
======================================================================

  Trigger: 01123129      Segment: 000

  BAT Trigger Time: 684252355.584   [s; MET]
      Trigger Stop: 684252356.608   [s; MET]
               UTC: 2022-09-07T14:05:25.767040    [includes UTCF correction]
       Where From?: TDRSS position message

  BAT
    RA: 268.870001475522   Dec: -20.3153434089484  [deg; J2000]

     Catalogged Source?: NO
     Point Source?:      YES
     GRB Indicated?:     YES    [ by BAT flight software ]
     Image S/N Ratio:    8.52
     Image Trigger?:     NO
     Rate S/N Ratio:     13.9642400437689  [ if not an image trigger ]
     Image S/N Ratio:    8.52

  Analysis Position:   [ source = BAT ]
    RA: 268.870001475522   Dec: -20.3153434089484  [deg; J2000]

  Refined Position:   [ source = BAT pre-slew burst ]
    RA: 268.859737239318   Dec: -20.2975561348179  [deg; J2000]
        { 17h 55m 26.3s , -20d 17' 51.2" }
         +/- 1.84686921582977 [arcmin] (estimated 90% radius based on SNR)
         +/- 0.854461663850627 [arcmin] (formal 1-sigma fit error)
    SNR: 12.6617962123207

  Angular difference between the analysis and refined position is 1.213504 arcmin

  Partial Coding Fraction: 0.90625    [ including projection effects ]

  Duration
     T90: 8.87999987602234 +/- 1.47397292721756
        Measured from: -0.263999938964844
                   to: 8.6159999370575     [s; relative to TRIGTIME]
     T50: 4.65199995040894 +/- 1.0846197289012
        Measured from: 0.779999971389771
                   to: 5.43199992179871     [s; relative to TRIGTIME]


  Fluence
     Peak Flux  (peak 1 second)
        Measured from: 0.700000047683716
                   to: 1.70000004768372     [s; relative to TRIGTIME]
     Total Fluence
        Measured from: -0.595999956130981
                   to: 9.23199999332428     [s; relative to TRIGTIME]

             Band 1     Band 2     Band 3     Band 4
              15-25      25-50     50-100    100-350     keV
 Total     0.119348   0.154724   0.209727   0.086153
           0.025737   0.024638   0.021704   0.018836 [error]
 Peak      0.027483   0.041412   0.047785   0.016366
           0.008379   0.008336   0.007792   0.006684 [error]

     [ fluence units of on-axis counts / fully illuminated detector ]

======================================================================


====== Table of the duration information =============================

        Value   tstart    tstop
T100    9.828   -0.596    9.232
T90     8.880   -0.264    8.616
T50     4.652    0.780    5.432
Peak    1.000    0.700    1.700


====== Spectral Analysis Summary =====================================

Model      : spectral model: simple power-law (PL) and cutoff power-law (CPL)
Ph_index   : photon index: E^{Ph_index}
Ph_90err   : 90% error of the photon index
Epeak      : Epeak in keV
Epeak_90err: 90% error of Epeak
Norm       : normalization at 50 keV in both the PL model and CPL model
Nomr_90err : 90% error of the normalization
chi2       : Chi-Squared
dof        : degree of freedo

=== Time-averaged spectral analysis ===
(Best model with acceptable fit: N/A)

Model Ph_index Ph_90err_low Ph_90err_hi  Epeak  Epeak_90err_low  Epeak_90err_hi  Norm       Nomr_90err_low    Norm_90err_hi    chi2    dof
PL      -1.011    -0.232      0.243       -           -               -         3.75e-03     -5.00e-04          4.94e-04      78.220   57
CPL     -0.579    -0.540      1.372      199.097    -199.097      -199.097      5.67e-03     -2.65e-03          1.37e-02      77.750   56


=== 1-s peak spectral analysis ===
(Best model with acceptable fit: N/A)

Model Ph_index Ph_90err_low Ph_90err_hi  Epeak  Epeak_90err_low  Epeak_90err_hi  Norm       Nomr_90err_low    Norm_90err_hi    chi2    dof
PL      -1.034     -0.319     0.334       -           -               -         8.58e-03     -1.66e-03          1.65e-03      72.260   57
CPL      0.618     -1.653     3.075       94.408     -25.033      2337.162      4.20e-02     -4.20e-02          4.86e-01      69.400   56


=== Fluence/Peak Flux Summary ===

              Model    Band1     Band2     Band3     Band4     Band5     Total
                       15-25     25-50    50-100    100-350    15-150    15-350    keV
Fluence         PL   2.98e-08  7.40e-08  1.47e-07  7.26e-07  3.97e-07  9.77e-07   erg/cm2
      90%_error_low -8.04e-09 -1.26e-08 -2.03e-08 -2.11e-07 -5.32e-08 -2.22e-07   erg/cm2
      90%_error_hi   8.95e-09  1.23e-08  2.01e-08  2.70e-07  5.34e-08  2.73e-07   erg/cm2
Peak flux       PL   2.26e-01  3.01e-01  2.94e-01  5.14e-01  9.90e-01  1.33e+00   ph/cm2/s
      90%_error_low -8.14e-02 -7.26e-02 -6.02e-02 -1.92e-01 -1.95e-01 -2.66e-01   ph/cm2/s
      90%_error_hi   9.41e-02  7.15e-02  5.95e-02  2.56e-01  1.96e-01  2.78e-01   ph/cm2/s

Fluence        CPL   2.62e-08  7.51e-08  1.54e-07  4.40e-07  3.90e-07  6.96e-07   erg/cm2
      90%_error_low -1.15e-08 -1.33e-08 -2.53e-08 -2.87e-07 -5.78e-08 -2.91e-07   erg/cm2
      90%_error_hi   1.16e-08  1.34e-08  2.71e-08  5.16e-07  5.65e-08  3.59e-07   erg/cm2
Peak flux      CPL   1.36e-01  3.08e-01  3.46e-01  1.74e-01  9.11e-01  9.64e-01   ph/cm2/s
      90%_error_low -1.01e-01 -9.75e-02 -8.09e-02 -1.74e-01 -2.18e-01 -2.59e-01   ph/cm2/s
      90%_error_hi   1.27e-01  8.59e-02  8.74e-02  3.56e-01  2.14e-01  4.03e-01   ph/cm2/s

======================================================================
Image
Pre-slew 15.0-350.0 keV image (Event data)
#   RAcent    DECcent   POSerr    Theta     Phi              Peak Cts       SNR   Name
  268.8597   -20.2976   0.0151    25.0192   174.4959         0.6073847     12.662 TRIG_01123129

Foreground time interval of the image:
 -0.596   9.232 (delta_t =   9.828 [sec])
Background time interval of the image:
-239.584  -0.596 (delta_t = 238.988 [sec])
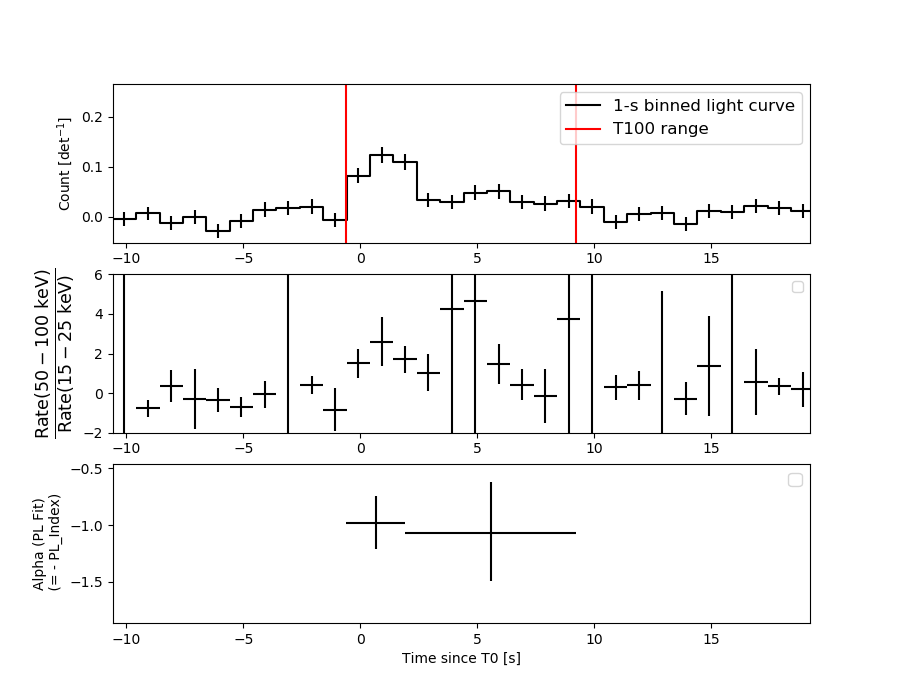
Light Curves
Note: The mask-weighted lightcurves have units of either count/det or counts/sec/det, where a det is 0.4 x 0.4 = 0.16 sq cm.
Full-time range; 1 s binning
Other quick-look light curves:
- 64 ms binning (zoomed)
- 16 ms binning (zoomed)
- 8 ms binning (zoomed)
- 2 ms binning (zoomed)
- SN=5 or 10 s binning (full-time range)
- Raw light curve
Spectra
- 64 ms binning (zoomed)
- 16 ms binning (zoomed)
- 8 ms binning (zoomed)
- 2 ms binning (zoomed)
- SN=5 or 10 s binning (full-time range)
- Raw light curve
Spectra
Notes:
- 1) The fitting includes the systematic errors.
- 2) When the burst includes telescope slew time periods, the fitting uses an average response file made from multiple 5-s response files through out the slew time plus single time preiod for the non-slew times, and weighted by the total counts in the corresponding time period using addrmf. An average response file is needed becuase a spectral fit using the pre-slew DRM will introduce some errors in both a spectral shape and a normalization if the PHA file contains a lot of the slew/post-slew time interval.
- 3) For fits to more complicated models (e.g. a power-law over a cutoff power-law), the BAT team has decided to require a chi-square improvement of more than 6 for each extra dof.
Time averaged spectrum fit using the average DRM
Power-law model

Time interval is from   -0.596 sec. to    9.232 sec.

Spectral model in power-law:
------------------------------------------------------------
Parameters  : value       lower 90%   higher 90%
Photon index: -1.01111     ( -0.231952   0.242554 )
Norm@50keV  : 3.74857E-03    ( -0.000499596   0.000493992 )
------------------------------------------------------------
#Fit statistic  : Chi-Squared                   78.22     using 59 bins.
 Reduced chi-squared = 1.37228
# Null hypothesis probability of 3.26e-02 with 57 degrees of freedom

Photon flux (15-150 keV)    in 9.828 sec: 0.431833 ( -0.058848  0.059314 ) ph/cm2/s
Energy fluence (15-150 keV)             : 3.96867e-07 ( -5.32105e-08  5.34462e-08 ) ergs/cm2
Cutoff power-law model
Time interval is from   -0.596 sec. to    9.232 sec.
Spectral model in the cutoff power-law:
------------------------------------------------------------
Parameters  : value       lower 90%   higher 90%
Photon index: -0.57903     ( -0.540173   1.37204 )
Epeak [keV] : 199.097      ( -199.054 -199.054 )
Norm@50keV  : 5.67182E-03    ( -0.00265297   0.0136835 )
------------------------------------------------------------
#Fit statistic  : Chi-Squared                   77.75     using 59 bins.
 Reduced chi-squared = 1.38839
# Null hypothesis probability of 2.89e-02 with 56 degrees of freedom

Photon flux (15-150 keV)    in 9.828 sec: 0.421540 ( -0.06505  0.064087 ) ph/cm2/s
Energy fluence (15-150 keV)             : 3.89534e-07 ( -5.78416e-08  5.64973e-08 ) ergs/cm2
1-s peak spectrum fit
Power-law model
Time interval is from    0.700 sec. to    1.700 sec.

Spectral model in power-law:
------------------------------------------------------------
Parameters  : value       lower 90%   higher 90%
Photon index: -1.03442     ( -0.319007   0.334091 )
Norm@50keV  : 8.57900E-03    ( -0.00165601   0.00164623 )
------------------------------------------------------------
#Fit statistic  : Chi-Squared                   72.26     using 59 bins.
 Reduced chi-squared = 1.26772
# Null hypothesis probability of 8.38e-02 with 57 degrees of freedom

Photon flux (15-150 keV)    in 1 sec: 0.989751 ( -0.194669  0.196099 ) ph/cm2/s
Energy fluence (15-150 keV)             : 9.16706e-08 ( -1.85095e-08  1.8689e-08 ) ergs/cm2
Cutoff power-law model
Time interval is from    0.700 sec. to    1.700 sec.
Spectral model in the cutoff power-law:
------------------------------------------------------------
Parameters  : value       lower 90%   higher 90%
Photon index: 0.617696     ( -1.65592   3.07286 )
Epeak [keV] : 94.4081      ( -25.0056 2337.19 )
Norm@50keV  : 4.19818E-02    ( -0.0420934   0.485421 )
------------------------------------------------------------
#Fit statistic  : Chi-Squared                   69.40     using 59 bins.
 Reduced chi-squared = 1.23929
# Null hypothesis probability of 1.08e-01 with 56 degrees of freedom

Photon flux (15-150 keV)    in 1 sec: 0.911057 ( -0.218429  0.214003 ) ph/cm2/s
Energy fluence (15-150 keV)             : 8.53906e-08 ( -1.96263e-08  1.99947e-08 ) ergs/cm2
Time-resolved spectra
Distribution
T90 vs. Hardness ratio plot
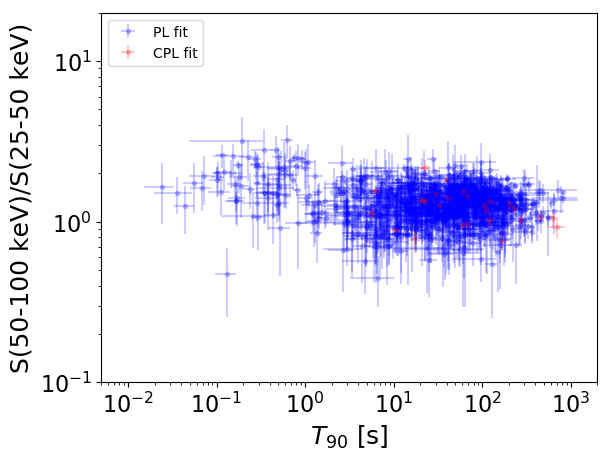
T90                                   = N/A sec.
Hardness ratio (energy fluence ratio) = N/A
S(15-50 keV) vs. S(50-150 keV) plot
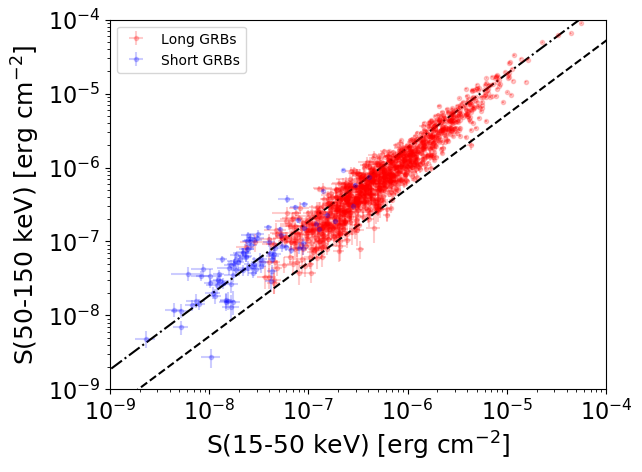
S(15-50 keV)  = N/A
S(50-150 keV) = N/A
The dash-dotted line and the dashed line traces the fluences calculated from the Band function with Epeak = 15 and 150 keV, respectively. Both lines assume a canonical values of alpha = -1 and beta = -2.5.
Mask shadow pattern
IMX = -4.645637837252434E-01, IMY = -4.476556257540029E-02
Spacecraft aspect plot
Bright source in the pre-burst/pre-slew/post-slew images
Pre-burst image of 15-350 keV band
Time interval of the image:
-239.584000 -0.596000

# RAcent  DECcent POSerr Theta    Phi  PeakCts   SNR AngSep     Name
#  [deg]    [deg]    ['] [deg]  [deg]                   [']
244.9978 -15.6686    1.0  31.6 -137.4   6.5092  11.8    2.0	Sco X-1
254.6222  35.3622    5.9  33.6  -29.0   1.0734   2.0    8.1	Her X-1
255.9047 -37.9247    6.3  44.5 -171.5   1.4603   1.8    6.2	4U 1700-377
256.4306 -36.4304    4.4  42.9 -171.4   1.9832   2.7    0.5	GX 349+2
263.1550 -24.7327    4.7  30.1 -175.4   1.1967   2.5    8.0	GX 1+4
264.8427 -44.6110    0.0  49.5  177.5   1.3482   1.1   10.6	4U 1735-44
268.3951  -1.6069  505.2   6.4 -177.3   0.0089   0.0    9.4	SW J1753.5-0127
270.3352 -24.9473   19.3  29.7  171.6   0.3092   0.6    8.4	GX 5-1
270.3078 -25.6434    6.3  30.4  171.7   0.9904   1.8    6.0	GRS 1758-258
274.0511 -14.0340    2.6  19.3  159.6   1.9567   4.5    2.6	GX 17+2
276.0716 -30.3634   16.6  35.6  163.4  -0.4584  -0.7    7.6	H1820-303
284.8793 -24.9672    6.9  33.3  147.1  -1.1215  -1.7    9.0	HT1900.1-2455
288.6388  10.8973   16.0  20.0   64.0   0.3658   0.7    9.8	GRS 1915+105
299.5869  35.2059    1.6  41.3   31.6   5.8775   7.4    0.3	Cyg X-1
308.1963  40.9689    5.5  50.1   31.2   2.7774   2.1    4.0	Cyg X-3
262.8615 -33.7514    6.0  39.0 -178.1  -1.1944  -1.9    8.1	GX 354-0
303.9829  40.5874    3.1  47.4   29.0   3.2111   3.8 ------	UNKNOWN
277.7358  41.4926    2.2  37.5    3.4   3.0389   5.3 ------	UNKNOWN
260.0781  53.2567    2.9  49.1  -14.2   2.8579   3.9 ------	UNKNOWN
231.8826  41.9200    2.9  50.0  -43.1   6.9684   4.0 ------	UNKNOWN
229.6406  34.2168    2.9  47.2  -53.0   7.8967   4.0 ------	UNKNOWN
Pre-slew background subtracted image of 15-350 keV band
Time interval of the image:
-0.596000 9.232000

# RAcent  DECcent POSerr Theta    Phi  PeakCts   SNR AngSep     Name
#  [deg]    [deg]    ['] [deg]  [deg]                   [']
245.0463 -15.7173   10.5  31.6 -137.5   0.0636   1.1    6.0	Sco X-1
254.6035  35.3815   12.9  33.6  -29.0   0.0498   0.9    7.5	Her X-1
256.1184 -37.8828    4.5  44.4 -171.7  -0.1904  -2.6    6.7	4U 1700-377
256.5713 -36.4327    8.3  42.9 -171.5  -0.0959  -1.4    6.6	GX 349+2
263.0264 -24.6915   55.1  30.1 -175.1  -0.0104  -0.2    3.4	GX 1+4
264.7134 -44.3998    5.2  49.3  177.6  -0.2284  -2.2    3.3	4U 1735-44
268.4003  -1.4182    4.5   6.2 -177.1  -0.1054  -2.6    2.8	SW J1753.5-0127
270.1178 -25.2148    0.0  29.9  172.0   0.0468   1.0   12.2	GX 5-1
270.4495 -25.7329    3.2  30.5  171.4   0.1714   3.6    8.0	GRS 1758-258
274.1492 -14.0724   14.5  19.4  159.3  -0.0359  -0.8    8.6	GX 17+2
275.7535 -30.5090    0.0  35.7  163.9  -0.0245  -0.4   12.3	H1820-303
285.0186 -24.8089    6.0  33.2  146.8  -0.1194  -1.9    6.8	HT1900.1-2455
288.7671  11.0968   57.9  20.2   63.6   0.0102   0.2    9.3	GRS 1915+105
299.5457  35.2484   14.0  41.3   31.6  -0.0723  -0.8    3.6	Cyg X-1
308.2098  40.7816    4.7  50.0   31.4   0.5281   2.5   11.2	Cyg X-3
262.8679 -33.7139   60.8  38.9 -178.1  -0.0120  -0.2    9.4	GX 354-0
268.8597 -20.2975    0.9  25.0  174.5   0.6075  12.7 ------	UNKNOWN
Post-slew image of 15-350 keV band
Time interval of the image:
73.916590 290.916590

# RAcent  DECcent POSerr Theta    Phi  PeakCts   SNR AngSep     Name
#  [deg]    [deg]    ['] [deg]  [deg]                   [']
244.9880 -15.6449    0.8  23.2  -83.4   6.9589  14.6    0.6	Sco X-1
254.4658  35.3044   11.6  57.3  -15.0  -1.4965  -1.0    2.3	Her X-1
256.0562 -37.7677    3.7  20.7 -151.3   1.2134   3.1    5.6	4U 1700-377
256.4181 -36.4745    3.4  19.5 -149.7   1.3322   3.4    3.2	GX 349+2
262.8431 -24.7636    6.2   7.1 -130.9   0.6834   1.9    9.1	GX 1+4
264.8960 -44.4631    8.5  24.4 -174.1   0.5879   1.4    6.6	4U 1735-44
268.5100  -1.4551    8.7  18.8   -2.2   0.5339   1.3    8.5	SW J1753.5-0127
270.3773 -25.1544    6.3   5.1  163.4   0.7782   2.0    6.8	GX 5-1
270.3351 -25.6769    5.2   5.5  165.3   1.0817   2.7    4.3	GRS 1758-258
273.9580 -13.9871    3.2   8.0   37.3   1.3878   3.6    4.1	GX 17+2
275.8021 -30.2714   12.2  11.8  148.3   0.3786   0.9    8.6	H1820-303
285.1884 -24.7757   14.9  15.7  108.6  -0.3674  -0.8   12.0	HT1900.1-2455
288.9193  11.0434    8.0  37.0   32.9   1.0512   1.4    9.2	GRS 1915+105
263.0438 -33.6882   14.0  14.4 -161.1   0.3176   0.8    9.2	GX 354-0
256.8735 -43.2844    3.1  25.1 -160.1   1.5451   3.7 ------	UNKNOWN
219.5852 -36.6327    2.1  45.7 -122.9  10.1443   5.6 ------	UNKNOWN
231.7984   7.1041    3.0  45.6  -57.9   7.4865   3.9 ------	UNKNOWN