Analysis Summary
Notes:
- 1) No attempt has been made to eliminate the non-significant decimal places.
- 2) This batgrbproduct analysis is done using the HEASARC data.
- 3) This batgrbproduct analysis is using the flight position for the mask-weighting calculation.
======================================================================
BAT GRB EVENT DATA PROCESSING REPORT
Process Script Ver: batgrbproduct v2.48
Process Start Time: Wed Jun 14 12:22:37 EDT 2023
Host Name: batproc1
Current Working Dir: /local/data/bat1/alien/Swift_3rdBATcatalog/event/batevent_reproc/trigger1125809
======================================================================
Trigger: 01125809 Segment: 000
BAT Trigger Time: 686229142.08 [s; MET]
Trigger Stop: 686229143.104 [s; MET]
UTC: 2022-09-30T11:11:52.128760 [includes UTCF correction]
Where From?: TDRSS position message
BAT
RA: 64.7373600672291 Dec: 13.3517442973112 [deg; J2000]
Catalogged Source?: NO
Point Source?: YES
GRB Indicated?: YES [ by BAT flight software ]
Image S/N Ratio: 7.33
Image Trigger?: NO
Rate S/N Ratio: 41.206795556073 [ if not an image trigger ]
Image S/N Ratio: 7.33
Analysis Position: [ source = BAT ]
RA: 64.7373600672291 Dec: 13.3517442973112 [deg; J2000]
Refined Position: [ source = BAT pre-slew burst ]
RA: 64.7278987133664 Dec: 13.3505427647535 [deg; J2000]
{ 04h 18m 54.7s , +13d 21' 02.0" }
+/- 1.67469535989671 [arcmin] (estimated 90% radius based on SNR)
+/- 0.733363629102995 [arcmin] (formal 1-sigma fit error)
SNR: 14.5616326220971
Angular difference between the analysis and refined position is 0.557023 arcmin
Partial Coding Fraction: 0.1103516 [ including projection effects ]
Duration
T90: 182.095999956131 +/- 95.8901187601642
Measured from: -1.30400002002716
to: 180.791999936104 [s; relative to TRIGTIME]
T50: 60.864000082016 +/- 22.9323331127479
Measured from: 1.49599993228912
to: 62.3600000143051 [s; relative to TRIGTIME]
Fluence
Peak Flux (peak 1 second)
Measured from: -0.484000086784363
to: 0.515999913215637 [s; relative to TRIGTIME]
Total Fluence
Measured from: -3.41600000858307
to: 224.199999928474 [s; relative to TRIGTIME]
Band 1 Band 2 Band 3 Band 4
15-25 25-50 50-100 100-350 keV
Total 1.915492 3.265906 2.505995 0.753369
0.196245 0.207046 0.185951 0.154441 [error]
Peak 0.131604 0.289576 0.268082 0.122741
0.032331 0.037352 0.037634 0.030254 [error]
[ fluence units of on-axis counts / fully illuminated detector ]
======================================================================
====== Table of the duration information =============================
Value tstart tstop
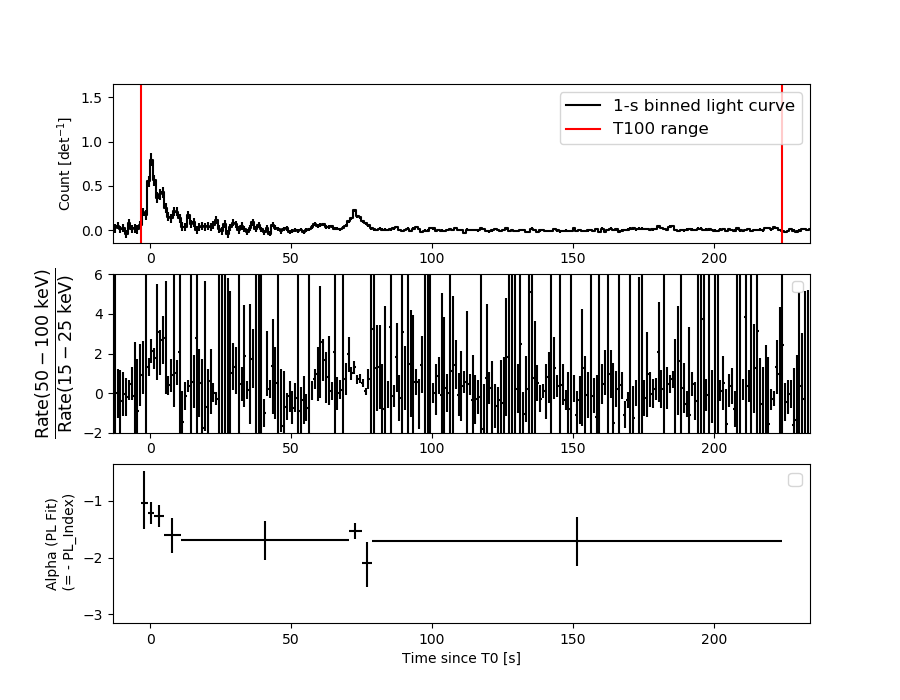
T100 227.616 -3.416 224.200
T90 182.096 -1.304 180.792
T50 60.864 1.496 62.360
Peak 1.000 -0.484 0.516
====== Spectral Analysis Summary =====================================
Model : spectral model: simple power-law (PL) and cutoff power-law (CPL)
Ph_index : photon index: E^{Ph_index}
Ph_90err : 90% error of the photon index
Epeak : Epeak in keV
Epeak_90err: 90% error of Epeak
Norm : normalization at 50 keV in both the PL model and CPL model
Nomr_90err : 90% error of the normalization
chi2 : Chi-Squared
dof : degree of freedo
=== Time-averaged spectral analysis ===
(Best model with acceptable fit: PL)
Model Ph_index Ph_90err_low Ph_90err_hi Epeak Epeak_90err_low Epeak_90err_hi Norm Nomr_90err_low Norm_90err_hi chi2 dof
PL -1.480 -0.121 0.121 - - - 2.70e-03 -1.92e-04 1.92e-04 54.180 57
CPL -1.171 -0.368 0.527 139.202 -58.184 -139.202 3.83e-03 -1.27e-03 3.05e-03 52.950 56
=== 1-s peak spectral analysis ===
(Best model with acceptable fit: N/A)
Model Ph_index Ph_90err_low Ph_90err_hi Epeak Epeak_90err_low Epeak_90err_hi Norm Nomr_90err_low Norm_90err_hi chi2 dof
PL -1.290 -0.257 0.261 - - - 5.05e-02 -7.89e-03 7.87e-03 73.830 57
CPL -0.836 -0.589 1.325 143.030 -143.030 -143.030 8.22e-02 -3.84e-02 2.43e-01 73.340 56
=== Fluence/Peak Flux Summary ===
Model Band1 Band2 Band3 Band4 Band5 Total
15-25 25-50 50-100 100-350 15-150 15-350 keV
Fluence PL 7.70e-07 1.43e-06 2.05e-06 6.23e-06 5.84e-06 1.05e-05 erg/cm2
90%_error_low -9.59e-08 -1.11e-07 -1.81e-07 -1.11e-06 -4.45e-07 -1.25e-06 erg/cm2
90%_error_hi 9.95e-08 1.11e-07 1.80e-07 1.26e-06 4.47e-07 1.37e-06 erg/cm2
Peak flux PL 1.70e+00 1.94e+00 1.59e+00 2.17e+00 6.02e+00 7.40e+00 ph/cm2/s
90%_error_low -4.82e-01 -3.65e-01 -2.77e-01 -6.92e-01 -9.92e-01 -1.16e+00 ph/cm2/s
90%_error_hi 5.30e-01 3.57e-01 2.72e-01 8.54e-01 9.97e-01 1.17e+00 ph/cm2/s
Fluence CPL 7.28e-07 1.48e-06 2.11e-06 4.02e-06 5.74e-06 8.33e-06 erg/cm2
90%_error_low -1.15e-07 -1.31e-07 -2.01e-07 -1.88e-06 -4.80e-07 -1.91e-06 erg/cm2
90%_error_hi 1.17e-07 1.35e-07 2.05e-07 2.58e-06 4.76e-07 2.70e-06 erg/cm2
Peak flux CPL 1.53e+00 2.01e+00 1.68e+00 1.42e+00 5.94e+00 6.65e+00 ph/cm2/s
90%_error_low -5.96e-01 -4.00e-01 -3.45e-01 N/A -1.01e+00 -1.42e+00 ph/cm2/s
90%_error_hi 6.44e-01 4.17e-01 3.66e-01 N/A 1.02e+00 1.76e+00 ph/cm2/s
======================================================================
Image
Pre-slew 15.0-350.0 keV image (Event data)
#   RAcent    DECcent   POSerr    Theta     Phi              Peak Cts       SNR   Name
   64.7279    13.3505   0.0133    50.5685    15.9005         5.0384774     14.562 TRIG_01125809

Foreground time interval of the image:
 -3.416  15.421 (delta_t =  18.837 [sec])
Background time interval of the image:
-68.379  -3.416 (delta_t =  64.963 [sec])
Light Curves
Note: The mask-weighted lightcurves have units of either count/det or counts/sec/det, where a det is 0.4 x 0.4 = 0.16 sq cm.
Full-time range; 1 s binning
Other quick-look light curves:
- 64 ms binning (zoomed)
- 16 ms binning (zoomed)
- 8 ms binning (zoomed)
- 2 ms binning (zoomed)
- SN=5 or 10 s binning (full-time range)
- Raw light curve
Spectra
- 64 ms binning (zoomed)
- 16 ms binning (zoomed)
- 8 ms binning (zoomed)
- 2 ms binning (zoomed)
- SN=5 or 10 s binning (full-time range)
- Raw light curve
Spectra
Notes:
- 1) The fitting includes the systematic errors.
- 2) When the burst includes telescope slew time periods, the fitting uses an average response file made from multiple 5-s response files through out the slew time plus single time preiod for the non-slew times, and weighted by the total counts in the corresponding time period using addrmf. An average response file is needed becuase a spectral fit using the pre-slew DRM will introduce some errors in both a spectral shape and a normalization if the PHA file contains a lot of the slew/post-slew time interval.
- 3) For fits to more complicated models (e.g. a power-law over a cutoff power-law), the BAT team has decided to require a chi-square improvement of more than 6 for each extra dof.
Time averaged spectrum fit using the average DRM
Power-law model
Time interval is from   -3.416 sec. to  224.200 sec.

Spectral model in power-law:
------------------------------------------------------------
Parameters  : value       lower 90%   higher 90%
Photon index: -1.48018     ( -0.121448   0.12138 )
Norm@50keV  : 2.69768E-03    ( -0.000192386   0.00019209 )
------------------------------------------------------------
#Fit statistic  : Chi-Squared                   54.18     using 59 bins.
 Reduced chi-squared = 0.950526
# Null hypothesis probability of 5.82e-01 with 57 degrees of freedom

Photon flux (15-150 keV)    in 227.6 sec: 0.335021 ( -0.024981  0.025039 ) ph/cm2/s
Energy fluence (15-150 keV)             : 5.8447e-06 ( -4.45092e-07  4.47061e-07 ) ergs/cm2
Cutoff power-law model
Time interval is from   -3.416 sec. to  224.200 sec.
Spectral model in the cutoff power-law:
------------------------------------------------------------
Parameters  : value       lower 90%   higher 90%
Photon index: -1.17107     ( -0.368061   0.527404 )
Epeak [keV] : 139.202      ( -58.1872 -139.205 )
Norm@50keV  : 3.83306E-03    ( -0.00126577   0.00304799 )
------------------------------------------------------------
#Fit statistic  : Chi-Squared                   52.95     using 59 bins.
 Reduced chi-squared = 0.945536
# Null hypothesis probability of 5.91e-01 with 56 degrees of freedom

Photon flux (15-150 keV)    in 227.6 sec: 0.330833 ( -0.025795  0.025823 ) ph/cm2/s
Energy fluence (15-150 keV)             : 5.74107e-06 ( -4.80509e-07  4.76089e-07 ) ergs/cm2
1-s peak spectrum fit
Power-law model
Time interval is from   -0.484 sec. to    0.516 sec.

Spectral model in power-law:
------------------------------------------------------------
Parameters  : value       lower 90%   higher 90%
Photon index: -1.2899     ( -0.257337   0.261477 )
Norm@50keV  : 5.05418E-02    ( -0.00788832   0.00787258 )
------------------------------------------------------------
#Fit statistic  : Chi-Squared                   73.83     using 59 bins.
 Reduced chi-squared = 1.29526
# Null hypothesis probability of 6.63e-02 with 57 degrees of freedom

Photon flux (15-150 keV)    in 1 sec: 6.01876 ( -0.9924  0.99734 ) ph/cm2/s
Energy fluence (15-150 keV)             : 5.00749e-07 ( -8.21193e-08  8.23603e-08 ) ergs/cm2
Cutoff power-law model
Time interval is from   -0.484 sec. to    0.516 sec.
Spectral model in the cutoff power-law:
------------------------------------------------------------
Parameters  : value       lower 90%   higher 90%
Photon index: -0.83646     ( -0.589216   1.32504 )
Epeak [keV] : 143.030      ( -143.064 -143.064 )
Norm@50keV  : 8.22138E-02    ( -0.038411   0.24284 )
------------------------------------------------------------
#Fit statistic  : Chi-Squared                   73.34     using 59 bins.
 Reduced chi-squared = 1.30964
# Null hypothesis probability of 5.99e-02 with 56 degrees of freedom

Photon flux (15-150 keV)    in 1 sec: 5.93543 ( -1.01063  1.01645 ) ph/cm2/s
Energy fluence (15-150 keV)             : 4.93696e-07 ( -8.64095e-08  8.47729e-08 ) ergs/cm2
Time-resolved spectra
Distribution
T90 vs. Hardness ratio plot
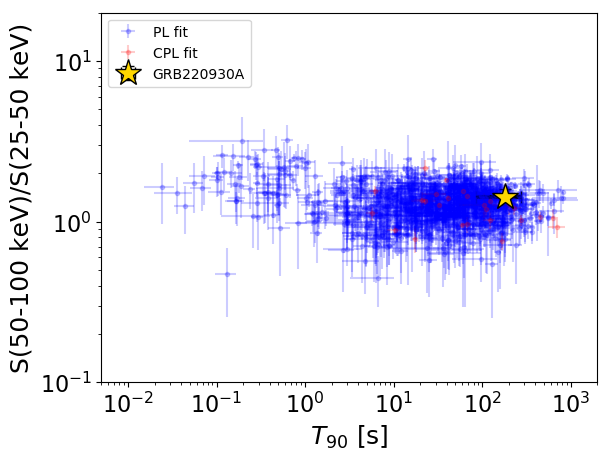
T90                                   = 182.096 sec.
Hardness ratio (energy fluence ratio) = 1.4338050722
S(15-50 keV) vs. S(50-150 keV) plot
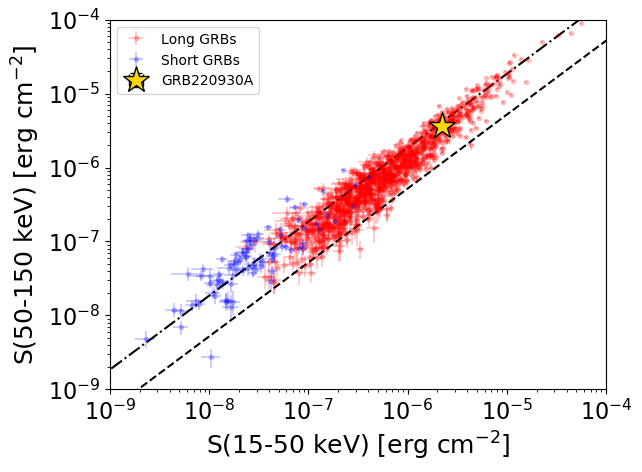
S(15-50 keV)  = 2.2009483e-06
S(50-150 keV) = 3.643864e-06
The dash-dotted line and the dashed line traces the fluences calculated from the Band function with Epeak = 15 and 150 keV, respectively. Both lines assume a canonical values of alpha = -1 and beta = -2.5.
Mask shadow pattern
IMX = 1.169526350298008E+00, IMY = -3.331601940831920E-01
Spacecraft aspect plot
Bright source in the pre-burst/pre-slew/post-slew images
Pre-burst image of 15-350 keV band
Time interval of the image:
-68.379400 -3.416000

# RAcent  DECcent POSerr Theta    Phi  PeakCts   SNR AngSep     Name
#  [deg]    [deg]    ['] [deg]  [deg]                   [']
326.1675  38.3219   56.1  39.2 -145.5   0.0418   0.2    0.2	Cyg X-2
 16.3491  -4.9384    2.6  34.6   92.5   1.3949   4.4 ------	UNKNOWN
 43.5715  39.7558    2.4  27.2  -21.5   0.6487   4.8 ------	UNKNOWN
338.1355  47.3097    3.4  32.0 -127.7   0.6256   3.4 ------	UNKNOWN
308.8763  41.6273    2.0  52.1 -139.3   3.5199   5.7 ------	UNKNOWN
 57.4781  66.3005    2.2  45.6  -57.8   3.1464   5.1 ------	UNKNOWN
Pre-slew background subtracted image of 15-350 keV band
Time interval of the image:
-3.416000 15.420600

# RAcent  DECcent POSerr Theta    Phi  PeakCts   SNR AngSep     Name
#  [deg]    [deg]    ['] [deg]  [deg]                   [']
326.1782  38.3260   65.8  39.2 -145.5   0.0180   0.2    0.4	Cyg X-2
340.3496  -9.0510    2.3  49.6  142.9   1.5723   5.0 ------	UNKNOWN
 64.7279  13.3506    0.8  50.6   15.9   5.0373  14.6 ------	UNKNOWN
319.9749  22.8146    2.6  47.4 -166.3   0.5719   4.5 ------	UNKNOWN
313.0898  26.8842    2.6  52.0 -158.6   0.8428   4.4 ------	UNKNOWN
346.7231  67.4966    3.1  41.0  -95.9   1.0655   3.7 ------	UNKNOWN
Post-slew image of 15-350 keV band
Time interval of the image:
156.820600 717.858300
720.920000 963.110800

# RAcent  DECcent POSerr Theta    Phi  PeakCts   SNR AngSep     Name
#  [deg]    [deg]    ['] [deg]  [deg]                   [']
 83.6218  22.0320    0.5  20.0 -113.2  31.3247  23.4    1.2	Crab
104.8092  -8.8654    2.8  45.6  -57.8  25.3233   4.1 ------	UNKNOWN