Analysis Summary
Notes:
- 1) No attempt has been made to eliminate the non-significant decimal places.
- 2) This batgrbproduct analysis is done using the HEASARC data.
- 3) This batgrbproduct analysis is using the flight position for the mask-weighting calculation.
  Angular difference between the analysis and refined position is Usage: arcmin

  Partial Coding Fraction:     [ including projection effects ]

  Duration
     T90: 1104.75199997425 +/- 7.63676293016238
        Measured from: 192.955999970436
                   to: 1297.70799994469     [s; relative to TRIGTIME]
     T50: 564.523999929428 +/- 5.75181634080781
        Measured from: 511.815999984741
                   to: 1076.33999991417     [s; relative to TRIGTIME]


  Fluence
     Peak Flux  (peak 1 second)
        Measured from: 1304.45200002193
                   to: 1305.45200002193     [s; relative to TRIGTIME]
     Total Fluence
        Measured from: 100.444000005722
                   to: 1370.2879999876     [s; relative to TRIGTIME]

             Band 1     Band 2     Band 3     Band 4
              15-25      25-50     50-100    100-350     keV
 Total    95.074681  89.307271  45.560583   7.839813
           0.499527   0.504763   0.437629   0.405189 [error]
 Peak      0.106299   0.132753   0.081216   0.007165
           0.014210   0.014825   0.011910   0.011139 [error]

     [ fluence units of on-axis counts / fully illuminated detector ]

======================================================================


====== Table of the duration information =============================

        Value   tstart    tstop
T100 1269.844  100.444 1370.288
T90  1104.752  192.956 1297.708
T50   564.524  511.816 1076.340
Peak    1.000 1304.452 1305.452


====== Spectral Analysis Summary =====================================

Model      : spectral model: simple power-law (PL) and cutoff power-law (CPL)
Ph_index   : photon index: E^{Ph_index}
Ph_90err   : 90% error of the photon index
Epeak      : Epeak in keV
Epeak_90err: 90% error of Epeak
Norm       : normalization at 50 keV in both the PL model and CPL model
Nomr_90err : 90% error of the normalization
chi2       : Chi-Squared
dof        : degree of freedo

=== Time-averaged spectral analysis ===
(Best model with acceptable fit: N/A)

Model Ph_index Ph_90err_low Ph_90err_hi  Epeak  Epeak_90err_low  Epeak_90err_hi  Norm       Nomr_90err_low    Norm_90err_hi    chi2    dof
PL      -2.062    -0.031      0.031       -           -               -         1.04e-02     -1.50e-04          1.50e-04      94.840   57
CPL     -1.994    -0.006      0.038        5.615      -4.821        -2.775      1.10e-02     -2.34e-04          3.23e-04      97.850   56


=== 1-s peak spectral analysis ===
(Best model with acceptable fit: N/A)

Model Ph_index Ph_90err_low Ph_90err_hi  Epeak  Epeak_90err_low  Epeak_90err_hi  Norm       Nomr_90err_low    Norm_90err_hi    chi2    dof
PL      -1.844      N/A       N/A          -           -               -         1.71e-02        N/A               N/A        194.760   57
CPL     -1.558      N/A       N/A          69.335      N/A           N/A         2.47e-02        N/A               N/A        194.390   56


=== Fluence/Peak Flux Summary ===

              Model    Band1     Band2     Band3     Band4     Band5     Total
                       15-25     25-50    50-100    100-350    15-150    15-350    keV
Fluence         PL   2.77e-05  3.62e-05  3.47e-05  5.90e-05  1.18e-04  1.58e-04   erg/cm2
      90%_error_low -9.15e-07 -6.67e-07 -6.09e-07 -2.47e-06 -1.74e-06 -2.68e-06   erg/cm2
      90%_error_hi   9.31e-07  6.65e-07  6.08e-07  2.55e-06  1.74e-06  2.71e-06   erg/cm2
Peak flux       PL   9.81e-01  8.06e-01  4.49e-01  3.69e-01  2.40e+00  2.61e+00   ph/cm2/s
      90%_error_low     N/A       N/A       N/A       N/A       N/A       N/A     ph/cm2/s
      90%_error_hi      N/A       N/A       N/A       N/A       N/A       N/A     ph/cm2/s

Fluence        CPL   2.86e-05  3.61e-05  3.43e-05  6.67e-05  1.19e-04  1.66e-04   erg/cm2
      90%_error_low -1.44e-06 -1.25e-06 -2.55e-06 -7.59e-06 -5.52e-06 -1.08e-05   erg/cm2
      90%_error_hi   1.15e-06  7.18e-07  7.89e-07  2.77e-06  1.85e-06  2.69e-06   erg/cm2
Peak flux      CPL   9.49e-01  8.35e-01  4.54e-01  2.52e-01  2.38e+00  2.49e+00   ph/cm2/s
      90%_error_low     N/A       N/A       N/A       N/A       N/A       N/A     ph/cm2/s
      90%_error_hi      N/A       N/A       N/A       N/A       N/A       N/A     ph/cm2/s

======================================================================
Image
Pre-slew 15.0-350.0 keV image (Event data)

#   RAcent    DECcent   POSerr    Theta     Phi              Peak Cts       SNR   Name

Foreground time interval of the image:
  0.000  64.000 (delta_t =  64.000 [sec])
Background time interval of the image:
-12.899  73.501 (delta_t =  86.400 [sec])
Light Curves
Note: The mask-weighted lightcurves have units of either count/det or counts/sec/det, where a det is 0.4 x 0.4 = 0.16 sq cm.
Full-time range; 1 s binning
Other quick-look light curves:
- 64 ms binning (zoomed)
- 16 ms binning (zoomed)
- 8 ms binning (zoomed)
- 2 ms binning (zoomed)
- SN=5 or 10 s binning (full-time range)
- Raw light curve
Spectra
- 64 ms binning (zoomed)
- 16 ms binning (zoomed)
- 8 ms binning (zoomed)
- 2 ms binning (zoomed)
- SN=5 or 10 s binning (full-time range)
- Raw light curve
Spectra
Notes:
- 1) The fitting includes the systematic errors.
- 2) When the burst includes telescope slew time periods, the fitting uses an average response file made from multiple 5-s response files through out the slew time plus single time preiod for the non-slew times, and weighted by the total counts in the corresponding time period using addrmf. An average response file is needed becuase a spectral fit using the pre-slew DRM will introduce some errors in both a spectral shape and a normalization if the PHA file contains a lot of the slew/post-slew time interval.
- 3) For fits to more complicated models (e.g. a power-law over a cutoff power-law), the BAT team has decided to require a chi-square improvement of more than 6 for each extra dof.
Time averaged spectrum fit using the average DRM
Power-law model

Multiple GTIs in the spectrum
tstart tstop
100.444000 303.024300
348.000000 571.777000
573.000000 1370.288000

Spectral model in power-law:
------------------------------------------------------------
Parameters  : value       lower 90%   higher 90%
Photon index: -2.06248     ( -0.0309938   0.0310021 )
Norm@50keV  : 1.04242E-02    ( -0.000150152   0.000150145 )
------------------------------------------------------------
#Fit statistic  : Chi-Squared                   94.84     using 59 bins.
 Reduced chi-squared = 1.66386
# Null hypothesis probability of 1.23e-03 with 57 degrees of freedom

Photon flux (15-150 keV)    in 1224 sec: 1.61041 ( -0.03396  0.03425 ) ph/cm2/s
Energy fluence (15-150 keV)             : 0.000118177 ( -1.73948e-06  1.74059e-06 ) ergs/cm2
Cutoff power-law model

Multiple GTIs in the spectrum
tstart tstop
100.444000 303.024300
348.000000 571.777000
573.000000 1370.288000
Spectral model in the cutoff power-law:
------------------------------------------------------------
Parameters  : value       lower 90%   higher 90%
Photon index: -1.9988     ( -0.000997819   0.0429375 )
Epeak [keV] : 1.24735      ( -0.45283 1.59288 )
Norm@50keV  : 1.10040E-02    ( -0.000188473   0.000368318 )
------------------------------------------------------------
#Fit statistic  : Chi-Squared                   97.59     using 59 bins.
 Reduced chi-squared = 1.74268
# Null hypothesis probability of 4.87e-04 with 56 degrees of freedom

Photon flux (15-150 keV)    in 1224 sec: 1.63242 ( -0.03382  0.03468 ) ph/cm2/s
Energy fluence (15-150 keV)             : 0.00011902 ( -5.52419e-06  1.85039e-06 ) ergs/cm2
1-s peak spectrum fit
Power-law model

Time interval is from 1304.452 sec. to 1305.452 sec.

Spectral model in power-law:
------------------------------------------------------------
Parameters  : value       lower 90%   higher 90%
Photon index: -1.84388     (       )
Norm@50keV  : 1.71191E-02    (     )
------------------------------------------------------------
#Fit statistic  : Chi-Squared                  194.76     using 59 bins.
 Reduced chi-squared = 3.41684
# Null hypothesis probability of 5.95e-17 with 57 degrees of freedom

Photon flux (15-150 keV)    in 1 sec: 2.40044 (    ) ph/cm2/s
Energy fluence (15-150 keV)             : 1.57445e-07 ( 0  0 ) ergs/cm2
Cutoff power-law model
Time interval is from 1304.452 sec. to 1305.452 sec.
Spectral model in the cutoff power-law:
------------------------------------------------------------
Parameters  : value       lower 90%   higher 90%
Photon index: -1.55789     (       )
Epeak [keV] : 69.3354      (   )
Norm@50keV  : 2.46755E-02    (     )
------------------------------------------------------------
#Fit statistic  : Chi-Squared                  194.39     using 59 bins.
 Reduced chi-squared = 3.47125
# Null hypothesis probability of 3.61e-17 with 56 degrees of freedom

Photon flux (15-150 keV)    in 1 sec: 2.37773 (    ) ph/cm2/s
Energy fluence (15-150 keV)             : 1.53624e-07 ( 0  0 ) ergs/cm2
Time-resolved spectra

Distribution
T90 vs. Hardness ratio plot

T90                                   = N/A sec.
Hardness ratio (energy fluence ratio) = N/A
S(15-50 keV) vs. S(50-150 keV) plot
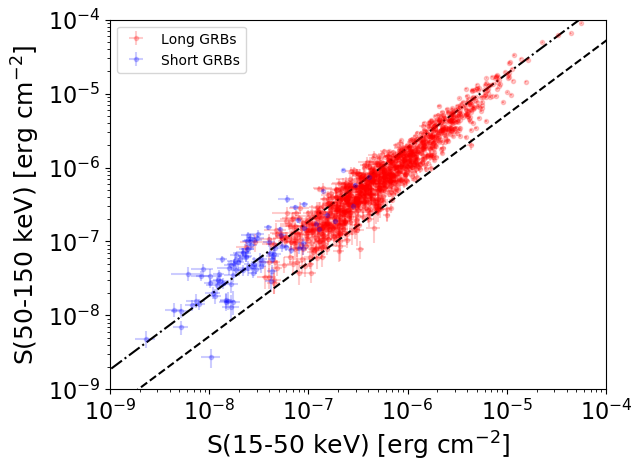
S(15-50 keV)  = N/A
S(50-150 keV) = N/A
The dash-dotted line and the dashed line traces the fluences calculated from the Band function with Epeak = 15 and 150 keV, respectively. Both lines assume a canonical values of alpha = -1 and beta = -2.5.
Mask shadow pattern

IMX = 0, IMY = 0
Spacecraft aspect plot
Bright source in the pre-burst/pre-slew/post-slew images
Pre-burst image of 15-350 keV band
Time interval of the image:
-12.899410 73.500600

# RAcent  DECcent POSerr Theta    Phi  PeakCts   SNR AngSep     Name
#  [deg]    [deg]    ['] [deg]  [deg]                   [']
244.9840 -15.6309    0.4  17.2  -78.6  15.4401  28.4    0.6	Sco X-1
254.3808  35.1978    4.7  52.7    0.9  -3.9162  -2.5    9.5	Her X-1
256.0190 -37.8347    1.3  21.7 -155.7   4.6528   8.7    1.6	4U 1700-377
256.3419 -36.3446    7.8  20.3 -155.1  -0.7626  -1.5    6.5	GX 349+2
262.8527 -24.7415    6.4   7.8 -170.4   0.9325   1.8    8.5	GX 1+4
264.7198 -44.4589   24.5  27.6 -173.3   0.2705   0.5    1.1	4U 1735-44
268.2254  -1.3258    7.2  16.5   28.9  -0.8339  -1.6   11.5	SW J1753.5-0127
270.2031 -24.9426    5.2  10.5  150.3   1.0546   2.2    9.3	GX 5-1
270.4283 -25.5642    0.0  11.1  151.6   0.8768   1.9   12.7	GRS 1758-258
273.9851 -13.9462    2.9  11.1   85.6   2.2139   4.0    5.5	GX 17+2
276.0918 -30.3853    4.1  18.1  150.1  -1.5344  -2.8    8.7	H1820-303
284.8510 -24.8641    4.3  22.0  124.4   1.7120   2.7   10.6	HT1900.1-2455
288.6644  10.9728   11.0  37.8   53.8   1.5639   1.0    8.1	GRS 1915+105
262.9698 -33.8329  105.4  16.9 -170.7   0.0532   0.1    1.0	GX 354-0
288.2548  19.8125    1.2  44.4   44.8  15.9341   9.5 ------	UNKNOWN
292.4092 -28.1307    3.3  29.4  127.2   2.9724   3.5 ------	UNKNOWN
291.1345 -71.6987    2.3  57.2  179.4  12.7798   5.1 ------	UNKNOWN
225.7715 -70.1317    2.7  57.8 -156.4  12.5074   4.3 ------	UNKNOWN
224.5977 -26.7932    2.5  36.7 -102.8   5.3748   4.6 ------	UNKNOWN
217.8282 -41.7293    1.8  45.7 -122.9  13.6909   6.3 ------	UNKNOWN
Pre-slew background subtracted image of 15-350 keV band
Time interval of the image:
0.000000 64.000000

# RAcent  DECcent POSerr Theta    Phi  PeakCts   SNR AngSep     Name
#  [deg]    [deg]    ['] [deg]  [deg]                   [']
244.9834 -15.6310    0.4  17.2  -78.6   5.7345  26.6    0.6	Sco X-1
254.5611  35.3813   13.3  52.9    1.1  -0.5492  -0.9    5.6	Her X-1
256.0275 -37.8363    1.6  21.7 -155.7   1.5554   7.2    2.0	4U 1700-377
256.2932 -36.3462   20.2  20.3 -155.0  -0.1167  -0.6    8.3	GX 349+2
263.1672 -24.7040   20.0   7.8 -172.5   0.1180   0.6    9.0	GX 1+4
264.7221 -44.4591   13.9  27.6 -173.3   0.1890   0.8    1.0	4U 1735-44
268.2252  -1.3258    8.7  16.5   28.9  -0.2691  -1.3   11.5	SW J1753.5-0127
270.1485 -25.0085    8.8  10.6  150.7   0.2446   1.3    8.5	GX 5-1
270.4152 -25.5669    5.3  11.1  151.7   0.3894   2.2   12.2	GRS 1758-258
273.9999 -13.9397    2.9  11.1   85.6   0.8443   3.9    5.8	GX 17+2
276.0944 -30.4092    3.8  18.1  150.1  -0.6559  -3.0    9.1	H1820-303
284.8582 -24.8879    3.7  22.0  124.5   0.7791   3.1    9.9	HT1900.1-2455
288.6259  11.0196   10.8  37.8   53.7   0.6182   1.1   11.1	GRS 1915+105
262.9776 -33.8339   72.5  16.9 -170.8   0.0310   0.2    0.6	GX 354-0
288.2538  19.8095    1.3  44.4   44.8   5.9611   8.7 ------	UNKNOWN
292.3974 -28.1369    3.0  29.4  127.2   1.2819   3.9 ------	UNKNOWN
228.5273 -47.9885    2.2  41.8 -135.9   1.9709   5.3 ------	UNKNOWN
Post-slew image of 15-350 keV band
Time interval of the image:
158.500580 303.024300
348.000000 571.777000
573.000000 1332.900600

# RAcent  DECcent POSerr Theta    Phi  PeakCts   SNR AngSep     Name
#  [deg]    [deg]    ['] [deg]  [deg]                   [']
254.5774  35.5096    6.5  33.5  -49.8  15.8722   1.8   11.6	Her X-1
262.8279 -24.6023   62.3  50.8 -144.7  -3.8158  -0.2   13.1	GX 1+4
268.2139  -1.4075   33.8  28.9 -129.8  -2.8473  -0.3    9.6	SW J1753.5-0127
270.2538 -25.1220    9.1  48.2 -152.9  17.4898   1.3    3.1	GX 5-1
270.2831 -25.7561    6.9  48.8 -153.3  23.2298   1.7    1.3	GRS 1758-258
273.9721 -13.9847   14.0  36.6 -151.3   7.2807   0.8    3.7	GX 17+2
275.9305 -30.3669   57.4  51.5 -161.3   3.6648   0.2    0.3	H1820-303
285.0242 -24.9177  150.9  44.8 -170.8   1.0037   0.1    0.7	HT1900.1-2455
288.8062  11.0831    6.6   8.7 -178.6 -11.3227  -1.7    8.3	GRS 1915+105
299.6091  35.2013    0.7  18.4   35.8 110.5983  15.8    0.9	Cyg X-1
308.2251  40.8734   21.7  27.1   39.6   4.5133   0.5    7.1	Cyg X-3
326.3536  38.3190    7.6  37.7   57.4  32.1467   1.5    8.6	Cyg X-2
316.1950  38.5092    2.4  30.5   51.3  56.4905   4.7 ------	UNKNOWN
312.8015   2.8119    3.7  29.4  127.3  35.1769   3.2 ------	UNKNOWN
288.2647  19.7690    0.3   0.0  149.1 227.1049  33.6 ------	UNKNOWN
254.7523 -15.0946    3.4  48.0 -129.1 109.2544   3.4 ------	UNKNOWN
238.9625  32.8557    2.3  45.6  -57.9 158.5431   5.0 ------	UNKNOWN