Analysis Summary
Notes:
- 1) No attempt has been made to eliminate the non-significant decimal places.
- 2) This batgrbproduct analysis is done using the HEASARC data.
- 3) This batgrbproduct analysis is using the flight position for the mask-weighting calculation.
======================================================================
                  BAT GRB EVENT DATA PROCESSING REPORT
    Process Script Ver: batgrbproduct v2.48
    Process Start Time: Fri Nov  3 18:42:36 EDT 2023
             Host Name: batproc1
   Current Working Dir: /local/data/bat1/alien/Swift_3rdBATcatalog/event/batevent_reproc/trigger1129775
======================================================================

  Trigger: 01129775      Segment: 000

  BAT Trigger Time: 687656394.24   [s; MET]
      Trigger Stop: 687656395.264   [s; MET]
               UTC: 2022-10-16T23:39:24.191840    [includes UTCF correction]
       Where From?: TDRSS position message

  BAT
    RA: 38.9491080216353   Dec: -34.6241149888059  [deg; J2000]

     Catalogged Source?: NO
     Point Source?:      YES
     GRB Indicated?:     YES    [ by BAT flight software ]
     Image S/N Ratio:    15.3
     Image Trigger?:     NO
     Rate S/N Ratio:     44.2944691807002  [ if not an image trigger ]
     Image S/N Ratio:    15.3

  Analysis Position:   [ source = BAT ]
    RA: 38.9491080216353   Dec: -34.6241149888059  [deg; J2000]

  Refined Position:   [ source = BAT pre-slew burst ]
    RA: 38.9379596360006   Dec: -34.6150782101858  [deg; J2000]
        { 02h 35m 45.1s , -34d 36' 54.3" }
         +/- 0.902618096643646 [arcmin] (estimated 90% radius based on SNR)
         +/- 0.270736379198722 [arcmin] (formal 1-sigma fit error)
    SNR: 35.2114607495491

  Angular difference between the analysis and refined position is 0.772660 arcmin

  Partial Coding Fraction: 0.53125    [ including projection effects ]

  Duration
     T90: 21.9839999675751 +/- 5.77567315918603
        Measured from: -1.7039999961853
                   to: 20.2799999713898     [s; relative to TRIGTIME]
     T50: 5.26399993896484 +/- 0.904247879730355
        Measured from: 0.424000024795532
                   to: 5.68799996376038     [s; relative to TRIGTIME]


  Fluence
     Peak Flux  (peak 1 second)
        Measured from: 0.0279999971389771
                   to: 1.02799999713898     [s; relative to TRIGTIME]
     Total Fluence
        Measured from: -3.17599999904633
                   to: 29.7999999523163     [s; relative to TRIGTIME]

             Band 1     Band 2     Band 3     Band 4
              15-25      25-50     50-100    100-350     keV
 Total     0.770972   1.195091   1.111551   0.213114
           0.048165   0.052114   0.047547   0.039727 [error]
 Peak      0.075105   0.157846   0.166415   0.033622
           0.010300   0.012248   0.012098   0.008758 [error]

     [ fluence units of on-axis counts / fully illuminated detector ]

======================================================================


====== Table of the duration information =============================

        Value   tstart    tstop
T100   32.976   -3.176   29.800
T90    21.984   -1.704   20.280
T50     5.264    0.424    5.688
Peak    1.000    0.028    1.028


====== Spectral Analysis Summary =====================================

Model      : spectral model: simple power-law (PL) and cutoff power-law (CPL)
Ph_index   : photon index: E^{Ph_index}
Ph_90err   : 90% error of the photon index
Epeak      : Epeak in keV
Epeak_90err: 90% error of Epeak
Norm       : normalization at 50 keV in both the PL model and CPL model
Nomr_90err : 90% error of the normalization
chi2       : Chi-Squared
dof        : degree of freedo

=== Time-averaged spectral analysis ===
(Best model with acceptable fit: PL)

Model Ph_index Ph_90err_low Ph_90err_hi  Epeak  Epeak_90err_low  Epeak_90err_hi  Norm       Nomr_90err_low    Norm_90err_hi    chi2    dof
PL      -1.281    -0.083      0.084       -           -               -         6.84e-03     -3.20e-04          3.20e-04      63.210   57
CPL     -0.817    -0.341      0.370      139.095     -38.845       210.851      1.12e-02     -3.36e-03          5.26e-03      57.660   56


=== 1-s peak spectral analysis ===
(Best model with acceptable fit: PL)

Model Ph_index Ph_90err_low Ph_90err_hi  Epeak  Epeak_90err_low  Epeak_90err_hi  Norm       Nomr_90err_low    Norm_90err_hi    chi2    dof
PL      -1.004     -0.133     0.135       -           -               -         2.94e-02     -2.41e-03          2.40e-03      51.110   57
CPL     -0.332     -0.558     0.648      140.561     -43.351       351.896      5.95e-02     -2.59e-02          5.45e-02      46.780   56


=== Fluence/Peak Flux Summary ===

              Model    Band1     Band2     Band3     Band4     Band5     Total
                       15-25     25-50    50-100    100-350    15-150    15-350    keV
Fluence         PL   2.35e-07  4.93e-07  8.11e-07  3.02e-06  2.24e-06  4.56e-06   erg/cm2
      90%_error_low -2.07e-08 -2.63e-08 -4.63e-08 -3.70e-07 -1.16e-07 -4.01e-07   erg/cm2
      90%_error_hi   2.14e-08  2.61e-08  4.62e-08  4.04e-07  1.16e-07  4.30e-07   erg/cm2
Peak flux       PL   7.54e-01  1.02e+00  1.02e+00  1.83e+00  3.39e+00  4.63e+00   ph/cm2/s
      90%_error_low -1.16e-01 -1.01e-01 -9.16e-02 -3.23e-01 -2.81e-01 -4.15e-01   ph/cm2/s
      90%_error_hi   1.22e-01  9.98e-02  9.09e-02  3.63e-01  2.81e-01  4.26e-01   ph/cm2/s

Fluence        CPL   2.11e-07  5.10e-07  8.45e-07  1.65e-06  2.17e-06  3.22e-06   erg/cm2
      90%_error_low -2.61e-08 -2.96e-08 -5.30e-08 -5.46e-07 -1.26e-07 -5.53e-07   erg/cm2
      90%_error_hi   2.67e-08  3.00e-08  5.38e-08  8.95e-07  1.26e-07  8.85e-07   erg/cm2
Peak flux      CPL   6.41e-01  1.07e+00  1.11e+00  9.89e-01  3.32e+00  3.80e+00   ph/cm2/s
      90%_error_low -1.44e-01 -1.13e-01 -1.16e-01 -3.77e-01 -2.87e-01 -4.78e-01   ph/cm2/s
      90%_error_hi   1.51e-01  1.15e-01  1.19e-01  6.62e-01  2.86e-01  6.86e-01   ph/cm2/s

======================================================================
Image
Pre-slew 15.0-350.0 keV image (Event data)

#   RAcent    DECcent   POSerr    Theta     Phi              Peak Cts       SNR   Name
   38.9380   -34.6151   0.0055    24.2661   -69.1492         3.3941642     35.211 TRIG_01129775

Foreground time interval of the image:
 -3.176  15.261 (delta_t =  18.437 [sec])
Background time interval of the image:
-201.539  -3.176 (delta_t = 198.363 [sec])
Light Curves
Note: The mask-weighted lightcurves have units of either count/det or counts/sec/det, where a det is 0.4 x 0.4 = 0.16 sq cm.
Full-time range; 1 s binning
Other quick-look light curves:
- 64 ms binning (zoomed)
- 16 ms binning (zoomed)
- 8 ms binning (zoomed)
- 2 ms binning (zoomed)
- SN=5 or 10 s binning (full-time range)
- Raw light curve
Spectra
- 64 ms binning (zoomed)
- 16 ms binning (zoomed)
- 8 ms binning (zoomed)
- 2 ms binning (zoomed)
- SN=5 or 10 s binning (full-time range)
- Raw light curve
Spectra
Notes:
- 1) The fitting includes the systematic errors.
- 2) When the burst includes telescope slew time periods, the fitting uses an average response file made from multiple 5-s response files through out the slew time plus single time preiod for the non-slew times, and weighted by the total counts in the corresponding time period using addrmf. An average response file is needed becuase a spectral fit using the pre-slew DRM will introduce some errors in both a spectral shape and a normalization if the PHA file contains a lot of the slew/post-slew time interval.
- 3) For fits to more complicated models (e.g. a power-law over a cutoff power-law), the BAT team has decided to require a chi-square improvement of more than 6 for each extra dof.
Time averaged spectrum fit using the average DRM
Power-law model
Time interval is from   -3.176 sec. to   29.800 sec.

Spectral model in power-law:
------------------------------------------------------------
Parameters  : value       lower 90%   higher 90%
Photon index: -1.28087     ( -0.0834755   0.0836576 )
Norm@50keV  : 6.83597E-03    ( -0.000319943   0.000319931 )
------------------------------------------------------------
#Fit statistic  : Chi-Squared                   63.21     using 59 bins.
 Reduced chi-squared = 1.10895
# Null hypothesis probability of 2.66e-01 with 57 degrees of freedom

Photon flux (15-150 keV)    in 32.98 sec: 0.812753 ( -0.039517  0.039577 ) ph/cm2/s
Energy fluence (15-150 keV)             : 2.23867e-06 ( -1.15718e-07  1.16218e-07 ) ergs/cm2
Cutoff power-law model

Time interval is from   -3.176 sec. to   29.800 sec.
Spectral model in the cutoff power-law:
------------------------------------------------------------
Parameters  : value       lower 90%   higher 90%
Photon index: -0.81682     ( -0.340649   0.369794 )
Epeak [keV] : 139.095      ( -38.8446 210.851 )
Norm@50keV  : 1.12348E-02    ( -0.00335978   0.00525646 )
------------------------------------------------------------
#Fit statistic  : Chi-Squared                   57.66     using 59 bins.
 Reduced chi-squared = 1.02964
# Null hypothesis probability of 4.14e-01 with 56 degrees of freedom

Photon flux (15-150 keV)    in 32.98 sec: 0.793048 ( -0.041986  0.041989 ) ph/cm2/s
Energy fluence (15-150 keV)             : 2.17456e-06 ( -1.2627e-07  1.25989e-07 ) ergs/cm2
1-s peak spectrum fit
Power-law model
Time interval is from    0.028 sec. to    1.028 sec.

Spectral model in power-law:
------------------------------------------------------------
Parameters  : value       lower 90%   higher 90%
Photon index: -1.00359     ( -0.133393   0.135423 )
Norm@50keV  : 2.94191E-02    ( -0.00240654   0.00240439 )
------------------------------------------------------------
#Fit statistic  : Chi-Squared                   51.11     using 59 bins.
 Reduced chi-squared = 0.896667
# Null hypothesis probability of 6.95e-01 with 57 degrees of freedom

Photon flux (15-150 keV)    in 1 sec: 3.38764 ( -0.28056  0.28078 ) ph/cm2/s
Energy fluence (15-150 keV)             : 3.17753e-07 ( -2.84786e-08  2.86407e-08 ) ergs/cm2
Cutoff power-law model

Time interval is from    0.028 sec. to    1.028 sec.
Spectral model in the cutoff power-law:
------------------------------------------------------------
Parameters  : value       lower 90%   higher 90%
Photon index: -0.332161     ( -0.557813   0.64837 )
Epeak [keV] : 140.561      ( -43.3511 351.896 )
Norm@50keV  : 5.95055E-02    ( -0.0258889   0.0545339 )
------------------------------------------------------------
#Fit statistic  : Chi-Squared                   46.78     using 59 bins.
 Reduced chi-squared = 0.835357
# Null hypothesis probability of 8.05e-01 with 56 degrees of freedom

Photon flux (15-150 keV)    in 1 sec: 3.32390 ( -0.28717  0.28648 ) ph/cm2/s
Energy fluence (15-150 keV)             : 3.09072e-07 ( -3.04471e-08  3.01859e-08 ) ergs/cm2
Time-resolved spectra

Distribution
T90 vs. Hardness ratio plot
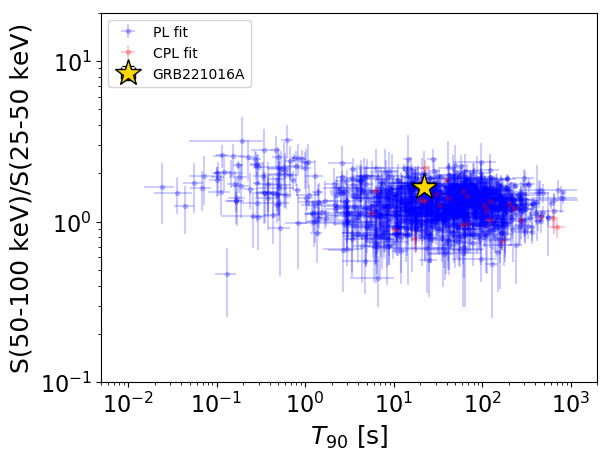
T90                                   = 21.984 sec.
Hardness ratio (energy fluence ratio) = 1.64622758354
S(15-50 keV) vs. S(50-150 keV) plot
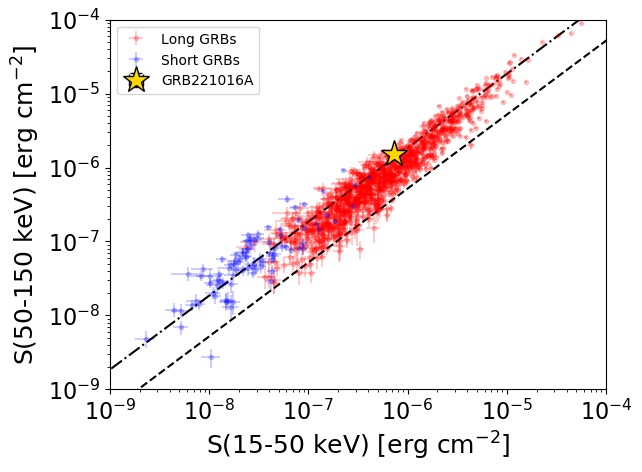
S(15-50 keV)  = 7.274393e-07
S(50-150 keV) = 1.5112587e-06
The dash-dotted line and the dashed line traces the fluences calculated from the Band function with Epeak = 15 and 150 keV, respectively. Both lines assume a canonical values of alpha = -1 and beta = -2.5.
Mask shadow pattern

IMX = 1.604581815327354E-01, IMY = 4.212827896937619E-01
Spacecraft aspect plot

Bright source in the pre-burst/pre-slew/post-slew images
Pre-burst image of 15-350 keV band
Time interval of the image:
-201.539400 -3.176000

# RAcent  DECcent POSerr Theta    Phi  PeakCts   SNR AngSep     Name
#  [deg]    [deg]    ['] [deg]  [deg]                   [']
 83.6459  22.0219    4.7  55.3  166.6   6.5298   2.5    0.8	Crab
341.8213 -38.0477    2.4  57.2  -16.1   7.6981   4.7 ------	UNKNOWN
Pre-slew background subtracted image of 15-350 keV band
Time interval of the image:
-3.176000 15.260590

# RAcent  DECcent POSerr Theta    Phi  PeakCts   SNR AngSep     Name
#  [deg]    [deg]    ['] [deg]  [deg]                   [']
 83.8063  22.0146    9.0  55.4  166.7  -0.4122  -1.3    9.6	Crab
 56.2092 -11.6701    2.5  17.9 -151.3   0.2928   4.7 ------	UNKNOWN
 38.9380 -34.6151    0.3  24.3  -69.1   3.3942  35.2 ------	UNKNOWN
 95.6192  -1.0189    2.5  58.0 -162.5   1.9952   4.6 ------	UNKNOWN
Post-slew image of 15-350 keV band
Time interval of the image:
75.060600 350.060590

# RAcent  DECcent POSerr Theta    Phi  PeakCts   SNR AngSep     Name
#  [deg]    [deg]    ['] [deg]  [deg]                   [']
357.0343  -7.2209    2.8  47.2   49.2   7.3637   4.1  468.2	UNKNOWN
321.2465 -48.6870    2.0  57.1  -16.1  11.4746   5.7 ------	UNKNOWN