Analysis Summary
Notes:
- 1) No attempt has been made to eliminate the non-significant decimal places.
- 2) This batgrbproduct analysis is done using the HEASARC data.
- 3) This batgrbproduct analysis is using the flight position for the mask-weighting calculation.
======================================================================
                  BAT GRB EVENT DATA PROCESSING REPORT
    Process Script Ver: batgrbproduct v2.48
    Process Start Time: Wed Jun 14 12:17:31 EDT 2023
             Host Name: batproc1
   Current Working Dir: /local/data/bat1/alien/Swift_3rdBATcatalog/event/batevent_reproc/trigger1131029
======================================================================

  Trigger: 01131029      Segment: 000

  BAT Trigger Time: 688309257.216   [s; MET]
      Trigger Stop: 688309261.312   [s; MET]
               UTC: 2022-10-24T13:00:27.123520    [includes UTCF correction]
       Where From?: TDRSS position message

  BAT
    RA: 169.71820537361   Dec: 33.041010097512  [deg; J2000]

     Catalogged Source?: NO
     Point Source?:      YES
     GRB Indicated?:     YES    [ by BAT flight software ]
     Image S/N Ratio:    10.22
     Image Trigger?:     NO
     Rate S/N Ratio:     14.3178210632764  [ if not an image trigger ]
     Image S/N Ratio:    10.22

  Analysis Position:   [ source = BAT ]
    RA: 169.71820537361   Dec: 33.041010097512  [deg; J2000]

  Refined Position:   [ source = BAT pre-slew burst ]
    RA: 169.70305184754   Dec: 33.0775693082221  [deg; J2000]
        { 11h 18m 48.7s , +33d 04' 39.2" }
         +/- 2.90213383438735 [arcmin] (estimated 90% radius based on SNR)
         +/- 1.41124149618613 [arcmin] (formal 1-sigma fit error)
    SNR: 6.63885939538054

  Angular difference between the analysis and refined position is 2.322142 arcmin

  Partial Coding Fraction: 0.359375    [ including projection effects ]

  Duration
     T90: 122.175999879837 +/- 108.862343397387
        Measured from: 0.28000009059906
                   to: 122.455999970436     [s; relative to TRIGTIME]
     T50: 104.34399998188 +/- 214.003629602711
        Measured from: 2.67599999904633
                   to: 107.019999980927     [s; relative to TRIGTIME]


  Fluence
     Peak Flux  (peak 1 second)
        Measured from: 2.70000004768372
                   to: 3.70000004768372     [s; relative to TRIGTIME]
     Total Fluence
        Measured from: 0.00400006771087646
                   to: 221.276000022888     [s; relative to TRIGTIME]

             Band 1     Band 2     Band 3     Band 4
              15-25      25-50     50-100    100-350     keV
 Total     0.405574   0.910407   0.736447   0.194082
           0.112993   0.117692   0.104302   0.090791 [error]
 Peak      0.047639   0.069821   0.051363   0.023700
           0.011890   0.013638   0.012344   0.009952 [error]

     [ fluence units of on-axis counts / fully illuminated detector ]

======================================================================


====== Table of the duration information =============================

        Value   tstart    tstop
T100  221.272    0.004  221.276
T90   122.176    0.280  122.456
T50   104.344    2.676  107.020
Peak    1.000    2.700    3.700


====== Spectral Analysis Summary =====================================

Model      : spectral model: simple power-law (PL) and cutoff power-law (CPL)
Ph_index   : photon index: E^{Ph_index}
Ph_90err   : 90% error of the photon index
Epeak      : Epeak in keV
Epeak_90err: 90% error of Epeak
Norm       : normalization at 50 keV in both the PL model and CPL model
Nomr_90err : 90% error of the normalization
chi2       : Chi-Squared
dof        : degree of freedo

=== Time-averaged spectral analysis ===
(Best model with acceptable fit: PL)

Model Ph_index Ph_90err_low Ph_90err_hi  Epeak  Epeak_90err_low  Epeak_90err_hi  Norm       Nomr_90err_low    Norm_90err_hi    chi2    dof
PL      -1.343    -0.245      0.246       -           -               -         7.06e-04     -1.03e-04          1.03e-04      53.620   57
CPL     -0.409    -1.023      1.434       88.291     -25.247       -88.291      2.01e-03     -2.01e-03          7.31e-03      51.490   56


=== 1-s peak spectral analysis ===
(Best model with acceptable fit: PL)

Model Ph_index Ph_90err_low Ph_90err_hi  Epeak  Epeak_90err_low  Epeak_90err_hi  Norm       Nomr_90err_low    Norm_90err_hi    chi2    dof
PL      -1.462     -0.338     0.329       -           -               -         1.23e-02     -2.65e-03          2.62e-03      53.230   57
CPL     -0.740     -0.983     1.614       88.221     -35.996       -88.221      2.87e-02     -2.87e-02          1.63e-01      52.180   56


=== Fluence/Peak Flux Summary ===

              Model    Band1     Band2     Band3     Band4     Band5     Total
                       15-25     25-50    50-100    100-350    15-150    15-350    keV
Fluence         PL   1.72e-07  3.48e-07  5.50e-07  1.92e-06  1.53e-06  2.99e-06   erg/cm2
      90%_error_low -4.23e-08 -5.52e-08 -9.97e-08 -6.52e-07 -2.46e-07 -7.40e-07   erg/cm2
      90%_error_hi   4.52e-08  5.44e-08  9.87e-08  8.48e-07  2.49e-07  9.03e-07   erg/cm2
Peak flux       PL   4.88e-01  5.02e-01  3.64e-01  4.24e-01  1.52e+00  1.78e+00   ph/cm2/s
      90%_error_low -1.57e-01 -1.12e-01 -9.55e-02 -1.84e-01 -3.21e-01 -3.79e-01   ph/cm2/s
      90%_error_hi   1.70e-01  1.10e-01  9.38e-02  2.46e-01  3.22e-01  3.83e-01   ph/cm2/s

Fluence        CPL   1.44e-07  3.79e-07  5.87e-07  6.19e-07  1.44e-06  1.73e-06   erg/cm2
      90%_error_low -5.36e-08 -6.66e-08 -1.14e-07 -4.21e-07 -2.67e-07 -4.97e-07   erg/cm2
      90%_error_hi   5.55e-08  6.98e-08  1.17e-07  1.54e-06  2.72e-07  8.63e-07   erg/cm2
Peak flux      CPL   4.33e-01  5.44e-01  3.93e-01  2.08e-01  1.50e+00  1.58e+00   ph/cm2/s
      90%_error_low -1.80e-01 -1.32e-01 -1.09e-01 -2.08e-01 -3.23e-01 -3.71e-01   ph/cm2/s
      90%_error_hi   1.91e-01  1.43e-01  1.15e-01  3.04e-01  3.24e-01  4.77e-01   ph/cm2/s

======================================================================
Image
Pre-slew 15.0-350.0 keV image (Event data)
#   RAcent    DECcent   POSerr    Theta     Phi              Peak Cts       SNR   Name
  169.7031    33.0776   0.0288    34.4709  -128.6459         0.9105759      6.639 TRIG_01131029

Foreground time interval of the image:
  0.004  34.285 (delta_t =  34.281 [sec])
Background time interval of the image:
-239.216   0.004 (delta_t = 239.220 [sec])
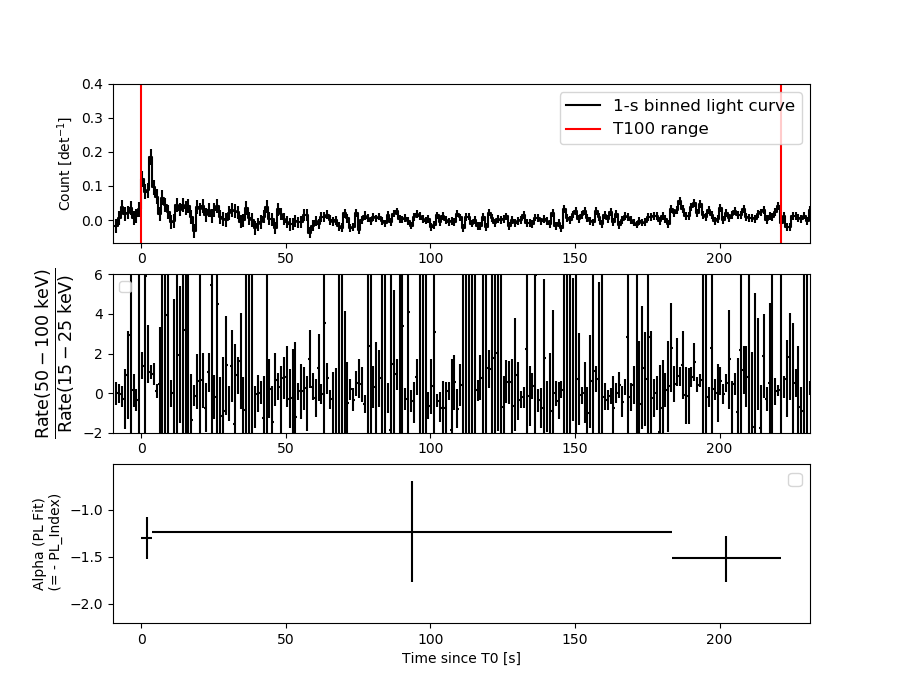
Light Curves
Note: The mask-weighted lightcurves have units of either count/det or counts/sec/det, where a det is 0.4 x 0.4 = 0.16 sq cm.
Full-time range; 1 s binning
Other quick-look light curves:
- 64 ms binning (zoomed)
- 16 ms binning (zoomed)
- 8 ms binning (zoomed)
- 2 ms binning (zoomed)
- SN=5 or 10 s binning (full-time range)
- Raw light curve
Spectra
- 64 ms binning (zoomed)
- 16 ms binning (zoomed)
- 8 ms binning (zoomed)
- 2 ms binning (zoomed)
- SN=5 or 10 s binning (full-time range)
- Raw light curve
Spectra
Notes:
- 1) The fitting includes the systematic errors.
- 2) When the burst includes telescope slew time periods, the fitting uses an average response file made from multiple 5-s response files through out the slew time plus single time preiod for the non-slew times, and weighted by the total counts in the corresponding time period using addrmf. An average response file is needed becuase a spectral fit using the pre-slew DRM will introduce some errors in both a spectral shape and a normalization if the PHA file contains a lot of the slew/post-slew time interval.
- 3) For fits to more complicated models (e.g. a power-law over a cutoff power-law), the BAT team has decided to require a chi-square improvement of more than 6 for each extra dof.
Time averaged spectrum fit using the average DRM
Power-law model
Time interval is from    0.004 sec. to  221.276 sec.

Spectral model in power-law:
------------------------------------------------------------
Parameters  : value       lower 90%   higher 90%
Photon index: -1.34262     ( -0.245201   0.246067 )
Norm@50keV  : 7.06008E-04    ( -0.000103213   0.000103015 )
------------------------------------------------------------
#Fit statistic  : Chi-Squared                   53.62     using 59 bins.
 Reduced chi-squared = 0.940702
# Null hypothesis probability of 6.03e-01 with 57 degrees of freedom

Photon flux (15-150 keV)    in 221.3 sec: 8.49268E-02 ( -0.0125936  0.0126226 ) ph/cm2/s
Energy fluence (15-150 keV)             : 1.5287e-06 ( -2.46125e-07  2.49016e-07 ) ergs/cm2
Cutoff power-law model
Time interval is from    0.004 sec. to  221.276 sec.
Spectral model in the cutoff power-law:
------------------------------------------------------------
Parameters  : value       lower 90%   higher 90%
Photon index: -0.408765     ( -1.0229   1.43447 )
Epeak [keV] : 88.2914      ( -25.247 -88.2909 )
Norm@50keV  : 2.01474E-03    ( -0.00201477   0.00731223 )
------------------------------------------------------------
#Fit statistic  : Chi-Squared                   51.49     using 59 bins.
 Reduced chi-squared = 0.919464
# Null hypothesis probability of 6.46e-01 with 56 degrees of freedom

Photon flux (15-150 keV)    in 221.3 sec: 8.15866E-02 ( -0.0133879  0.0132805 ) ph/cm2/s
Energy fluence (15-150 keV)             : 1.43698e-06 ( -2.66697e-07  2.72133e-07 ) ergs/cm2
1-s peak spectrum fit
Power-law model
Time interval is from    2.700 sec. to    3.700 sec.

Spectral model in power-law:
------------------------------------------------------------
Parameters  : value       lower 90%   higher 90%
Photon index: -1.46209     ( -0.338506   0.328875 )
Norm@50keV  : 1.22886E-02    ( -0.00264768   0.00262325 )
------------------------------------------------------------
#Fit statistic  : Chi-Squared                   53.23     using 59 bins.
 Reduced chi-squared = 0.93386
# Null hypothesis probability of 6.17e-01 with 57 degrees of freedom

Photon flux (15-150 keV)    in 1 sec: 1.51903 ( -0.32122  0.32164 ) ph/cm2/s
Energy fluence (15-150 keV)             : 1.17352e-07 ( -2.72717e-08  2.75919e-08 ) ergs/cm2
Cutoff power-law model
Time interval is from    2.700 sec. to    3.700 sec.
Spectral model in the cutoff power-law:
------------------------------------------------------------
Parameters  : value       lower 90%   higher 90%
Photon index: -0.739921     ( -0.982628   1.61413 )
Epeak [keV] : 88.2207      ( -35.9963 -88.2209 )
Norm@50keV  : 2.87173E-02    ( -0.0287171   0.162949 )
------------------------------------------------------------
#Fit statistic  : Chi-Squared                   52.18     using 59 bins.
 Reduced chi-squared = 0.931786
# Null hypothesis probability of 6.20e-01 with 56 degrees of freedom

Photon flux (15-150 keV)    in 1 sec: 1.49873 ( -0.32349  0.32371 ) ph/cm2/s
Energy fluence (15-150 keV)             : 1.13616e-07 ( -2.86686e-08  2.87152e-08 ) ergs/cm2
Time-resolved spectra
Distribution
T90 vs. Hardness ratio plot
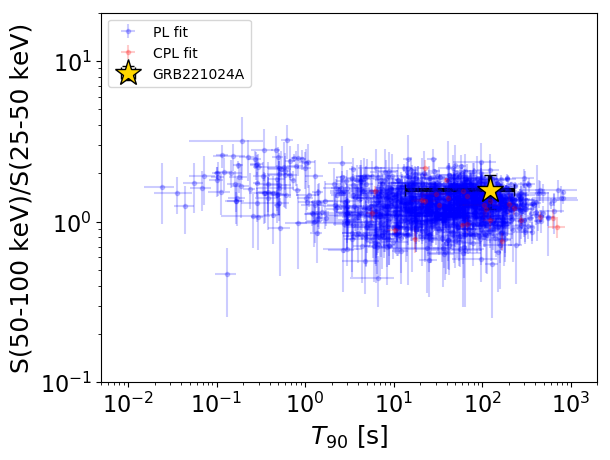
T90                                   = 122.176 sec.
Hardness ratio (energy fluence ratio) = 1.57724804001
S(15-50 keV) vs. S(50-150 keV) plot
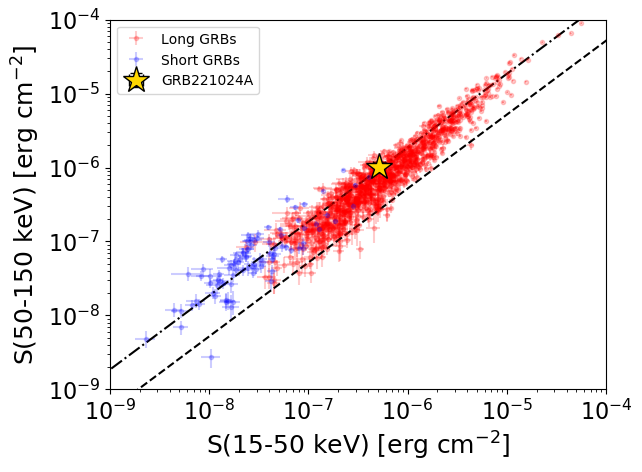
S(15-50 keV)  = 5.205701e-07
S(50-150 keV) = 1.0081124e-06
The dash-dotted line and the dashed line traces the fluences calculated from the Band function with Epeak = 15 and 150 keV, respectively. Both lines assume a canonical values of alpha = -1 and beta = -2.5.
Mask shadow pattern
IMX = -4.287429109351291E-01, IMY = 5.361960943195506E-01
Spacecraft aspect plot
Bright source in the pre-burst/pre-slew/post-slew images
Pre-burst image of 15-350 keV band
Time interval of the image:
-239.216000 0.004000

# RAcent  DECcent POSerr Theta    Phi  PeakCts   SNR AngSep     Name
#  [deg]    [deg]    ['] [deg]  [deg]                   [']
146.9700  39.8205    2.2  22.7 -162.0   2.8094   5.3 ------	UNKNOWN
Pre-slew background subtracted image of 15-350 keV band
Time interval of the image:
0.004000 34.284600

# RAcent  DECcent POSerr Theta    Phi  PeakCts   SNR AngSep     Name
#  [deg]    [deg]    ['] [deg]  [deg]                   [']
 97.1478  -3.6116    2.6  43.0   51.4   0.9496   4.4 ------	UNKNOWN
114.8044 -27.0768    2.6  50.7   12.8   0.8185   4.4 ------	UNKNOWN
191.7987  63.1926    2.1  57.9 -162.3   2.5133   5.6 ------	UNKNOWN
169.7030  33.0776    1.7  34.5 -128.6   0.9105   6.6 ------	UNKNOWN
Post-slew image of 15-350 keV band
Time interval of the image:
112.084600 962.818100

# RAcent  DECcent POSerr Theta    Phi  PeakCts   SNR AngSep     Name
#  [deg]    [deg]    ['] [deg]  [deg]                   [']
140.4381  68.5643    2.4  39.2  120.4  28.6656   4.8 ------	UNKNOWN
222.9563  72.5871    2.7  47.9  155.7  30.7810   4.3 ------	UNKNOWN
163.4846  45.4527    3.2  13.3  117.6   7.0279   3.6 ------	UNKNOWN