Analysis Summary
Notes:
- 1) No attempt has been made to eliminate the non-significant decimal places.
- 2) This batgrbproduct analysis is done using the HEASARC data.
- 3) This batgrbproduct analysis is using the flight position for the mask-weighting calculation.
======================================================================
                  BAT GRB EVENT DATA PROCESSING REPORT
    Process Script Ver: batgrbproduct v2.48
    Process Start Time: Wed Jun 14 12:15:58 EDT 2023
             Host Name: batproc1
   Current Working Dir: /local/data/bat1/alien/Swift_3rdBATcatalog/event/batevent_reproc/trigger1131397
======================================================================

  Trigger: 01131397      Segment: 000

  BAT Trigger Time: 688590848.896   [s; MET]
      Trigger Stop: 688590849.92   [s; MET]
               UTC: 2022-10-27T19:13:38.784400    [includes UTCF correction]
       Where From?: TDRSS position message

  BAT
    RA: 225.602970286955   Dec: 47.4481624691975  [deg; J2000]

     Catalogged Source?: NO
     Point Source?:      YES
     GRB Indicated?:     YES    [ by BAT flight software ]
     Image S/N Ratio:    14.69
     Image Trigger?:     NO
     Rate S/N Ratio:     22.2710574513201  [ if not an image trigger ]
     Image S/N Ratio:    14.69

  Analysis Position:   [ source = BAT ]
    RA: 225.602970286955   Dec: 47.4481624691975  [deg; J2000]

  Refined Position:   [ source = BAT pre-slew burst ]
    RA: 225.600737176053   Dec: 47.4525858854227  [deg; J2000]
        { 15h 02m 24.2s , +47d 27' 09.3" }
         +/- 1.6146741935712 [arcmin] (estimated 90% radius based on SNR)
         +/- 0.602663596532404 [arcmin] (formal 1-sigma fit error)
    SNR: 15.3410198212875

  Angular difference between the analysis and refined position is 0.280445 arcmin

  Partial Coding Fraction: 0.4570312    [ including projection effects ]

  Duration
     T90: 8.84800004959106 +/- 1.53633333421838
        Measured from: -5.31200003623962
                   to: 3.53600001335144     [s; relative to TRIGTIME]
     T50: 1.7279999256134 +/- 2.51031801570599
        Measured from: -0.575999975204468
                   to: 1.15199995040894     [s; relative to TRIGTIME]


  Fluence
     Peak Flux  (peak 1 second)
        Measured from: -0.108000040054321
                   to: 0.891999959945679     [s; relative to TRIGTIME]
     Total Fluence
        Measured from: -6.5440000295639
                   to: 4.19200003147125     [s; relative to TRIGTIME]

             Band 1     Band 2     Band 3     Band 4
              15-25      25-50     50-100    100-350     keV
 Total     0.422160   0.477524   0.148096   0.021677
           0.037005   0.037516   0.031298   0.026756 [error]
 Peak      0.131527   0.170281   0.055992   0.009433
           0.013351   0.014454   0.011422   0.008143 [error]

     [ fluence units of on-axis counts / fully illuminated detector ]

======================================================================


====== Table of the duration information =============================

        Value   tstart    tstop
T100   10.736   -6.544    4.192
T90     8.848   -5.312    3.536
T50     1.728   -0.576    1.152
Peak    1.000   -0.108    0.892


====== Spectral Analysis Summary =====================================

Model      : spectral model: simple power-law (PL) and cutoff power-law (CPL)
Ph_index   : photon index: E^{Ph_index}
Ph_90err   : 90% error of the photon index
Epeak      : Epeak in keV
Epeak_90err: 90% error of Epeak
Norm       : normalization at 50 keV in both the PL model and CPL model
Nomr_90err : 90% error of the normalization
chi2       : Chi-Squared
dof        : degree of freedo

=== Time-averaged spectral analysis ===
(Best model with acceptable fit: PL)

Model Ph_index Ph_90err_low Ph_90err_hi  Epeak  Epeak_90err_low  Epeak_90err_hi  Norm       Nomr_90err_low    Norm_90err_hi    chi2    dof
PL      -2.365    -0.204      0.191       -           -               -         5.52e-03     -7.92e-04          7.78e-04      67.350   57
CPL     -1.137    -0.860      1.890       25.125     -24.113         7.513      3.29e-02     -3.29e-02          5.65e-01      63.820   56


=== 1-s peak spectral analysis ===
(Best model with acceptable fit: PL)

Model Ph_index Ph_90err_low Ph_90err_hi  Epeak  Epeak_90err_low  Epeak_90err_hi  Norm       Nomr_90err_low    Norm_90err_hi    chi2    dof
PL      -2.173     -0.186     0.175       -           -               -         2.11e-02     -2.90e-03          2.85e-03      69.450   57
CPL     -0.071     -1.084     1.462       34.667      -5.515         5.288      4.13e-01     -4.13e-01          3.22e+00      55.950   56


=== Fluence/Peak Flux Summary ===

              Model    Band1     Band2     Band3     Band4     Band5     Total
                       15-25     25-50    50-100    100-350    15-150    15-350    keV
Fluence         PL   1.72e-07  1.87e-07  1.45e-07  1.86e-07  5.74e-07  6.90e-07   erg/cm2
      90%_error_low -2.20e-08 -1.94e-08 -2.77e-08 -6.00e-08 -6.56e-08 -1.00e-07   erg/cm2
      90%_error_hi   2.24e-08  1.92e-08  2.88e-08  7.67e-08  6.69e-08  1.12e-07   erg/cm2
Peak flux       PL   1.66e+00  1.13e+00  4.99e-01  3.06e-01  3.44e+00  3.59e+00   ph/cm2/s
      90%_error_low -2.31e-01 -1.22e-01 -8.65e-02 -8.74e-02 -3.70e-01 -3.86e-01   ph/cm2/s
      90%_error_hi   2.36e-01  1.22e-01  8.80e-02  1.05e-01  3.70e-01  3.87e-01   ph/cm2/s

Fluence        CPL    N/A      N/A      N/A      N/A      N/A      N/A      erg/cm2
      90%_error_low -2.20e-08 -1.94e-08 -2.77e-08 -6.00e-08 -6.56e-08 -1.00e-07   erg/cm2
      90%_error_hi   2.24e-08  1.92e-08  2.88e-08  7.67e-08  6.69e-08  1.12e-07   erg/cm2
Peak flux      CPL   1.47e+00  1.43e+00  4.23e-01  2.64e-02  3.35e+00  3.35e+00   ph/cm2/s
      90%_error_low -2.59e-01 -1.90e-01 -1.41e-01 -2.64e-02 -3.69e-01 -3.70e-01   ph/cm2/s
      90%_error_hi   2.61e-01  1.96e-01  1.28e-01  6.55e-02  3.71e-01  3.72e-01   ph/cm2/s

======================================================================
Image
Pre-slew 15.0-350.0 keV image (Event data)

#   RAcent    DECcent   POSerr    Theta     Phi              Peak Cts       SNR   Name
  225.6007    47.4526   0.0125    42.6614   177.4083         1.0924919     15.341 TRIG_01131397

Foreground time interval of the image:
 -6.544   4.192 (delta_t =  10.736 [sec])
Background time interval of the image:
-239.896  -6.544 (delta_t = 233.352 [sec])
Light Curves
Note: The mask-weighted lightcurves have units of either count/det or counts/sec/det, where a det is 0.4 x 0.4 = 0.16 sq cm.
Full-time range; 1 s binning
Other quick-look light curves:
- 64 ms binning (zoomed)
- 16 ms binning (zoomed)
- 8 ms binning (zoomed)
- 2 ms binning (zoomed)
- SN=5 or 10 s binning (full-time range)
- Raw light curve
Spectra
- 64 ms binning (zoomed)
- 16 ms binning (zoomed)
- 8 ms binning (zoomed)
- 2 ms binning (zoomed)
- SN=5 or 10 s binning (full-time range)
- Raw light curve
Spectra
Notes:
- 1) The fitting includes the systematic errors.
- 2) When the burst includes telescope slew time periods, the fitting uses an average response file made from multiple 5-s response files through out the slew time plus single time preiod for the non-slew times, and weighted by the total counts in the corresponding time period using addrmf. An average response file is needed becuase a spectral fit using the pre-slew DRM will introduce some errors in both a spectral shape and a normalization if the PHA file contains a lot of the slew/post-slew time interval.
- 3) For fits to more complicated models (e.g. a power-law over a cutoff power-law), the BAT team has decided to require a chi-square improvement of more than 6 for each extra dof.
Time averaged spectrum fit using the average DRM
Power-law model

Time interval is from   -6.544 sec. to    4.192 sec.

Spectral model in power-law:
------------------------------------------------------------
Parameters  : value       lower 90%   higher 90%
Photon index: -2.36473     ( -0.204468   0.190677 )
Norm@50keV  : 5.52053E-03    ( -0.000791552   0.000777669 )
------------------------------------------------------------
#Fit statistic  : Chi-Squared                   67.35     using 59 bins.
 Reduced chi-squared = 1.18158
# Null hypothesis probability of 1.64e-01 with 57 degrees of freedom

Photon flux (15-150 keV)    in 10.74 sec: 1.00087 ( -0.098182  0.09822 ) ph/cm2/s
Energy fluence (15-150 keV)             : 5.74029e-07 ( -6.56309e-08  6.68913e-08 ) ergs/cm2
Cutoff power-law model

Time interval is from   -6.544 sec. to    4.192 sec.
Spectral model in the cutoff power-law:
------------------------------------------------------------
Parameters  : value       lower 90%   higher 90%
Photon index: -1.13679     ( -0.86577   1.88387 )
Epeak [keV] : 25.1245      ( -24.1824 7.44396 )
Norm@50keV  : 3.28811E-02    ( -0.0335534   0.564364 )
------------------------------------------------------------
#Fit statistic  : Chi-Squared                   63.82     using 59 bins.
 Reduced chi-squared = 1.13964
# Null hypothesis probability of 2.21e-01 with 56 degrees of freedom

Photon flux (15-150 keV)    in 10.74 sec: 0.963126 ( -0.105214  0.104544 ) ph/cm2/s
Energy fluence (15-150 keV)             : 0 ( 0  0 ) ergs/cm2
1-s peak spectrum fit
Power-law model

Time interval is from   -0.108 sec. to    0.892 sec.

Spectral model in power-law:
------------------------------------------------------------
Parameters  : value       lower 90%   higher 90%
Photon index: -2.17302     ( -0.186274   0.175524 )
Norm@50keV  : 2.10520E-02    ( -0.00289856   0.00285131 )
------------------------------------------------------------
#Fit statistic  : Chi-Squared                   69.45     using 59 bins.
 Reduced chi-squared = 1.21842
# Null hypothesis probability of 1.25e-01 with 57 degrees of freedom

Photon flux (15-150 keV)    in 1 sec: 3.43690 ( -0.37017  0.37024 ) ph/cm2/s
Energy fluence (15-150 keV)             : 1.97247e-07 ( -2.41976e-08  2.45063e-08 ) ergs/cm2
Cutoff power-law model

Time interval is from   -0.108 sec. to    0.892 sec.
Spectral model in the cutoff power-law:
------------------------------------------------------------
Parameters  : value       lower 90%   higher 90%
Photon index: -0.0711754     ( -1.08917   1.45728 )
Epeak [keV] : 34.6668      ( -5.4818 5.32156 )
Norm@50keV  : 0.412678    ( -0.420179   3.20779 )
------------------------------------------------------------
#Fit statistic  : Chi-Squared                   55.95     using 59 bins.
 Reduced chi-squared = 0.999107
# Null hypothesis probability of 4.77e-01 with 56 degrees of freedom

Photon flux (15-150 keV)    in 1 sec: 3.34958 ( -0.36944  0.37055 ) ph/cm2/s
Energy fluence (15-150 keV)             : 0 ( 0  0 ) ergs/cm2
Time-resolved spectra

Distribution
T90 vs. Hardness ratio plot
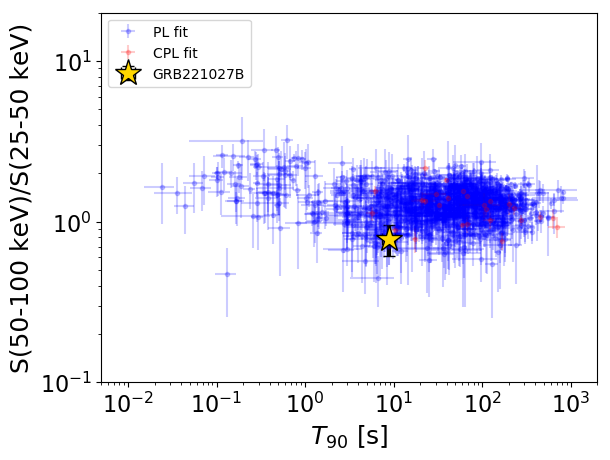
T90                                   = 8.848 sec.
Hardness ratio (energy fluence ratio) = 0.776658437567
S(15-50 keV) vs. S(50-150 keV) plot

S(15-50 keV)  = 3.590439e-07
S(50-150 keV) = 2.1499263e-07
The dash-dotted line and the dashed line traces the fluences calculated from the Band function with Epeak = 15 and 150 keV, respectively. Both lines assume a canonical values of alpha = -1 and beta = -2.5.
Mask shadow pattern

IMX = -9.205829732229645E-01, IMY = -4.167005463225783E-02
Spacecraft aspect plot

Bright source in the pre-burst/pre-slew/post-slew images
Pre-burst image of 15-350 keV band
Time interval of the image:
-239.896000 -6.544000

# RAcent  DECcent POSerr Theta    Phi  PeakCts   SNR AngSep     Name
#  [deg]    [deg]    ['] [deg]  [deg]                   [']
156.9907  42.6781    4.6  27.2   92.3   2.1664   2.6 ------	UNKNOWN
166.2179  28.7559    3.5  13.8   66.6   2.0178   3.3 ------	UNKNOWN
177.6817 -15.9416    2.1  39.9  -42.9   5.8973   5.4 ------	UNKNOWN
Pre-slew background subtracted image of 15-350 keV band
Time interval of the image:
-6.544000 4.192000

# RAcent  DECcent POSerr Theta    Phi  PeakCts   SNR AngSep     Name
#  [deg]    [deg]    ['] [deg]  [deg]                   [']
225.6007  47.4526    0.7  42.7  177.4   1.0926  15.3 ------	UNKNOWN
Post-slew image of 15-350 keV band
Time interval of the image:
108.604600 962.235100

# RAcent  DECcent POSerr Theta    Phi  PeakCts   SNR AngSep     Name
#  [deg]    [deg]    ['] [deg]  [deg]                   [']
254.3998  35.5384    0.0  24.5 -176.1   1.5570   0.7   12.1	Her X-1
256.1016  11.6805    2.8  44.0 -150.5  19.8647   4.1 ------	UNKNOWN