Analysis Summary
Notes:
- 1) No attempt has been made to eliminate the non-significant decimal places.
- 2) This batgrbproduct analysis is done using the HEASARC data.
- 3) This batgrbproduct analysis is using the flight position for the mask-weighting calculation.
======================================================================
                  BAT GRB EVENT DATA PROCESSING REPORT
    Process Script Ver: batgrbproduct v2.48
    Process Start Time: Wed Jun 14 12:14:37 EDT 2023
             Host Name: batproc1
   Current Working Dir: /local/data/bat1/alien/Swift_3rdBATcatalog/event/batevent_reproc/trigger1131910
======================================================================

  Trigger: 01131910      Segment: 000

  BAT Trigger Time: 688655817.792   [s; MET]
      Trigger Stop: 688655818.816   [s; MET]
               UTC: 2022-10-28T13:16:27.675980    [includes UTCF correction]
       Where From?: TDRSS position message

  BAT
    RA: 314.205809453804   Dec: 41.0656228856362  [deg; J2000]

     Catalogged Source?: NO
     Point Source?:      YES
     GRB Indicated?:     YES    [ by BAT flight software ]
     Image S/N Ratio:    7.77
     Image Trigger?:     NO
     Rate S/N Ratio:     36.783148315499  [ if not an image trigger ]
     Image S/N Ratio:    7.77

  Analysis Position:   [ source = BAT ]
    RA: 314.205809453804   Dec: 41.0656228856362  [deg; J2000]

  Refined Position:   [ source = BAT pre-slew burst ]
    RA: 314.197840780544   Dec: 41.0822047741597  [deg; J2000]
        { 20h 56m 47.5s , +41d 04' 55.9" }
         +/- 1.55057035365598 [arcmin] (estimated 90% radius based on SNR)
         +/- 0.587144864678102 [arcmin] (formal 1-sigma fit error)
    SNR: 16.2550271703813

  Angular difference between the analysis and refined position is 1.058191 arcmin

  Partial Coding Fraction: 0.5390625    [ including projection effects ]

  Duration
     T90: 68.3240000009537 +/- 14.8808113864809
        Measured from: 0.6839998960495
                   to: 69.0079998970032     [s; relative to TRIGTIME]
     T50: 22.7279999256134 +/- 11.9450153770926
        Measured from: 8.17199993133545
                   to: 30.8999998569489     [s; relative to TRIGTIME]


  Fluence
     Peak Flux  (peak 1 second)
        Measured from: 0.555999994277954
                   to: 1.55599999427795     [s; relative to TRIGTIME]
     Total Fluence
        Measured from: -0.0840001106262207
                   to: 84.0319999456406     [s; relative to TRIGTIME]

             Band 1     Band 2     Band 3     Band 4
              15-25      25-50     50-100    100-350     keV
 Total    -0.001641   0.199369   1.076546   0.388726
           0.003270   0.025409   0.058048   0.049375 [error]
 Peak      0.000136   0.014983   0.074231   0.033223
           0.000380   0.003964   0.009616   0.008942 [error]

     [ fluence units of on-axis counts / fully illuminated detector ]

======================================================================


====== Table of the duration information =============================

        Value   tstart    tstop
T100   84.116   -0.084   84.032
T90    68.324    0.684   69.008
T50    22.728    8.172   30.900
Peak    1.000    0.556    1.556


====== Spectral Analysis Summary =====================================

Model      : spectral model: simple power-law (PL) and cutoff power-law (CPL)
Ph_index   : photon index: E^{Ph_index}
Ph_90err   : 90% error of the photon index
Epeak      : Epeak in keV
Epeak_90err: 90% error of Epeak
Norm       : normalization at 50 keV in both the PL model and CPL model
Nomr_90err : 90% error of the normalization
chi2       : Chi-Squared
dof        : degree of freedo

=== Time-averaged spectral analysis ===
(Best model with acceptable fit: N/A)

Model Ph_index Ph_90err_low Ph_90err_hi  Epeak  Epeak_90err_low  Epeak_90err_hi  Norm       Nomr_90err_low    Norm_90err_hi    chi2    dof
PL      N/A        N/A       N/A          -           -               -           N/A           N/A               N/A         N/A        N/A
CPL     N/A        N/A        N/A          N/A         N/A           N/A           N/A           N/A               N/A         N/A        N/A


=== 1-s peak spectral analysis ===
(Best model with acceptable fit: N/A)

Model Ph_index Ph_90err_low Ph_90err_hi  Epeak  Epeak_90err_low  Epeak_90err_hi  Norm       Nomr_90err_low    Norm_90err_hi    chi2    dof
PL      N/A         N/A       N/A          -           -               -           N/A           N/A               N/A         N/A        N/A
CPL     N/A         N/A       N/A          N/A         N/A           N/A           N/A           N/A               N/A         N/A        N/A


=== Fluence/Peak Flux Summary ===

              Model    Band1     Band2     Band3     Band4     Band5     Total
                       15-25     25-50    50-100    100-350    15-150    15-350    keV
Fluence         PL    N/A      N/A      N/A      N/A      N/A      N/A      erg/cm2
Image
Pre-slew 15.0-350.0 keV image (Event data)
#   RAcent    DECcent   POSerr    Theta     Phi              Peak Cts       SNR   Name
  314.1978    41.0822   0.0118    30.6499    55.9527         0.7858426     16.255 TRIG_01131910

Foreground time interval of the image:
 -0.084  16.709 (delta_t =  16.793 [sec])
Background time interval of the image:
-239.792  -0.084 (delta_t = 239.708 [sec])
Light Curves
Note: The mask-weighted lightcurves have units of either count/det or counts/sec/det, where a det is 0.4 x 0.4 = 0.16 sq cm.
Full-time range; 1 s binning
Other quick-look light curves:
- 64 ms binning (zoomed)
- 16 ms binning (zoomed)
- 8 ms binning (zoomed)
- 2 ms binning (zoomed)
- SN=5 or 10 s binning (full-time range)
- Raw light curve
Spectra
- 64 ms binning (zoomed)
- 16 ms binning (zoomed)
- 8 ms binning (zoomed)
- 2 ms binning (zoomed)
- SN=5 or 10 s binning (full-time range)
- Raw light curve
Spectra
Notes:
- 1) The fitting includes the systematic errors.
- 2) When the burst includes telescope slew time periods, the fitting uses an average response file made from multiple 5-s response files through out the slew time plus single time preiod for the non-slew times, and weighted by the total counts in the corresponding time period using addrmf. An average response file is needed becuase a spectral fit using the pre-slew DRM will introduce some errors in both a spectral shape and a normalization if the PHA file contains a lot of the slew/post-slew time interval.
- 3) For fits to more complicated models (e.g. a power-law over a cutoff power-law), the BAT team has decided to require a chi-square improvement of more than 6 for each extra dof.
Time averaged spectrum fit using the average DRM
Power-law model

Multiple GTIs in the spectrum
tstart tstop
Photon index:       (       )
Cutoff power-law model

Multiple GTIs in the spectrum
tstart tstop
Photon index:       (       )
1-s peak spectrum fit
Power-law model

Time interval is from    0.556 sec. to    1.556 sec.
Photon index:       (       )
Cutoff power-law model

Time interval is from    0.556 sec. to    1.556 sec.
Photon index:       (       )
Time-resolved spectra

Distribution
T90 vs. Hardness ratio plot
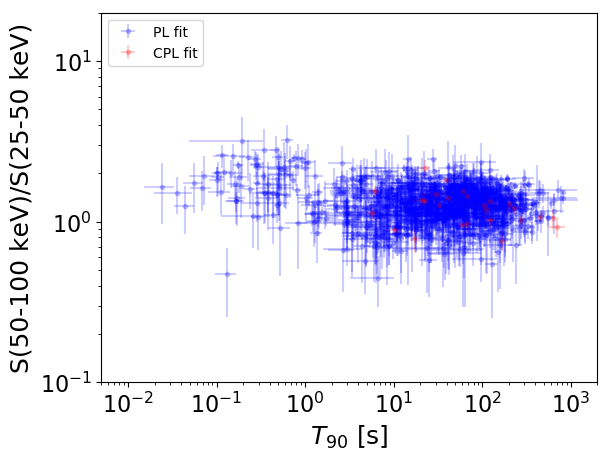
T90                                   = N/A sec.
Hardness ratio (energy fluence ratio) = N/A
S(15-50 keV) vs. S(50-150 keV) plot
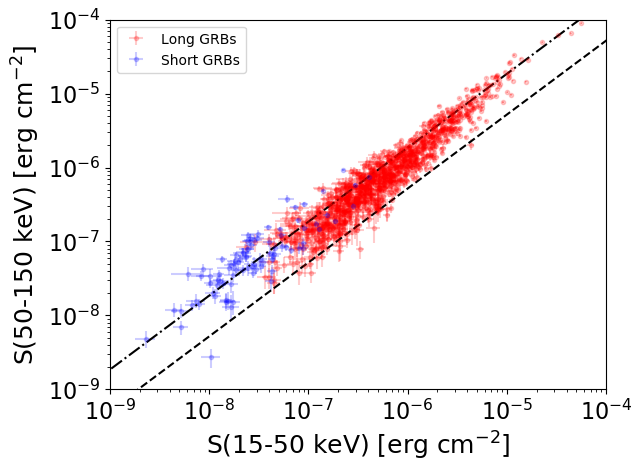
S(15-50 keV)  = N/A
S(50-150 keV) = N/A
The dash-dotted line and the dashed line traces the fluences calculated from the Band function with Epeak = 15 and 150 keV, respectively. Both lines assume a canonical values of alpha = -1 and beta = -2.5.
Mask shadow pattern
IMX = 3.317690689505900E-01, IMY = -4.909926022119773E-01
Spacecraft aspect plot
Bright source in the pre-burst/pre-slew/post-slew images
Pre-burst image of 15-350 keV band
Time interval of the image:
-239.792000 -0.084000

# RAcent  DECcent POSerr Theta    Phi  PeakCts   SNR AngSep     Name
#  [deg]    [deg]    ['] [deg]  [deg]                   [']
254.3247  35.2558   52.5  33.6  -39.8   0.0588   0.2    8.3	Her X-1
268.4579  -1.2861    0.0  28.7 -119.4  -0.4371  -1.6   11.4	SW J1753.5-0127
270.2930 -25.0788  119.5  48.2 -142.3  -0.0439  -0.1    0.5	GX 5-1
270.3022 -25.7426   22.1  48.8 -142.7   0.2478   0.5    0.0	GRS 1758-258
274.0804 -13.8843 2700.0  36.5 -140.8   0.0004   0.0   10.1	GX 17+2
276.0468 -30.3319   10.3  51.5 -150.9  -0.5012  -1.1    6.7	H1820-303
285.0978 -24.7626    0.0  44.7 -160.3  -0.3185  -1.0   10.1	HT1900.1-2455
288.7978  10.9477  124.8   8.9 -167.8  -0.0152  -0.1    0.1	GRS 1915+105
299.6268  35.2199    1.2  18.4   46.3   1.6549   9.4    2.1	Cyg X-1
308.3015  40.9561    4.9  27.2   50.2   0.4832   2.4    8.7	Cyg X-3
326.1552  38.2716    3.9  37.6   67.9   1.1780   2.9    3.1	Cyg X-2
328.2816  29.3423    3.0  37.4   82.9   1.7587   3.8 ------	UNKNOWN
315.5224 -24.7450    2.8  51.8  163.7   3.3870   4.1 ------	UNKNOWN
Pre-slew background subtracted image of 15-350 keV band
Time interval of the image:
-0.084000 16.708600

# RAcent  DECcent POSerr Theta    Phi  PeakCts   SNR AngSep     Name
#  [deg]    [deg]    ['] [deg]  [deg]                   [']
254.5690  35.4644   12.5  33.5  -39.3   0.0442   0.9    9.1	Her X-1
268.4058  -1.3022  656.3  28.7 -119.4   0.0008   0.0    9.3	SW J1753.5-0127
270.1135 -24.9803    3.4  48.1 -142.1  -0.3137  -3.4   11.0	GX 5-1
270.2659 -25.6695    5.6  48.7 -142.6  -0.1986  -2.0    4.8	GRS 1758-258
273.8510 -14.0222    4.7  36.7 -140.5   0.1330   2.5    9.1	GX 17+2
275.9601 -30.3678    7.3  51.5 -150.8  -0.1389  -1.6    1.8	H1820-303
285.1402 -24.9388   12.4  44.8 -160.3  -0.0563  -0.9    5.8	HT1900.1-2455
288.9615  10.9233    5.1   8.9 -168.8  -0.0762  -2.2    9.7	GRS 1915+105
299.4455  35.2997    4.3  18.4   45.8  -0.0943  -2.7    9.2	Cyg X-1
308.1375  40.8418    7.1  27.0   50.1   0.0673   1.6    6.8	Cyg X-3
326.1810  38.4457    5.7  37.6   67.7  -0.1686  -2.0    7.5	Cyg X-2
314.1979  41.0822    0.7  30.6   56.0   0.7858  16.3 ------	UNKNOWN
280.3473  67.4211    2.3  47.9   11.6   0.3625   5.2 ------	UNKNOWN
305.4127 -33.5640    1.8  55.8  178.4   1.2843   6.2 ------	UNKNOWN
Post-slew image of 15-350 keV band
Time interval of the image:
84.108600 962.308000

# RAcent  DECcent POSerr Theta    Phi  PeakCts   SNR AngSep     Name
#  [deg]    [deg]    ['] [deg]  [deg]                   [']
288.7521  11.0750    5.5  37.4 -133.1  -1.9009  -2.1    8.2	GRS 1915+105
299.5698  35.2367    1.4  12.9 -109.3   4.5454   8.1    2.3	Cyg X-1
307.9177  40.9067   15.1   4.7  -87.0   0.4315   0.8    9.2	Cyg X-3
326.0315  38.2938    8.3   9.5  106.0   0.7009   1.4    6.8	Cyg X-2
265.3563  58.4029    2.7  34.9  -40.5   3.5086   4.3 ------	UNKNOWN
256.0793  51.5429    2.3  40.3  -51.7   6.0202   5.1 ------	UNKNOWN