Analysis Summary
Notes:
- 1) No attempt has been made to eliminate the non-significant decimal places.
- 2) This batgrbproduct analysis is done using the HEASARC data.
- 3) This batgrbproduct analysis is using the flight position for the mask-weighting calculation.
======================================================================
BAT GRB EVENT DATA PROCESSING REPORT
Process Script Ver: batgrbproduct v2.48
Process Start Time: Fri Oct 13 23:04:59 EDT 2023
Host Name: batproc1
Current Working Dir: /local/data/bat1/alien/Swift_3rdBATcatalog/event/batevent_reproc/trigger1136936
======================================================================
Trigger: 01136936 Segment: 000
BAT Trigger Time: 689740127.744 [s; MET]
Trigger Stop: 689740128.768 [s; MET]
UTC: 2022-11-10T02:28:17.554360 [includes UTCF correction]
Where From?: TDRSS position message
BAT
RA: 29.119436251407 Dec: -27.3142945105164 [deg; J2000]
Catalogged Source?: NO
Point Source?: YES
GRB Indicated?: YES [ by BAT flight software ]
Image S/N Ratio: 8.01
Image Trigger?: NO
Rate S/N Ratio: 13.3790881602597 [ if not an image trigger ]
Image S/N Ratio: 8.01
Analysis Position: [ source = BAT ]
RA: 29.119436251407 Dec: -27.3142945105164 [deg; J2000]
Refined Position: [ source = BAT pre-slew burst ]
RA: 29.1062888163036 Dec: -27.2978740488483 [deg; J2000]
{ 01h 56m 25.5s , -27d 17' 52.3" }
+/- 1.49055158073503 [arcmin] (estimated 90% radius based on SNR)
+/- 0.58223831507813 [arcmin] (formal 1-sigma fit error)
SNR: 17.1980732777021
Angular difference between the analysis and refined position is 1.209130 arcmin
Partial Coding Fraction: 0.7578125 [ including projection effects ]
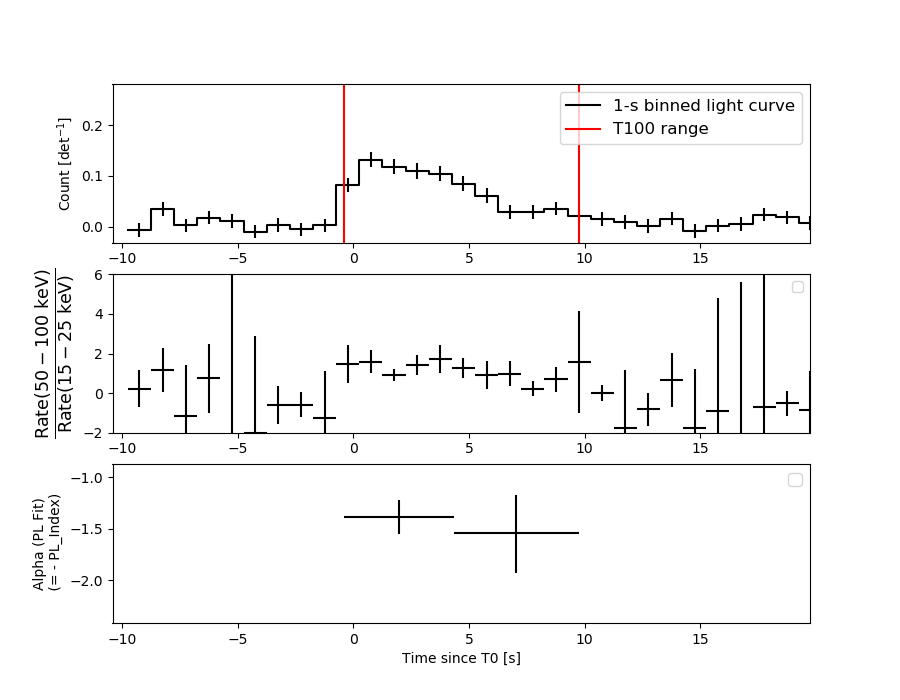
Duration
T90: 8.9799998998642 +/- 2.10693811743884
Measured from: 0.0680000782012939
to: 9.04799997806549 [s; relative to TRIGTIME]
T50: 3.83999991416931 +/- 0.763319060963741
Measured from: 1.26400005817413
to: 5.10399997234344 [s; relative to TRIGTIME]
Fluence
Peak Flux (peak 1 second)
Measured from: 0.516000032424927
to: 1.51600003242493 [s; relative to TRIGTIME]
Total Fluence
Measured from: -0.407999992370605
to: 9.73600006103516 [s; relative to TRIGTIME]
Band 1 Band 2 Band 3 Band 4
15-25 25-50 50-100 100-350 keV
Total 0.219329 0.303421 0.236461 0.038376
0.024125 0.025741 0.023010 0.018689 [error]
Peak 0.036697 0.061989 0.043458 -0.000344
0.007906 0.008469 0.007786 0.005960 [error]
[ fluence units of on-axis counts / fully illuminated detector ]
======================================================================
====== Table of the duration information =============================
Value tstart tstop
T100 10.144 -0.408 9.736
T90 8.980 0.068 9.048
T50 3.840 1.264 5.104
Peak 1.000 0.516 1.516
====== Spectral Analysis Summary =====================================
Model : spectral model: simple power-law (PL) and cutoff power-law (CPL)
Ph_index : photon index: E^{Ph_index}
Ph_90err : 90% error of the photon index
Epeak : Epeak in keV
Epeak_90err: 90% error of Epeak
Norm : normalization at 50 keV in both the PL model and CPL model
Nomr_90err : 90% error of the normalization
chi2 : Chi-Squared
dof : degree of freedo
=== Time-averaged spectral analysis ===
(Best model with acceptable fit: PL)
Model Ph_index Ph_90err_low Ph_90err_hi Epeak Epeak_90err_low Epeak_90err_hi Norm Nomr_90err_low Norm_90err_hi chi2 dof
PL -1.415 -0.163 0.162 - - - 5.24e-03 -4.93e-04 4.90e-04 45.990 57
CPL -1.276 -0.412 0.700 261.800 -261.800 -261.800 6.16e-03 -2.13e-03 7.51e-03 45.850 56
=== 1-s peak spectral analysis ===
(Best model with acceptable fit: PL)
Model Ph_index Ph_90err_low Ph_90err_hi Epeak Epeak_90err_low Epeak_90err_hi Norm Nomr_90err_low Norm_90err_hi chi2 dof
PL -1.571 -0.279 0.267 - - - 8.89e-03 -1.66e-03 1.63e-03 59.290 57
CPL 0.241 -1.448 2.116 55.005 -11.369 45.864 8.85e-02 -8.85e-02 1.11e+00 54.500 56
=== Fluence/Peak Flux Summary ===
Model Band1 Band2 Band3 Band4 Band5 Total
15-25 25-50 50-100 100-350 15-150 15-350 keV
Fluence PL 6.26e-08 1.21e-07 1.82e-07 5.90e-07 5.12e-07 9.55e-07 erg/cm2
90%_error_low -9.72e-09 -1.17e-08 -2.23e-08 -1.42e-07 -5.38e-08 -1.61e-07 erg/cm2
90%_error_hi 1.01e-08 1.16e-08 2.22e-08 1.70e-07 5.44e-08 1.85e-07 erg/cm2
Peak flux PL 3.92e-01 3.78e-01 2.54e-01 2.68e-01 1.13e+00 1.29e+00 ph/cm2/s
90%_error_low -9.52e-02 -6.46e-02 -5.93e-02 -1.04e-01 -1.91e-01 -2.27e-01 ph/cm2/s
90%_error_hi 1.00e-01 6.45e-02 5.94e-02 1.35e-01 1.91e-01 2.31e-01 ph/cm2/s
Fluence CPL 6.12e-08 1.23e-07 1.84e-07 4.70e-07 5.06e-07 8.38e-07 erg/cm2
90%_error_low -1.16e-08 -1.32e-08 -2.35e-08 -2.88e-07 -6.03e-08 -2.92e-07 erg/cm2
90%_error_hi 1.05e-08 1.47e-08 2.42e-08 1.54e-07 5.86e-08 2.87e-07 erg/cm2
Peak flux CPL 3.14e-01 4.61e-01 2.64e-01 4.53e-02 1.08e+00 1.08e+00 ph/cm2/s
90%_error_low -1.21e-01 -9.23e-02 -7.83e-02 -4.53e-02 -1.96e-01 -2.01e-01 ph/cm2/s
90%_error_hi 1.21e-01 9.61e-02 7.49e-02 1.30e-01 1.97e-01 2.13e-01 ph/cm2/s
======================================================================
Image
Pre-slew 15.0-350.0 keV image (Event data)
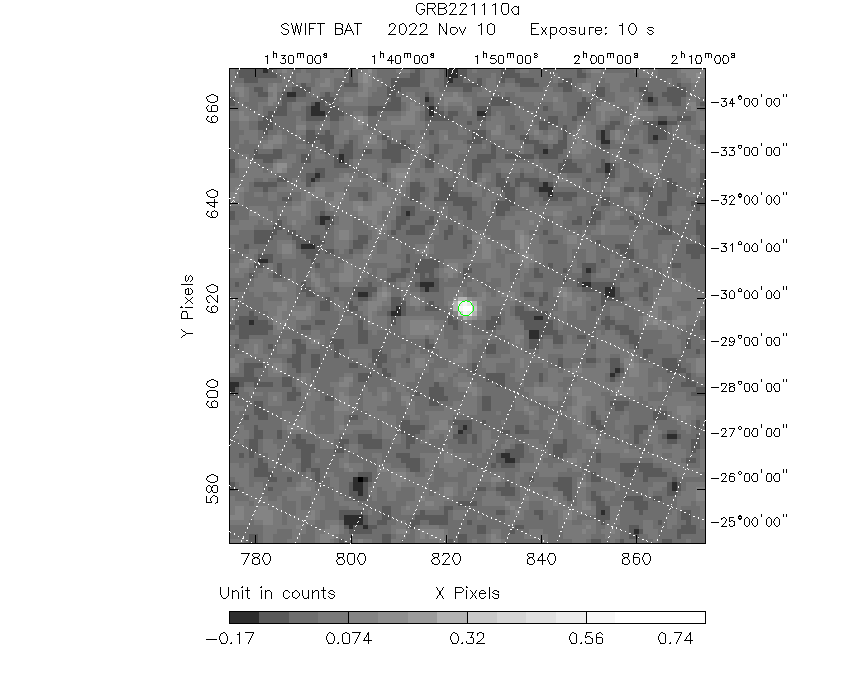
#   RAcent    DECcent   POSerr    Theta     Phi              Peak Cts       SNR   Name
   29.1063   -27.2979   0.0112    17.6978   -68.5708         0.8305010     17.198 TRIG_01136936

Foreground time interval of the image:
 -0.408   9.736 (delta_t =  10.144 [sec])
Background time interval of the image:
-239.744  -0.408 (delta_t = 239.336 [sec])
Light Curves
Note: The mask-weighted lightcurves have units of either count/det or counts/sec/det, where a det is 0.4 x 0.4 = 0.16 sq cm.
Full-time range; 1 s binning
Other quick-look light curves:
- 64 ms binning (zoomed)
- 16 ms binning (zoomed)
- 8 ms binning (zoomed)
- 2 ms binning (zoomed)
- SN=5 or 10 s binning (full-time range)
- Raw light curve
Spectra
- 64 ms binning (zoomed)
- 16 ms binning (zoomed)
- 8 ms binning (zoomed)
- 2 ms binning (zoomed)
- SN=5 or 10 s binning (full-time range)
- Raw light curve
Spectra
Notes:
- 1) The fitting includes the systematic errors.
- 2) When the burst includes telescope slew time periods, the fitting uses an average response file made from multiple 5-s response files through out the slew time plus single time preiod for the non-slew times, and weighted by the total counts in the corresponding time period using addrmf. An average response file is needed becuase a spectral fit using the pre-slew DRM will introduce some errors in both a spectral shape and a normalization if the PHA file contains a lot of the slew/post-slew time interval.
- 3) For fits to more complicated models (e.g. a power-law over a cutoff power-law), the BAT team has decided to require a chi-square improvement of more than 6 for each extra dof.
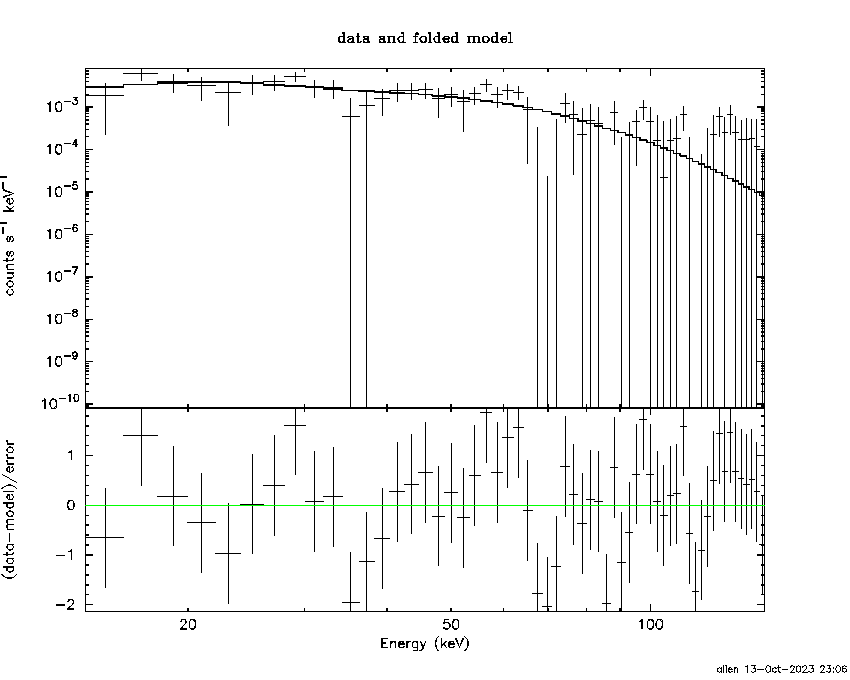
Time averaged spectrum fit using the average DRM
Power-law model
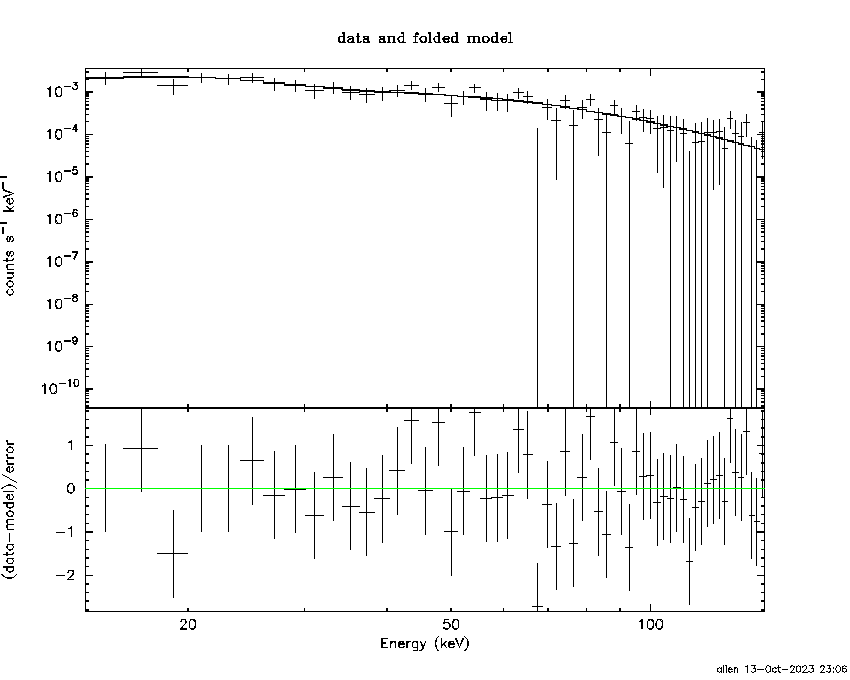
Time interval is from   -0.408 sec. to    9.736 sec.

Spectral model in power-law:
------------------------------------------------------------
Parameters  : value       lower 90%   higher 90%
Photon index: -1.41483     ( -0.163191   0.161927 )
Norm@50keV  : 5.23574E-03    ( -0.000492738   0.000490232 )
------------------------------------------------------------
#Fit statistic  : Chi-Squared                   45.99     using 59 bins.
 Reduced chi-squared = 0.806842
# Null hypothesis probability of 8.52e-01 with 57 degrees of freedom

Photon flux (15-150 keV)    in 10.14 sec: 0.639806 ( -0.059267  0.059333 ) ph/cm2/s
Energy fluence (15-150 keV)             : 5.11526e-07 ( -5.38191e-08  5.44495e-08 ) ergs/cm2
Cutoff power-law model
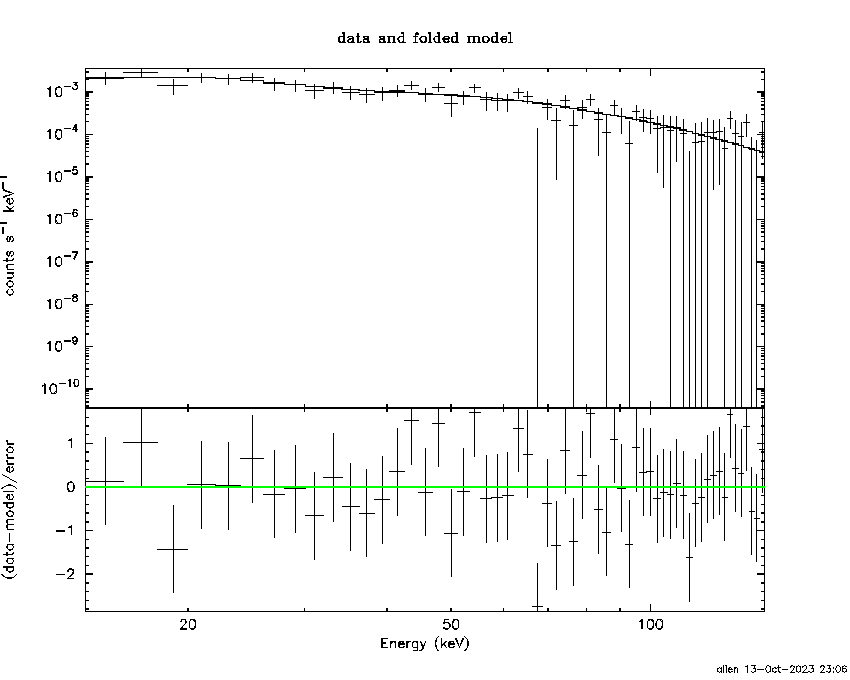
Time interval is from   -0.408 sec. to    9.736 sec.
Spectral model in the cutoff power-law:
------------------------------------------------------------
Parameters  : value       lower 90%   higher 90%
Photon index: -1.27596     ( -0.411718   0.700034 )
Epeak [keV] : 261.800      ( -261.826 -261.826 )
Norm@50keV  : 6.15882E-03    ( -0.00212731   0.00751026 )
------------------------------------------------------------
#Fit statistic  : Chi-Squared                   45.85     using 59 bins.
 Reduced chi-squared = 0.81875
# Null hypothesis probability of 8.32e-01 with 56 degrees of freedom

Photon flux (15-150 keV)    in 10.14 sec: 0.636102 ( -0.061696  0.061419 ) ph/cm2/s
Energy fluence (15-150 keV)             : 5.05881e-07 ( -6.02572e-08  5.85987e-08 ) ergs/cm2
1-s peak spectrum fit
Power-law model
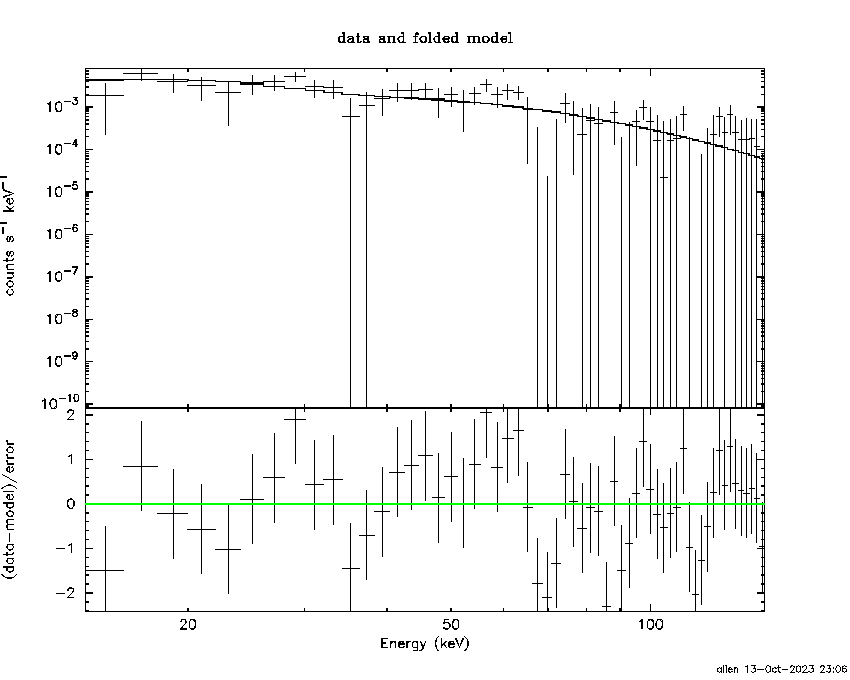
Time interval is from    0.516 sec. to    1.516 sec.

Spectral model in power-law:
------------------------------------------------------------
Parameters  : value       lower 90%   higher 90%
Photon index: -1.57113     ( -0.279067   0.267204 )
Norm@50keV  : 8.88504E-03    ( -0.00165935   0.00162996 )
------------------------------------------------------------
#Fit statistic  : Chi-Squared                   59.29     using 59 bins.
 Reduced chi-squared = 1.04018
# Null hypothesis probability of 3.92e-01 with 57 degrees of freedom

Photon flux (15-150 keV)    in 1 sec: 1.13183 ( -0.191349  0.19137 ) ph/cm2/s
Energy fluence (15-150 keV)             : 8.34084e-08 ( -1.66232e-08  1.70185e-08 ) ergs/cm2
Cutoff power-law model
Time interval is from    0.516 sec. to    1.516 sec.
Spectral model in the cutoff power-law:
------------------------------------------------------------
Parameters  : value       lower 90%   higher 90%
Photon index: 0.240567     ( -1.46421   2.10062 )
Epeak [keV] : 55.0054      ( -11.2457 45.9874 )
Norm@50keV  : 8.84589E-02    ( -0.0911009   1.10494 )
------------------------------------------------------------
#Fit statistic  : Chi-Squared                   54.50     using 59 bins.
 Reduced chi-squared = 0.973214
# Null hypothesis probability of 5.32e-01 with 56 degrees of freedom

Photon flux (15-150 keV)    in 1 sec: 1.07790 ( -0.196336  0.19674 ) ph/cm2/s
Energy fluence (15-150 keV)             : 7.2267e-08 ( -1.60471e-08  1.84733e-08 ) ergs/cm2
Time-resolved spectra
Distribution
T90 vs. Hardness ratio plot
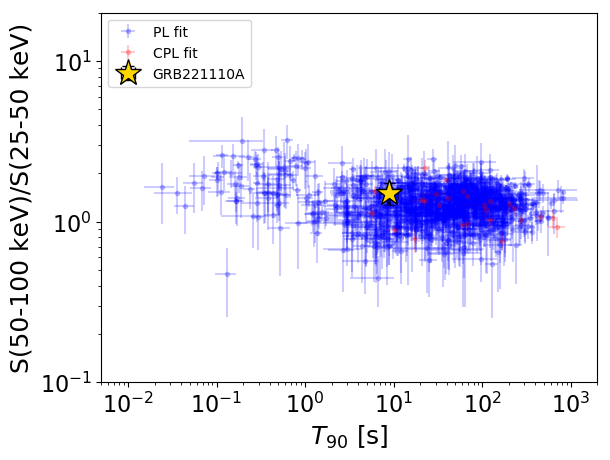
T90                                   = 8.98 sec.
Hardness ratio (energy fluence ratio) = 1.50023768652
S(15-50 keV) vs. S(50-150 keV) plot
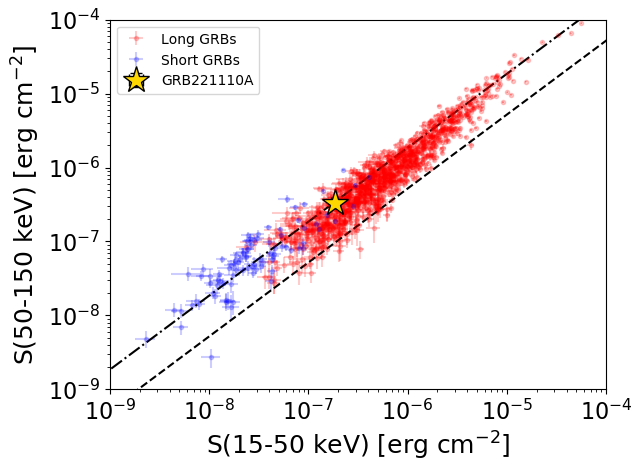
S(15-50 keV)  = 1.8375988e-07
S(50-150 keV) = 3.277657e-07
The dash-dotted line and the dashed line traces the fluences calculated from the Band function with Epeak = 15 and 150 keV, respectively. Both lines assume a canonical values of alpha = -1 and beta = -2.5.
Mask shadow pattern
IMX = 1.165831900360716E-01, IMY = 2.970397902554033E-01
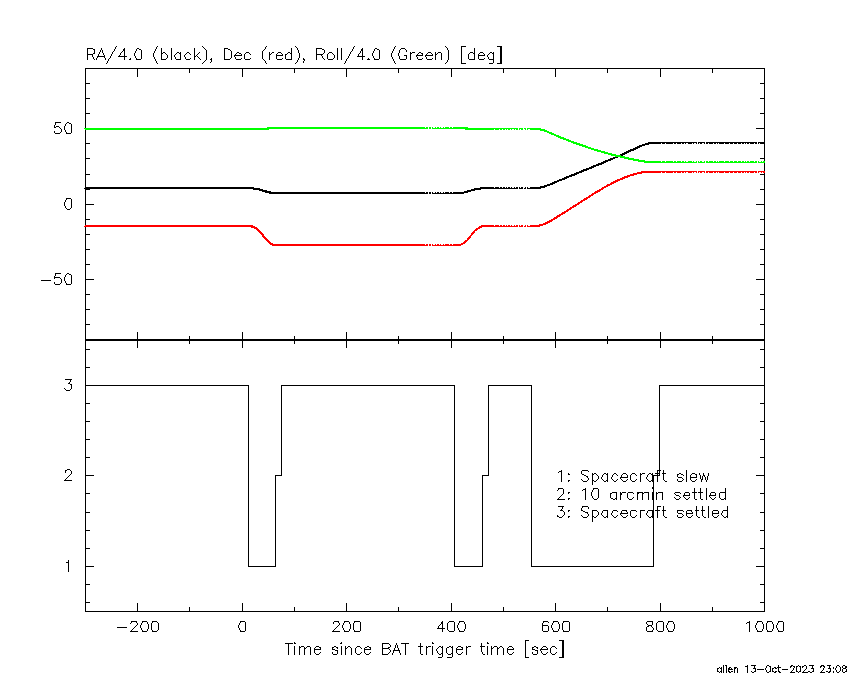
Spacecraft aspect plot
Bright source in the pre-burst/pre-slew/post-slew images
Pre-burst image of 15-350 keV band
Time interval of the image:
-239.744000 -0.408000

# RAcent  DECcent POSerr Theta    Phi  PeakCts   SNR AngSep     Name
#  [deg]    [deg]    ['] [deg]  [deg]                   [']
 27.2890  14.4976    2.3  32.5   42.2   3.7322   5.0 ------	UNKNOWN
  8.0721 -10.2657    2.9  33.6  -16.9   2.3521   3.9 ------	UNKNOWN
 44.7948 -35.3862    2.4  21.0 -116.0   3.1649   4.9 ------	UNKNOWN
 17.2047 -49.9251    2.4  40.9  -85.5  11.1152   4.8 ------	UNKNOWN
Pre-slew background subtracted image of 15-350 keV band
Time interval of the image:
-0.408000 9.736000

# RAcent  DECcent POSerr Theta    Phi  PeakCts   SNR AngSep     Name
#  [deg]    [deg]    ['] [deg]  [deg]                   [']
 29.1063 -27.2979    0.7  17.7  -68.6   0.8305  17.2 ------	UNKNOWN
Post-slew image of 15-350 keV band
Time interval of the image:
63.156600 407.356600

# RAcent  DECcent POSerr Theta    Phi  PeakCts   SNR AngSep     Name
#  [deg]    [deg]    ['] [deg]  [deg]                   [']
 15.0798   2.2973    2.6  32.5   42.2   4.6076   4.5 ------	UNKNOWN
 22.5288 -25.6764    3.4   6.1   -7.0   2.6266   3.4 ------	UNKNOWN
353.0592 -20.2725    2.7  33.6  -16.9   3.7544   4.3 ------	UNKNOWN
353.5843 -32.4067    2.8  31.1  -39.2   3.8618   4.1 ------	UNKNOWN
 10.2274 -65.1226    3.7  39.7  -98.7   9.7876   3.1 ------	UNKNOWN