Analysis Summary
Notes:
- 1) No attempt has been made to eliminate the non-significant decimal places.
- 2) This batgrbproduct analysis is done using the HEASARC data.
- 3) This batgrbproduct analysis is using the flight position for the mask-weighting calculation.
======================================================================
BAT GRB EVENT DATA PROCESSING REPORT
Process Script Ver: batgrbproduct v2.48
Process Start Time: Wed Jun 14 12:09:11 EDT 2023
Host Name: batproc1
Current Working Dir: /local/data/bat1/alien/Swift_3rdBATcatalog/event/batevent_reproc/trigger1141030
======================================================================
Trigger: 01141030 Segment: 000
BAT Trigger Time: 690672598.4 [s; MET]
Trigger Stop: 690672598.656 [s; MET]
UTC: 2022-11-20T21:29:28.146920 [includes UTCF correction]
Where From?: TDRSS position message
BAT
RA: 41.3447019871665 Dec: 43.2031229320889 [deg; J2000]
Catalogged Source?: NO
Point Source?: YES
GRB Indicated?: YES [ by BAT flight software ]
Image S/N Ratio: 7.27
Image Trigger?: NO
Rate S/N Ratio: 26.7768556779918 [ if not an image trigger ]
Image S/N Ratio: 7.27
Analysis Position: [ source = BAT ]
RA: 41.3447019871665 Dec: 43.2031229320889 [deg; J2000]
Refined Position: [ source = BAT pre-slew burst ]
RA: 41.3625338171834 Dec: 43.2405266763403 [deg; J2000]
{ 02h 45m 27.0s , +43d 14' 25.9" }
+/- 1.84724267837746 [arcmin] (estimated 90% radius based on SNR)
+/- 0.86150877349655 [arcmin] (formal 1-sigma fit error)
SNR: 12.6581394093164
Angular difference between the analysis and refined position is 2.375795 arcmin
Partial Coding Fraction: 0.9765625 [ including projection effects ]
Duration
T90: 0.79200005531311 +/- 0.1600999894275
Measured from: -0.544000029563904
to: 0.248000025749207 [s; relative to TRIGTIME]
T50: 0.471999883651733 +/- 0.0824621495203577
Measured from: -0.327999949455261
to: 0.143999934196472 [s; relative to TRIGTIME]
Fluence
Peak Flux (peak 1 second)
Measured from: -0.666000008583069
to: 0.333999991416931 [s; relative to TRIGTIME]
Total Fluence
Measured from: -0.603999972343445
to: 0.272000074386597 [s; relative to TRIGTIME]
Band 1 Band 2 Band 3 Band 4
15-25 25-50 50-100 100-350 keV
Total 0.028693 0.047533 0.059009 0.024726
0.006804 0.007477 0.007604 0.006443 [error]
Peak 0.029280 0.049052 0.057904 0.023932
0.007233 0.007830 0.007882 0.006737 [error]
[ fluence units of on-axis counts / fully illuminated detector ]
======================================================================
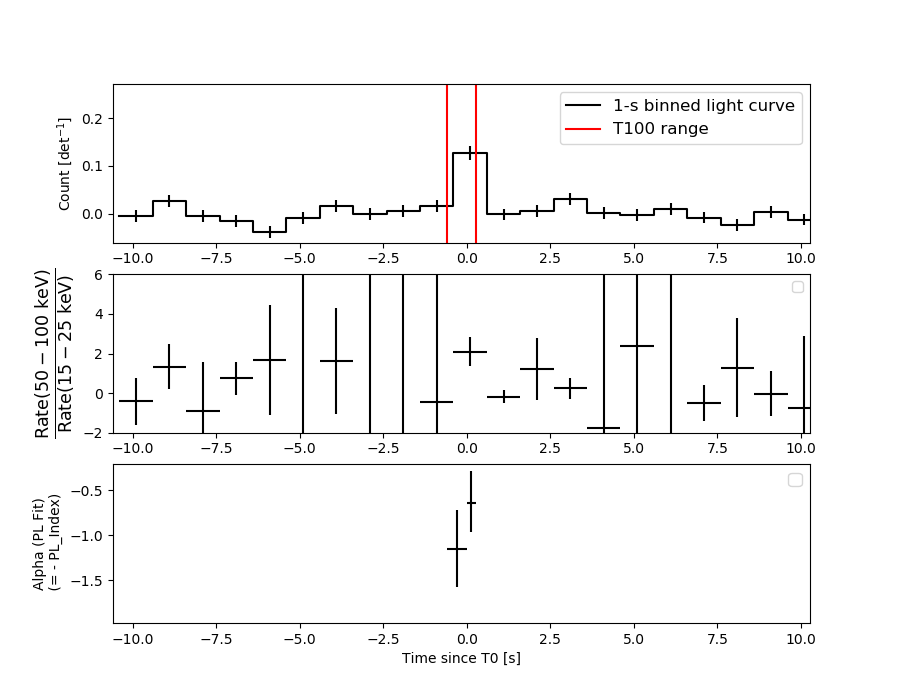
====== Table of the duration information =============================
Value tstart tstop
T100 0.876 -0.604 0.272
T90 0.792 -0.544 0.248
T50 0.472 -0.328 0.144
Peak 1.000 -0.666 0.334
====== Spectral Analysis Summary =====================================
Model : spectral model: simple power-law (PL) and cutoff power-law (CPL)
Ph_index : photon index: E^{Ph_index}
Ph_90err : 90% error of the photon index
Epeak : Epeak in keV
Epeak_90err: 90% error of Epeak
Norm : normalization at 50 keV in both the PL model and CPL model
Nomr_90err : 90% error of the normalization
chi2 : Chi-Squared
dof : degree of freedo
=== Time-averaged spectral analysis ===
(Best model with acceptable fit: PL)
Model Ph_index Ph_90err_low Ph_90err_hi Epeak Epeak_90err_low Epeak_90err_hi Norm Nomr_90err_low Norm_90err_hi chi2 dof
PL -0.846 -0.260 0.274 - - - 1.16e-02 -1.71e-03 1.69e-03 54.830 57
CPL -0.766 -0.338 0.984 880.699 -880.699 -880.699 1.26e-02 -1.26e-02 1.93e-02 54.870 56
=== 1-s peak spectral analysis ===
(Best model with acceptable fit: PL)
Model Ph_index Ph_90err_low Ph_90err_hi Epeak Epeak_90err_low Epeak_90err_hi Norm Nomr_90err_low Norm_90err_hi chi2 dof
PL -0.863 -0.275 0.292 - - - 1.02e-02 -1.57e-03 1.55e-03 47.770 57
CPL -0.789 -0.351 0.805 935.164 -935.164 -935.164 1.11e-02 -2.33e-03 -1.11e-02 47.910 56
=== Fluence/Peak Flux Summary ===
Model Band1 Band2 Band3 Band4 Band5 Total
15-25 25-50 50-100 100-350 15-150 15-350 keV
Fluence PL 7.03e-09 1.93e-08 4.30e-08 2.54e-07 1.16e-07 3.23e-07 erg/cm2
90%_error_low -2.08e-09 -3.60e-09 -6.87e-09 -8.38e-08 -1.85e-08 -8.80e-08 erg/cm2
90%_error_hi 2.31e-09 3.49e-09 6.77e-09 1.12e-07 1.86e-08 1.13e-07 erg/cm2
Peak flux PL 2.29e-01 3.38e-01 3.72e-01 7.68e-01 1.17e+00 1.71e+00 ph/cm2/s
90%_error_low -7.21e-02 -6.80e-02 -6.03e-02 -2.49e-01 -1.78e-01 -2.92e-01 ph/cm2/s
90%_error_hi 8.09e-02 6.58e-02 5.93e-02 3.26e-01 1.78e-01 3.21e-01 ph/cm2/s
Fluence CPL 2.08e-09 2.78e-09 2.88e-09 6.98e-09 9.60e-09 1.49e-08 erg/cm2
90%_error_low -2.08e-09 -2.78e-09 -2.88e-09 N/A -9.60e-09 N/A erg/cm2
90%_error_hi 2.25e-09 2.05e-08 3.04e-09 N/A 1.11e-08 N/A erg/cm2
Peak flux CPL 2.35e-01 3.39e-01 3.70e-01 8.21e-01 1.18e+00 1.67e+00 ph/cm2/s
90%_error_low -8.77e-02 -4.84e-02 -5.89e-02 -8.21e-01 -2.02e-01 -4.41e-01 ph/cm2/s
90%_error_hi 6.46e-02 6.57e-02 6.66e-02 -6.98e-01 1.89e-01 3.32e-01 ph/cm2/s
======================================================================
Image
Pre-slew 15.0-350.0 keV image (Event data)
#   RAcent    DECcent   POSerr    Theta     Phi              Peak Cts       SNR   Name
   41.3625    43.2405   0.0152    14.9680   -25.7135         0.1851061     12.658 TRIG_01141030

Foreground time interval of the image:
 -0.604   0.272 (delta_t =   0.876 [sec])
Background time interval of the image:
-84.699  -0.604 (delta_t =  84.095 [sec])
Light Curves
Note: The mask-weighted lightcurves have units of either count/det or counts/sec/det, where a det is 0.4 x 0.4 = 0.16 sq cm.
Full-time range; 1 s binning
Other quick-look light curves:
- 64 ms binning (zoomed)
- 16 ms binning (zoomed)
- 8 ms binning (zoomed)
- 2 ms binning (zoomed)
- SN=5 or 10 s binning (full-time range)
- Raw light curve
Spectra
- 64 ms binning (zoomed)
- 16 ms binning (zoomed)
- 8 ms binning (zoomed)
- 2 ms binning (zoomed)
- SN=5 or 10 s binning (full-time range)
- Raw light curve
Spectra
Notes:
- 1) The fitting includes the systematic errors.
- 2) When the burst includes telescope slew time periods, the fitting uses an average response file made from multiple 5-s response files through out the slew time plus single time preiod for the non-slew times, and weighted by the total counts in the corresponding time period using addrmf. An average response file is needed becuase a spectral fit using the pre-slew DRM will introduce some errors in both a spectral shape and a normalization if the PHA file contains a lot of the slew/post-slew time interval.
- 3) For fits to more complicated models (e.g. a power-law over a cutoff power-law), the BAT team has decided to require a chi-square improvement of more than 6 for each extra dof.
Time averaged spectrum fit using the average DRM
Power-law model
Time interval is from   -0.604 sec. to    0.272 sec.

Spectral model in power-law:
------------------------------------------------------------
Parameters  : value       lower 90%   higher 90%
Photon index: -0.846208     ( -0.26011   0.274296 )
Norm@50keV  : 1.15558E-02    ( -0.00170997   0.00169276 )
------------------------------------------------------------
#Fit statistic  : Chi-Squared                   54.83     using 59 bins.
 Reduced chi-squared = 0.96193
# Null hypothesis probability of 5.57e-01 with 57 degrees of freedom

Photon flux (15-150 keV)    in 0.876 sec: 1.32657 ( -0.19364  0.19414 ) ph/cm2/s
Energy fluence (15-150 keV)             : 1.16071e-07 ( -1.84586e-08  1.86249e-08 ) ergs/cm2
Cutoff power-law model

Time interval is from   -0.604 sec. to    0.272 sec.
Spectral model in the cutoff power-law:
------------------------------------------------------------
Parameters  : value       lower 90%   higher 90%
Photon index: -0.839452     ( -0.328542   0.993253 )
Epeak [keV] : 9999.31      ( -9999.32 -9999.32 )
Norm@50keV  : 1.16358E-02    ( -0.0116358   0.0201885 )
------------------------------------------------------------
#Fit statistic  : Chi-Squared                   54.83     using 59 bins.
 Reduced chi-squared = 0.979107
# Null hypothesis probability of 5.19e-01 with 56 degrees of freedom

Photon flux (15-150 keV)    in 0.876 sec: 1.32835 ( -0.20203  0.1945 ) ph/cm2/s
Energy fluence (15-150 keV)             : 9.60429e-09 ( -9.60429e-09  1.11135e-08 ) ergs/cm2
1-s peak spectrum fit
Power-law model
Time interval is from   -0.666 sec. to    0.334 sec.

Spectral model in power-law:
------------------------------------------------------------
Parameters  : value       lower 90%   higher 90%
Photon index: -0.863431     ( -0.275387   0.291511 )
Norm@50keV  : 1.02227E-02    ( -0.00156715   0.00155015 )
------------------------------------------------------------
#Fit statistic  : Chi-Squared                   47.77     using 59 bins.
 Reduced chi-squared = 0.83807
# Null hypothesis probability of 8.03e-01 with 57 degrees of freedom

Photon flux (15-150 keV)    in 1 sec: 1.17330 ( -0.177839  0.17834 ) ph/cm2/s
Energy fluence (15-150 keV)             : 1.16405e-07 ( -1.92668e-08  1.94545e-08 ) ergs/cm2
Cutoff power-law model

Time interval is from   -0.666 sec. to    0.334 sec.
Spectral model in the cutoff power-law:
------------------------------------------------------------
Parameters  : value       lower 90%   higher 90%
Photon index: -0.856949     ( -0.347812   0.80803 )
Epeak [keV] : 1.00000E+04      ( -10000 -10000 )
Norm@50keV  : 1.02916E-02    ( -0.00157424   -0.0102921 )
------------------------------------------------------------
#Fit statistic  : Chi-Squared                   47.78     using 59 bins.
 Reduced chi-squared = 0.853214
# Null hypothesis probability of 7.75e-01 with 56 degrees of freedom

Photon flux (15-150 keV)    in 1 sec: 1.17873 ( -0.201992  0.18892 ) ph/cm2/s
Energy fluence (15-150 keV)             : 1.23914e-08 ( -1.23914e-08  9.96851e-09 ) ergs/cm2
Time-resolved spectra
Distribution
T90 vs. Hardness ratio plot
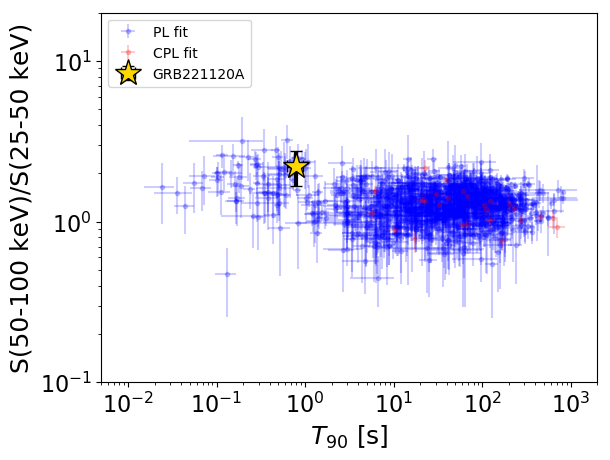
T90                                   = 0.7920001 sec.
Hardness ratio (energy fluence ratio) = 2.22499944437
S(15-50 keV) vs. S(50-150 keV) plot
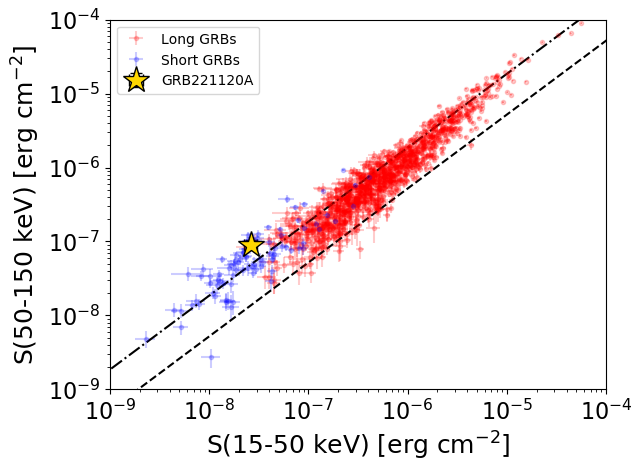
S(15-50 keV)  = 2.6381337e-08
S(50-150 keV) = 8.968871e-08
The dash-dotted line and the dashed line traces the fluences calculated from the Band function with Epeak = 15 and 150 keV, respectively. Both lines assume a canonical values of alpha = -1 and beta = -2.5.
Mask shadow pattern
IMX = 2.408769696907946E-01, IMY = 1.159959397182839E-01
Spacecraft aspect plot
Bright source in the pre-burst/pre-slew/post-slew images
Pre-burst image of 15-350 keV band
Time interval of the image:
-84.699400 -0.604000

# RAcent  DECcent POSerr Theta    Phi  PeakCts   SNR AngSep     Name
#  [deg]    [deg]    ['] [deg]  [deg]                   [']
 83.6174  22.0027    1.2  41.9   51.6   3.3691   9.2    1.1	Crab
 91.7010  64.7874    2.6  49.3   -9.5   1.2429   4.5 ------	UNKNOWN
 86.8555  77.6171    2.1  53.8  -25.0   3.7678   5.4 ------	UNKNOWN
354.2453  11.1600    2.4  44.0 -140.9   1.5536   4.9 ------	UNKNOWN
Pre-slew background subtracted image of 15-350 keV band
Time interval of the image:
-0.604000 0.272000

# RAcent  DECcent POSerr Theta    Phi  PeakCts   SNR AngSep     Name
#  [deg]    [deg]    ['] [deg]  [deg]                   [']
 83.6845  22.0069   20.5  42.0   51.6   0.0215   0.6    2.9	Crab
 96.5151  45.8414    2.0  48.8   15.9   0.1796   5.7 ------	UNKNOWN
 27.9434  11.6500    2.0  19.2  173.2   0.0843   5.8 ------	UNKNOWN
 41.3625  43.2405    0.9  15.0  -25.7   0.1851  12.7 ------	UNKNOWN
352.3487  55.6161    2.4  41.9  -73.5   0.2717   4.7 ------	UNKNOWN
Post-slew image of 15-350 keV band
Time interval of the image:
76.300590 720.236600
720.600000 785.166500
786.600000 962.611600

# RAcent  DECcent POSerr Theta    Phi  PeakCts   SNR AngSep     Name
#  [deg]    [deg]    ['] [deg]  [deg]                   [']
 83.6357  21.9923    0.6  40.9   50.6  32.4464  19.7    1.3	Crab
 77.4759  47.6436    2.2  25.5   10.4   4.6421   5.2 ------	UNKNOWN
101.6005  63.8640    3.1  39.3  -19.7   4.5996   3.8 ------	UNKNOWN
343.9442  80.4900    3.1  42.3  -68.8  14.5374   3.7 ------	UNKNOWN
341.4734  80.4244    3.6  42.6  -69.2  13.0148   3.3 ------	UNKNOWN
338.7367  73.9356    3.4  41.4  -78.7  14.2862   3.4 ------	UNKNOWN