Analysis Summary
Notes:
- 1) No attempt has been made to eliminate the non-significant decimal places.
- 2) This batgrbproduct analysis is done using the HEASARC data.
- 3) This batgrbproduct analysis is using the flight position for the mask-weighting calculation.
======================================================================
                  BAT GRB EVENT DATA PROCESSING REPORT
    Process Script Ver: batgrbproduct v2.48
    Process Start Time: Fri Oct 13 22:47:03 EDT 2023
             Host Name: batproc1
   Current Working Dir: /local/data/bat1/alien/Swift_3rdBATcatalog/event/batevent_reproc/trigger1142847
======================================================================

  Trigger: 01142847      Segment: 000

  BAT Trigger Time: 691590336   [s; MET]
      Trigger Stop: 691590400   [s; MET]
               UTC: 2022-12-01T12:25:05.684420    [includes UTCF correction]
       Where From?: TDRSS position message

  BAT
    RA: 266.933488910624   Dec: -68.2595112495696  [deg; J2000]

     Catalogged Source?: NO
     Point Source?:      YES
     GRB Indicated?:     YES    [ by BAT flight software ]
     Image S/N Ratio:    15.65
     Image Trigger?:     YES
     Rate S/N Ratio:     0  [ if not an image trigger ]
     Image S/N Ratio:    15.65

  Analysis Position:   [ source = BAT ]
    RA: 266.933488910624   Dec: -68.2595112495696  [deg; J2000]

  Refined Position:   [ source = BAT pre-slew burst ]
    RA: 266.902237638968   Dec: -68.2297450175881  [deg; J2000]
        { 17h 47m 36.5s , -68d 13' 47.1" }
         +/- 0.842356941330918 [arcmin] (estimated 90% radius based on SNR)
         +/- 0.315855591279388 [arcmin] (formal 1-sigma fit error)
    SNR: 38.8644421748075

  Angular difference between the analysis and refined position is 1.916431 arcmin

  Partial Coding Fraction: 0.515625    [ including projection effects ]

  Duration
     T90: 33.7199999094009 +/- 2.03901935339401
        Measured from: -18.7599999904633
                   to: 14.9599999189377     [s; relative to TRIGTIME]
     T50: 12.6920000314713 +/- 0.832742397966511
        Measured from: -13.3200000524521
                   to: -0.628000020980835     [s; relative to TRIGTIME]


  Fluence
     Peak Flux  (peak 1 second)
        Measured from: -13.5080000162125
                   to: -12.5080000162125     [s; relative to TRIGTIME]
     Total Fluence
        Measured from: -20.8839999437332
                   to: 22.9199999570847     [s; relative to TRIGTIME]

             Band 1     Band 2     Band 3     Band 4
              15-25      25-50     50-100    100-350     keV
 Total     3.691125   5.154171   3.648393   0.834620
           0.098010   0.100579   0.085387   0.064809 [error]
 Peak      0.240487   0.449703   0.518359   0.167044
           0.018539   0.023060   0.023549   0.016920 [error]

     [ fluence units of on-axis counts / fully illuminated detector ]

======================================================================


====== Table of the duration information =============================

        Value   tstart    tstop
T100   43.804  -20.884   22.920
T90    33.720  -18.760   14.960
T50    12.692  -13.320   -0.628
Peak    1.000  -13.508  -12.508


====== Spectral Analysis Summary =====================================

Model      : spectral model: simple power-law (PL) and cutoff power-law (CPL)
Ph_index   : photon index: E^{Ph_index}
Ph_90err   : 90% error of the photon index
Epeak      : Epeak in keV
Epeak_90err: 90% error of Epeak
Norm       : normalization at 50 keV in both the PL model and CPL model
Nomr_90err : 90% error of the normalization
chi2       : Chi-Squared
dof        : degree of freedo

=== Time-averaged spectral analysis ===
(Best model with acceptable fit: N/A)

Model Ph_index Ph_90err_low Ph_90err_hi  Epeak  Epeak_90err_low  Epeak_90err_hi  Norm       Nomr_90err_low    Norm_90err_hi    chi2    dof
PL      -1.633    -0.048      0.048       -           -               -         2.09e-02     -5.30e-04          5.30e-04      79.990   57
CPL     -1.389    -0.187      0.195      135.829     -37.396       238.168      2.71e-02     -4.79e-03          6.12e-03      74.990   56


=== 1-s peak spectral analysis ===
(Best model with acceptable fit: N/A)

Model Ph_index Ph_90err_low Ph_90err_hi  Epeak  Epeak_90err_low  Epeak_90err_hi  Norm       Nomr_90err_low    Norm_90err_hi    chi2    dof
PL      -1.015     -0.085     0.086       -           -               -         9.65e-02     -4.96e-03          4.96e-03      58.170   57
CPL     -0.629     -0.344     0.373      205.840     -73.634       793.272      1.44e-01     -4.19e-02          6.47e-02      54.480   56


=== Fluence/Peak Flux Summary ===

              Model    Band1     Band2     Band3     Band4     Band5     Total
                       15-25     25-50    50-100    100-350    15-150    15-350    keV
Fluence         PL   1.32e-06  2.24e-06  2.90e-06  7.52e-06  8.53e-06  1.40e-05   erg/cm2
      90%_error_low -6.61e-08 -6.56e-08 -9.07e-08 -5.21e-07 -2.22e-07 -5.73e-07   erg/cm2
      90%_error_hi   6.74e-08  6.56e-08  9.04e-08  5.47e-07  2.23e-07  5.91e-07   erg/cm2
Peak flux       PL   7.71e-04  1.11e-02  1.03e-01  1.10e+01  4.57e-01  1.09e+01   ph/cm2/s
      90%_error_low     N/A       N/A       N/A       N/A       N/A       N/A     ph/cm2/s
      90%_error_hi      N/A       N/A       N/A       N/A       N/A       N/A     ph/cm2/s

Fluence        CPL   1.25e-06  2.28e-06  2.95e-06  5.47e-06  8.40e-06  1.20e-05   erg/cm2
      90%_error_low -8.46e-08 -7.11e-08 -1.01e-07 -1.14e-06 -2.47e-07 -1.16e-06   erg/cm2
      90%_error_hi   8.62e-08  7.16e-08  1.02e-07  1.51e-06  2.46e-07  1.51e-06   erg/cm2
Peak flux      CPL   2.27e+00  3.44e+00  3.50e+00  4.10e+00  1.10e+01  1.33e+01   ph/cm2/s
      90%_error_low -3.17e-01 -2.31e-01 -2.38e-01 -1.11e+00 -5.93e-01 -1.25e+00   ph/cm2/s
      90%_error_hi   3.27e-01  2.34e-01  2.41e-01  1.62e+00  5.93e-01  1.67e+00   ph/cm2/s

======================================================================
Image
Pre-slew 15.0-350.0 keV image (Event data)
#   RAcent    DECcent   POSerr    Theta     Phi              Peak Cts       SNR   Name
  266.9022   -68.2297   0.0049    34.2185   -38.6316         9.6602545     38.864 TRIG_01142847

Foreground time interval of the image:
-13.299  22.920 (delta_t =  36.219 [sec])
Background time interval of the image:
Light Curves
Note: The mask-weighted lightcurves have units of either count/det or counts/sec/det, where a det is 0.4 x 0.4 = 0.16 sq cm.
Full-time range; 1 s binning
Other quick-look light curves:
- 64 ms binning (zoomed)
- 16 ms binning (zoomed)
- 8 ms binning (zoomed)
- 2 ms binning (zoomed)
- SN=5 or 10 s binning (full-time range)
- Raw light curve
Spectra
- 64 ms binning (zoomed)
- 16 ms binning (zoomed)
- 8 ms binning (zoomed)
- 2 ms binning (zoomed)
- SN=5 or 10 s binning (full-time range)
- Raw light curve
Spectra
Notes:
- 1) The fitting includes the systematic errors.
- 2) When the burst includes telescope slew time periods, the fitting uses an average response file made from multiple 5-s response files through out the slew time plus single time preiod for the non-slew times, and weighted by the total counts in the corresponding time period using addrmf. An average response file is needed becuase a spectral fit using the pre-slew DRM will introduce some errors in both a spectral shape and a normalization if the PHA file contains a lot of the slew/post-slew time interval.
- 3) For fits to more complicated models (e.g. a power-law over a cutoff power-law), the BAT team has decided to require a chi-square improvement of more than 6 for each extra dof.
Time averaged spectrum fit using the average DRM
Power-law model

Time interval is from  -20.884 sec. to   22.920 sec.

Spectral model in power-law:
------------------------------------------------------------
Parameters  : value       lower 90%   higher 90%
Photon index: -1.63299     ( -0.0476358   0.0476073 )
Norm@50keV  : 2.09075E-02    ( -0.000529787   0.000529753 )
------------------------------------------------------------
#Fit statistic  : Chi-Squared                   79.99     using 59 bins.
 Reduced chi-squared = 1.40333
# Null hypothesis probability of 2.40e-02 with 57 degrees of freedom

Photon flux (15-150 keV)    in 43.8 sec: 2.71500 ( -0.07862  0.07891 ) ph/cm2/s
Energy fluence (15-150 keV)             : 8.53303e-06 ( -2.22395e-07  2.22737e-07 ) ergs/cm2
Cutoff power-law model

Time interval is from  -20.884 sec. to   22.920 sec.
Spectral model in the cutoff power-law:
------------------------------------------------------------
Parameters  : value       lower 90%   higher 90%
Photon index: -1.38947     ( -0.187071   0.19547 )
Epeak [keV] : 135.829      ( -37.3972 238.167 )
Norm@50keV  : 2.71193E-02    ( -0.00479441   0.00612133 )
------------------------------------------------------------
#Fit statistic  : Chi-Squared                   74.99     using 59 bins.
 Reduced chi-squared = 1.33911
# Null hypothesis probability of 4.59e-02 with 56 degrees of freedom

Photon flux (15-150 keV)    in 43.8 sec: 2.66422 ( -0.08673  0.08715 ) ph/cm2/s
Energy fluence (15-150 keV)             : 8.39585e-06 ( -2.46663e-07  2.45752e-07 ) ergs/cm2
1-s peak spectrum fit
Power-law model
Time interval is from  -13.508 sec. to  -12.508 sec.

Spectral model in power-law:
------------------------------------------------------------
Parameters  : value       lower 90%   higher 90%
Photon index: -1.01451     ( -0.0851776   0.0860821 )
Norm@50keV  : 9.65000E-02    ( -0.00496326   0.004957 )
------------------------------------------------------------
#Fit statistic  : Chi-Squared                   58.17     using 59 bins.
 Reduced chi-squared = 1.02053
# Null hypothesis probability of 4.32e-01 with 57 degrees of freedom

Photon flux (15-150 keV)    in 1 sec: 0.456917 (    ) ph/cm2/s
Energy fluence (15-150 keV)             : 1.03829e-06 ( -5.72652e-08  5.74058e-08 ) ergs/cm2
Cutoff power-law model

Time interval is from  -13.508 sec. to  -12.508 sec.
Spectral model in the cutoff power-law:
------------------------------------------------------------
Parameters  : value       lower 90%   higher 90%
Photon index: -0.628913     ( -0.343528   0.373398 )
Epeak [keV] : 205.840      ( -73.6344 793.272 )
Norm@50keV  : 0.143608    ( -0.041917   0.0647199 )
------------------------------------------------------------
#Fit statistic  : Chi-Squared                   54.48     using 59 bins.
 Reduced chi-squared = 0.972857
# Null hypothesis probability of 5.33e-01 with 56 degrees of freedom

Photon flux (15-150 keV)    in 1 sec: 10.9978 ( -0.5928  0.593 ) ph/cm2/s
Energy fluence (15-150 keV)             : 1.02542e-06 ( -5.96583e-08  5.93309e-08 ) ergs/cm2
Time-resolved spectra

Distribution
T90 vs. Hardness ratio plot
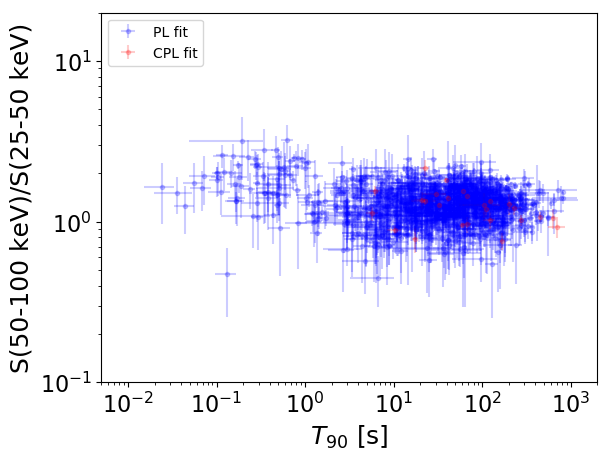
T90                                   = N/A sec.
Hardness ratio (energy fluence ratio) = N/A
S(15-50 keV) vs. S(50-150 keV) plot

S(15-50 keV)  = N/A
S(50-150 keV) = N/A
The dash-dotted line and the dashed line traces the fluences calculated from the Band function with Epeak = 15 and 150 keV, respectively. Both lines assume a canonical values of alpha = -1 and beta = -2.5.
Mask shadow pattern

IMX = 5.312556052117654E-01, IMY = 4.245756649878484E-01
Spacecraft aspect plot
Bright source in the pre-burst/pre-slew/post-slew images
Pre-burst image of 15-350 keV band
Time interval of the image:
Pre-slew background subtracted image of 15-350 keV band
Time interval of the image:
-13.299410 22.920000

# RAcent  DECcent POSerr Theta    Phi  PeakCts   SNR AngSep     Name
#  [deg]    [deg]    ['] [deg]  [deg]                   [']
135.5291 -40.5548   56.2  33.2  114.3  -0.0546  -0.2    0.0	Vela X-1
170.4636 -60.4776    4.5   4.0  122.2   0.4228   2.6    9.8	Cen X-3
186.6666 -62.8088    2.0   4.2  -81.2   0.8384   5.8    2.3	GX 301-2
 95.6286 -53.5340    2.8  41.2   66.0   1.9002   4.2 ------	UNKNOWN
 63.4220 -58.3858    2.3  48.9   42.1   2.9700   5.0 ------	UNKNOWN
152.9869 -23.4125    3.1  42.6  148.3   1.3727   3.8 ------	UNKNOWN
 69.2969 -74.8706    2.5  34.9   28.3   0.9191   4.7 ------	UNKNOWN
122.0019 -70.2876    2.5  22.5   49.2   0.8350   4.7 ------	UNKNOWN
266.9022 -68.2297    0.3  34.2  -38.6   9.6580  38.8 ------	UNKNOWN
191.8339  -6.0270    2.0  57.6 -160.5   5.3874   5.6 ------	UNKNOWN
195.1307 -11.8913    3.0  52.3 -155.5   1.8157   3.9 ------	UNKNOWN
214.1379 -29.7618    2.0  40.4 -124.5   2.3881   5.9 ------	UNKNOWN
Post-slew image of 15-350 keV band
Time interval of the image:
158.300590 830.239400
831.000000 833.909500
835.000000 940.958000
942.000000 963.045400

# RAcent  DECcent POSerr Theta    Phi  PeakCts   SNR AngSep     Name
#  [deg]    [deg]    ['] [deg]  [deg]                   [']
170.4508 -60.5959    5.3  38.0  167.1   2.2767   2.2    4.3	Cen X-3
186.5595 -62.7622    1.4  31.3  174.8   6.4980   8.1    2.7	GX 301-2
255.9366 -37.8641    2.2  31.0  -82.4   5.6044   5.2    2.7	4U 1700-377
256.3407 -36.3650    6.2  32.4  -81.4   2.2974   1.9    5.8	GX 349+2
264.6472 -44.6356    0.0  23.6  -69.4  -0.1243  -0.1   11.9	4U 1735-44
270.3211 -24.9375    2.1  43.3  -60.9  12.2037   5.4    8.7	GX 5-1
270.2047 -25.6247    5.2  42.6  -61.0   4.7406   2.2    8.9	GRS 1758-258
275.7564 -30.2820    5.5  38.3  -53.0   2.8224   2.1   10.1	H1820-303
284.8530 -24.8665   11.4  44.7  -42.0  -1.5452  -1.0   10.5	HT1900.1-2455
262.7680 -33.7399    0.0  34.6  -71.5  -2.1311  -1.5   12.4	GX 354-0
327.7949 -70.9172    3.0  20.5   60.0   3.0256   3.8 ------	UNKNOWN
310.4203 -30.9769    2.5  44.9   -8.6   4.2297   4.6 ------	UNKNOWN
188.7730 -35.5829    3.0  53.0 -159.7   7.4803   3.8 ------	UNKNOWN