Analysis Summary
Notes:
- 1) No attempt has been made to eliminate the non-significant decimal places.
- 2) This batgrbproduct analysis is done using the HEASARC data.
- 3) This batgrbproduct analysis is using the flight position for the mask-weighting calculation.
======================================================================
                  BAT GRB EVENT DATA PROCESSING REPORT
    Process Script Ver: batgrbproduct v2.48
    Process Start Time: Wed Jun 14 12:03:11 EDT 2023
             Host Name: batproc1
   Current Working Dir: /local/data/bat1/alien/Swift_3rdBATcatalog/event/batevent_reproc/trigger1142997
======================================================================

  Trigger: 01142997      Segment: 000

  BAT Trigger Time: 691704400.896   [s; MET]
      Trigger Stop: 691704404.992   [s; MET]
               UTC: 2022-12-02T20:06:10.572660    [includes UTCF correction]
       Where From?: TDRSS position message

  BAT
    RA: 77.0950930217306   Dec: -59.8061378421313  [deg; J2000]

     Catalogged Source?: NO
     Point Source?:      YES
     GRB Indicated?:     YES    [ by BAT flight software ]
     Image S/N Ratio:    7.44
     Image Trigger?:     NO
     Rate S/N Ratio:     11.6189500386223  [ if not an image trigger ]
     Image S/N Ratio:    7.44

  Analysis Position:   [ source = BAT ]
    RA: 77.0950930217306   Dec: -59.8061378421313  [deg; J2000]

  Refined Position:   [ source = BAT pre-slew burst ]
    RA: 76.9549962263985   Dec: -59.8160968750163  [deg; J2000]
        { 05h 07m 49.2s , -59d 48' 57.9" }
         +/- 2.29282504929483 [arcmin] (estimated 90% radius based on SNR)
         +/- 1.33196677611793 [arcmin] (formal 1-sigma fit error)
    SNR: 9.29614273088074

  Angular difference between the analysis and refined position is 4.268906 arcmin

  Partial Coding Fraction: 0.8515625    [ including projection effects ]

  Duration
     T90: 16.8319998979568 +/- 4.28417737983611
        Measured from: 1.44799995422363
                   to: 18.2799998521805     [s; relative to TRIGTIME]
     T50: 8.06399989128113 +/- 3.31937337674716
        Measured from: 3.36800003051758
                   to: 11.4319999217987     [s; relative to TRIGTIME]


  Fluence
     Peak Flux  (peak 1 second)
        Measured from: 3.34799993038177
                   to: 4.34799993038177     [s; relative to TRIGTIME]
     Total Fluence
        Measured from: 1.06400001049042
                   to: 21.095999956131     [s; relative to TRIGTIME]

             Band 1     Band 2     Band 3     Band 4
              15-25      25-50     50-100    100-350     keV
 Total     0.186133   0.280190   0.182588   0.035668
           0.036093   0.037331   0.032668   0.028881 [error]
 Peak      0.021198   0.043380   0.022376   0.007023
           0.008231   0.008613   0.007643   0.006443 [error]

     [ fluence units of on-axis counts / fully illuminated detector ]

======================================================================


====== Table of the duration information =============================

        Value   tstart    tstop
T100   20.032    1.064   21.096
T90    16.832    1.448   18.280
T50     8.064    3.368   11.432
Peak    1.000    3.348    4.348


====== Spectral Analysis Summary =====================================

Model      : spectral model: simple power-law (PL) and cutoff power-law (CPL)
Ph_index   : photon index: E^{Ph_index}
Ph_90err   : 90% error of the photon index
Epeak      : Epeak in keV
Epeak_90err: 90% error of Epeak
Norm       : normalization at 50 keV in both the PL model and CPL model
Nomr_90err : 90% error of the normalization
chi2       : Chi-Squared
dof        : degree of freedo

=== Time-averaged spectral analysis ===
(Best model with acceptable fit: PL)

Model Ph_index Ph_90err_low Ph_90err_hi  Epeak  Epeak_90err_low  Epeak_90err_hi  Norm       Nomr_90err_low    Norm_90err_hi    chi2    dof
PL      -1.529    -0.266      0.260       -           -               -         2.19e-03     -3.60e-04          3.54e-04      45.190   57
CPL     -0.842    -0.870      1.341       77.799     -28.266       -77.799      5.14e-03     -3.21e-03          2.24e-02      43.920   56


=== 1-s peak spectral analysis ===
(Best model with acceptable fit: PL)

Model Ph_index Ph_90err_low Ph_90err_hi  Epeak  Epeak_90err_low  Epeak_90err_hi  Norm       Nomr_90err_low    Norm_90err_hi    chi2    dof
PL      -1.473     -0.485     0.475       -           -               -         5.60e-03     -1.61e-03          1.58e-03      53.930   57
CPL     -1.162     -1.299     3.216      124.353    -124.353      -124.353      8.28e-03     -4.73e-03          5.75e-01      53.860   56


=== Fluence/Peak Flux Summary ===

              Model    Band1     Band2     Band3     Band4     Band5     Total
                       15-25     25-50    50-100    100-350    15-150    15-350    keV
Fluence         PL   5.75e-08  1.04e-07  1.44e-07  4.16e-07  4.14e-07  7.21e-07   erg/cm2
      90%_error_low -1.35e-08 -1.61e-08 -3.09e-08 -1.59e-07 -7.39e-08 -1.91e-07   erg/cm2
      90%_error_hi   1.41e-08  1.60e-08  3.10e-08  2.14e-07  7.55e-08  2.37e-07   erg/cm2
Peak flux       PL   2.25e-01  2.30e-01  1.66e-01  1.91e-01  6.95e-01  8.11e-01   ph/cm2/s
      90%_error_low -9.50e-02 -6.59e-02 -5.95e-02 -1.09e-01 -1.89e-01 -2.26e-01   ph/cm2/s
      90%_error_hi   1.05e-01  6.47e-02  5.88e-02  1.73e-01  1.89e-01  2.32e-01   ph/cm2/s

Fluence        CPL   5.29e-08  1.13e-07  1.46e-07  1.46e-07  3.87e-07  4.58e-07   erg/cm2
      90%_error_low -1.54e-08 -2.08e-08 -3.54e-08 -1.14e-07 -8.27e-08 -1.44e-07   erg/cm2
      90%_error_hi   1.57e-08  2.23e-08  3.43e-08  3.28e-07  8.52e-08  3.65e-07   erg/cm2
Peak flux      CPL   2.16e-01  2.39e-01  1.68e-01  1.25e-01  6.87e-01  7.47e-01   ph/cm2/s
      90%_error_low -1.09e-01 -7.40e-02 -6.34e-02 -1.25e-01 -1.97e-01 -2.52e-01   ph/cm2/s
      90%_error_hi   1.08e-01  9.49e-02  6.57e-02  1.35e-01  1.94e-01  2.88e-01   ph/cm2/s

======================================================================
Image
Pre-slew 15.0-350.0 keV image (Event data)

#   RAcent    DECcent   POSerr    Theta     Phi              Peak Cts       SNR   Name
   76.9550   -59.8161   0.0208    14.1149   -73.5724         0.6628752      9.296 TRIG_01142997

Foreground time interval of the image:
  1.064  21.096 (delta_t =  20.032 [sec])
Background time interval of the image:
-239.896   1.064 (delta_t = 240.960 [sec])
Light Curves
Note: The mask-weighted lightcurves have units of either count/det or counts/sec/det, where a det is 0.4 x 0.4 = 0.16 sq cm.
Full-time range; 1 s binning
Other quick-look light curves:
- 64 ms binning (zoomed)
- 16 ms binning (zoomed)
- 8 ms binning (zoomed)
- 2 ms binning (zoomed)
- SN=5 or 10 s binning (full-time range)
- Raw light curve
Spectra
- 64 ms binning (zoomed)
- 16 ms binning (zoomed)
- 8 ms binning (zoomed)
- 2 ms binning (zoomed)
- SN=5 or 10 s binning (full-time range)
- Raw light curve
Spectra
Notes:
- 1) The fitting includes the systematic errors.
- 2) When the burst includes telescope slew time periods, the fitting uses an average response file made from multiple 5-s response files through out the slew time plus single time preiod for the non-slew times, and weighted by the total counts in the corresponding time period using addrmf. An average response file is needed becuase a spectral fit using the pre-slew DRM will introduce some errors in both a spectral shape and a normalization if the PHA file contains a lot of the slew/post-slew time interval.
- 3) For fits to more complicated models (e.g. a power-law over a cutoff power-law), the BAT team has decided to require a chi-square improvement of more than 6 for each extra dof.
Time averaged spectrum fit using the average DRM
Power-law model

Time interval is from    1.064 sec. to   21.096 sec.

Spectral model in power-law:
------------------------------------------------------------
Parameters  : value       lower 90%   higher 90%
Photon index: -1.52876     ( -0.266231   0.259621 )
Norm@50keV  : 2.18810E-03    ( -0.000359829   0.000354413 )
------------------------------------------------------------
#Fit statistic  : Chi-Squared                   45.19     using 59 bins.
 Reduced chi-squared = 0.792807
# Null hypothesis probability of 8.71e-01 with 57 degrees of freedom

Photon flux (15-150 keV)    in 20.03 sec: 0.275335 ( -0.042158  0.042179 ) ph/cm2/s
Energy fluence (15-150 keV)             : 4.13944e-07 ( -7.38718e-08  7.55203e-08 ) ergs/cm2
Cutoff power-law model

Time interval is from    1.064 sec. to   21.096 sec.
Spectral model in the cutoff power-law:
------------------------------------------------------------
Parameters  : value       lower 90%   higher 90%
Photon index: -0.842201     ( -0.870285   1.3414 )
Epeak [keV] : 77.7986      ( -28.2658 -77.7986 )
Norm@50keV  : 5.14139E-03    ( -0.00321049   0.0224365 )
------------------------------------------------------------
#Fit statistic  : Chi-Squared                   43.92     using 59 bins.
 Reduced chi-squared = 0.784286
# Null hypothesis probability of 8.79e-01 with 56 degrees of freedom

Photon flux (15-150 keV)    in 20.03 sec: 0.268317 ( -0.043549  0.043495 ) ph/cm2/s
Energy fluence (15-150 keV)             : 3.87268e-07 ( -8.26742e-08  8.52311e-08 ) ergs/cm2
1-s peak spectrum fit
Power-law model

Time interval is from    3.348 sec. to    4.348 sec.

Spectral model in power-law:
------------------------------------------------------------
Parameters  : value       lower 90%   higher 90%
Photon index: -1.47294     ( -0.485475   0.475009 )
Norm@50keV  : 5.60322E-03    ( -0.00161278   0.00157627 )
------------------------------------------------------------
#Fit statistic  : Chi-Squared                   53.93     using 59 bins.
 Reduced chi-squared = 0.94614
# Null hypothesis probability of 5.91e-01 with 57 degrees of freedom

Photon flux (15-150 keV)    in 1 sec: 0.694553 ( -0.18927  0.189495 ) ph/cm2/s
Energy fluence (15-150 keV)             : 5.34048e-08 ( -1.658e-08  1.71668e-08 ) ergs/cm2
Cutoff power-law model

Time interval is from    3.348 sec. to    4.348 sec.
Spectral model in the cutoff power-law:
------------------------------------------------------------
Parameters  : value       lower 90%   higher 90%
Photon index: -1.16234     ( -1.29805   3.21707 )
Epeak [keV] : 124.353      ( -124.708 -124.708 )
Norm@50keV  : 8.27841E-03    ( -0.00471339   0.575383 )
------------------------------------------------------------
#Fit statistic  : Chi-Squared                   53.86     using 59 bins.
 Reduced chi-squared = 0.961786
# Null hypothesis probability of 5.56e-01 with 56 degrees of freedom

Photon flux (15-150 keV)    in 1 sec: 0.687093 ( -0.197114  0.194343 ) ph/cm2/s
Energy fluence (15-150 keV)             : 5.16904e-08 ( -2.01367e-08  1.8544e-08 ) ergs/cm2
Time-resolved spectra

Distribution
T90 vs. Hardness ratio plot
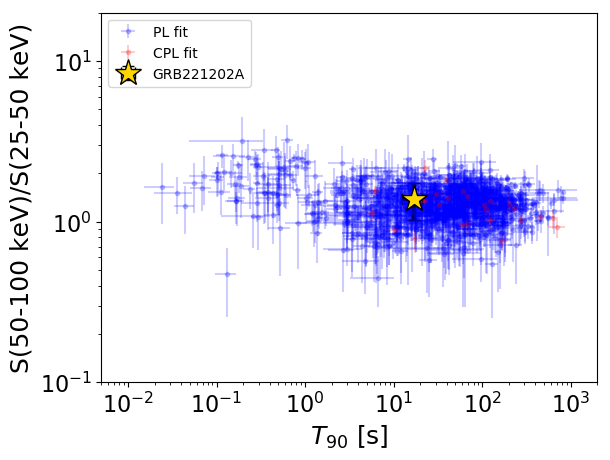
T90                                   = 16.832 sec.
Hardness ratio (energy fluence ratio) = 1.38630934032
S(15-50 keV) vs. S(50-150 keV) plot
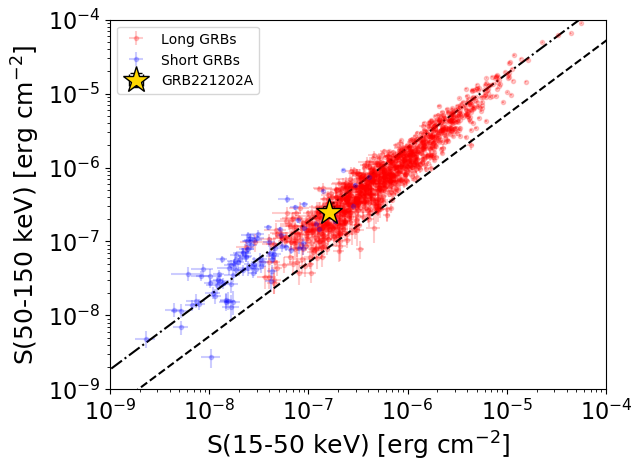
S(15-50 keV)  = 1.6130179e-07
S(50-150 keV) = 2.526429e-07
The dash-dotted line and the dashed line traces the fluences calculated from the Band function with Epeak = 15 and 150 keV, respectively. Both lines assume a canonical values of alpha = -1 and beta = -2.5.
Mask shadow pattern

IMX = 7.111350310776945E-02, IMY = 2.411941707005720E-01
Spacecraft aspect plot

Bright source in the pre-burst/pre-slew/post-slew images
Pre-burst image of 15-350 keV band
Time interval of the image:
-239.896000 1.064000

# RAcent  DECcent POSerr Theta    Phi  PeakCts   SNR AngSep     Name
#  [deg]    [deg]    ['] [deg]  [deg]                   [']
135.5477 -40.5396    2.7  39.1 -160.4   2.6444   4.3    1.3	Vela X-1
 53.9413 -12.5821    2.2  40.6   53.9   4.2202   5.4 ------	UNKNOWN
 12.1782 -26.8815    3.6  56.9    1.5   5.0635   3.2 ------	UNKNOWN
 10.1126 -32.2107    3.2  55.1   -4.9   3.2858   3.6 ------	UNKNOWN
358.1209 -57.3477    2.9  49.5  -37.8   5.3603   3.9 ------	UNKNOWN
Pre-slew background subtracted image of 15-350 keV band
Time interval of the image:
1.064000 21.096000

# RAcent  DECcent POSerr Theta    Phi  PeakCts   SNR AngSep     Name
#  [deg]    [deg]    ['] [deg]  [deg]                   [']
135.4790 -40.4093    5.2  39.1 -160.6   0.2193   2.2    9.0	Vela X-1
 76.9551 -59.8160    1.2  14.1  -73.6   0.6633   9.3 ------	UNKNOWN
150.3985 -30.0980    2.0  54.9 -163.6   1.4559   5.7 ------	UNKNOWN
 48.5006 -72.9672    2.5  30.9  -64.5   0.4817   4.7 ------	UNKNOWN
Post-slew image of 15-350 keV band
Time interval of the image:
80.804640 638.804000
640.104000 654.156000
655.104000 873.653000
875.104000 879.434300
880.104000 962.184000

# RAcent  DECcent POSerr Theta    Phi  PeakCts   SNR AngSep     Name
#  [deg]    [deg]    ['] [deg]  [deg]                   [']
135.5616 -40.5714    3.0  40.4 -173.7   7.1334   3.9    1.8	Vela X-1
170.3698 -60.6460    7.6  42.3 -128.8   3.9746   1.5    2.1	Cen X-3
356.4454 -35.6223    3.0  55.3   -4.8  10.0509   3.9 ------	UNKNOWN