Analysis Summary
Notes:
- 1) No attempt has been made to eliminate the non-significant decimal places.
- 2) This batgrbproduct analysis is done using the HEASARC data.
- 3) This batgrbproduct analysis is using the flight position for the mask-weighting calculation.
======================================================================
                  BAT GRB EVENT DATA PROCESSING REPORT
    Process Script Ver: batgrbproduct v2.48
    Process Start Time: Wed Jun 14 11:59:54 EDT 2023
             Host Name: batproc1
   Current Working Dir: /local/data/bat1/alien/Swift_3rdBATcatalog/event/batevent_reproc/trigger1144698
======================================================================

  Trigger: 01144698      Segment: 000

  BAT Trigger Time: 692882511.36   [s; MET]
      Trigger Stop: 692882512.384   [s; MET]
               UTC: 2022-12-16T11:21:20.956420    [includes UTCF correction]
       Where From?: TDRSS position message

  BAT
    RA: 326.020902229861   Dec: -34.4050890625163  [deg; J2000]

     Catalogged Source?: NO
     Point Source?:      YES
     GRB Indicated?:     YES    [ by BAT flight software ]
     Image S/N Ratio:    9.84
     Image Trigger?:     NO
     Rate S/N Ratio:     17.832554500127  [ if not an image trigger ]
     Image S/N Ratio:    9.84

  Analysis Position:   [ source = BAT ]
    RA: 326.020902229861   Dec: -34.4050890625163  [deg; J2000]

  Refined Position:   [ source = BAT pre-slew burst ]
    RA: 326.053443704494   Dec: -34.4140391251465  [deg; J2000]
        { 21h 44m 12.8s , -34d 24' 50.5" }
         +/- 1.22589283398037 [arcmin] (estimated 90% radius based on SNR)
         +/- 0.379434483945555 [arcmin] (formal 1-sigma fit error)
    SNR: 22.7382824354101

  Angular difference between the analysis and refined position is 1.697993 arcmin

  Partial Coding Fraction: 1    [ including projection effects ]

  Duration
     T90: 228.531999945641 +/- 44.2294997864093
        Measured from: -11.9960000514984
                   to: 216.535999894142     [s; relative to TRIGTIME]
     T50: 155.999999880791 +/- 4.53429804868911
        Measured from: 6.12800002098083
                   to: 162.127999901772     [s; relative to TRIGTIME]


  Fluence
     Peak Flux  (peak 1 second)
        Measured from: 0.228000044822693
                   to: 1.22800004482269     [s; relative to TRIGTIME]
     Total Fluence
        Measured from: -38.2960000038147
                   to: 267.907999992371     [s; relative to TRIGTIME]

             Band 1     Band 2     Band 3     Band 4
              15-25      25-50     50-100    100-350     keV
 Total     2.933583   3.799049   2.365710   0.391913
           0.142327   0.147923   0.129169   0.113459 [error]
 Peak      0.042749   0.091382   0.070834   0.020001
           0.009399   0.010133   0.009269   0.007382 [error]

     [ fluence units of on-axis counts / fully illuminated detector ]

======================================================================


====== Table of the duration information =============================

        Value   tstart    tstop
T100  306.204  -38.296  267.908
T90   228.532  -11.996  216.536
T50   156.000    6.128  162.128
Peak    1.000    0.228    1.228


====== Spectral Analysis Summary =====================================

Model      : spectral model: simple power-law (PL) and cutoff power-law (CPL)
Ph_index   : photon index: E^{Ph_index}
Ph_90err   : 90% error of the photon index
Epeak      : Epeak in keV
Epeak_90err: 90% error of Epeak
Norm       : normalization at 50 keV in both the PL model and CPL model
Nomr_90err : 90% error of the normalization
chi2       : Chi-Squared
dof        : degree of freedo

=== Time-averaged spectral analysis ===
(Best model with acceptable fit: CPL)

Model Ph_index Ph_90err_low Ph_90err_hi  Epeak  Epeak_90err_low  Epeak_90err_hi  Norm       Nomr_90err_low    Norm_90err_hi    chi2    dof
PL      -1.677    -0.089      0.088       -           -               -         1.93e-03     -9.82e-05          9.77e-05      57.400   57
CPL     -1.118    -0.372      0.407       76.248     -14.511        54.588      3.73e-03     -1.30e-03          2.24e-03      50.570   56


=== 1-s peak spectral analysis ===
(Best model with acceptable fit: PL)

Model Ph_index Ph_90err_low Ph_90err_hi  Epeak  Epeak_90err_low  Epeak_90err_hi  Norm       Nomr_90err_low    Norm_90err_hi    chi2    dof
PL      -1.158     -0.209     0.212       -           -               -         1.51e-02     -1.89e-03          1.89e-03      43.950   57
CPL     -0.535     -0.740     1.060      131.194     -51.502      -131.194      2.92e-02     -1.36e-02          5.64e-02      42.450   56


=== Fluence/Peak Flux Summary ===

              Model    Band1     Band2     Band3     Band4     Band5     Total
                       15-25     25-50    50-100    100-350    15-150    15-350    keV
Fluence         PL   8.89e-07  1.47e-06  1.84e-06  4.57e-06  5.47e-06  8.76e-06   erg/cm2
      90%_error_low -7.13e-08 -7.19e-08 -1.26e-07 -6.38e-07 -2.95e-07 -7.46e-07   erg/cm2
      90%_error_hi   7.30e-08  7.19e-08  1.27e-07  7.04e-07  2.97e-07  8.00e-07   erg/cm2
Peak flux       PL   4.47e-01  5.52e-01  4.95e-01  7.67e-01  1.76e+00  2.26e+00   ph/cm2/s
      90%_error_low -1.03e-01 -8.21e-02 -7.09e-02 -2.07e-01 -2.26e-01 -2.99e-01   ph/cm2/s
      90%_error_hi   1.10e-01  8.08e-02  7.00e-02  2.48e-01  2.27e-01  3.06e-01   ph/cm2/s

Fluence        CPL   8.10e-07  1.54e-06  1.87e-06  2.04e-06  5.20e-06  6.26e-06   erg/cm2
      90%_error_low -8.72e-08 -8.80e-08 -1.36e-07 -7.72e-07 -3.41e-07 -8.48e-07   erg/cm2
      90%_error_hi   8.86e-08  8.95e-08  1.37e-07  1.36e-06  3.44e-07  1.39e-06   erg/cm2
Peak flux      CPL   3.86e-01  5.76e-01  5.32e-01  4.32e-01  1.72e+00  1.93e+00   ph/cm2/s
      90%_error_low -1.29e-01 -9.12e-02 -8.78e-02 -2.30e-01 -2.34e-01 -3.43e-01   ph/cm2/s
      90%_error_hi   1.37e-01  9.39e-02  9.07e-02  4.20e-01  2.33e-01  5.00e-01   ph/cm2/s

======================================================================
Image
Pre-slew 15.0-350.0 keV image (Event data)
#   RAcent    DECcent   POSerr    Theta     Phi              Peak Cts       SNR   Name
  326.0534   -34.4140   0.0085    15.6966   -18.1638         2.9078890     22.738 TRIG_01144698

Foreground time interval of the image:
-38.296  11.741 (delta_t =  50.037 [sec])
Background time interval of the image:
-239.360 -38.296 (delta_t = 201.064 [sec])
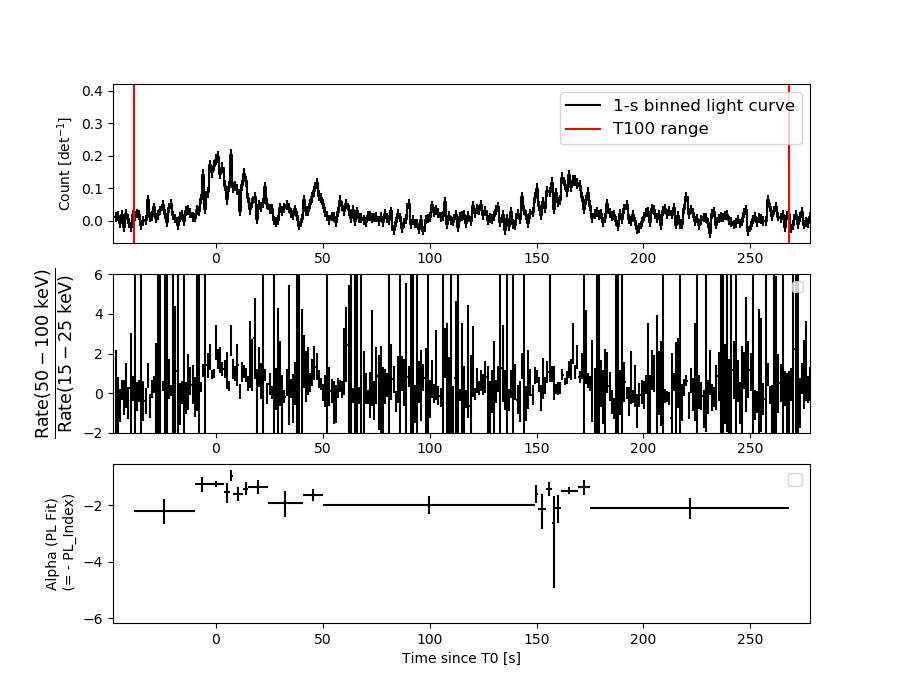
Light Curves
Note: The mask-weighted lightcurves have units of either count/det or counts/sec/det, where a det is 0.4 x 0.4 = 0.16 sq cm.
Full-time range; 1 s binning
Other quick-look light curves:
- 64 ms binning (zoomed)
- 16 ms binning (zoomed)
- 8 ms binning (zoomed)
- 2 ms binning (zoomed)
- SN=5 or 10 s binning (full-time range)
- Raw light curve
Spectra
- 64 ms binning (zoomed)
- 16 ms binning (zoomed)
- 8 ms binning (zoomed)
- 2 ms binning (zoomed)
- SN=5 or 10 s binning (full-time range)
- Raw light curve
Spectra
Notes:
- 1) The fitting includes the systematic errors.
- 2) When the burst includes telescope slew time periods, the fitting uses an average response file made from multiple 5-s response files through out the slew time plus single time preiod for the non-slew times, and weighted by the total counts in the corresponding time period using addrmf. An average response file is needed becuase a spectral fit using the pre-slew DRM will introduce some errors in both a spectral shape and a normalization if the PHA file contains a lot of the slew/post-slew time interval.
- 3) For fits to more complicated models (e.g. a power-law over a cutoff power-law), the BAT team has decided to require a chi-square improvement of more than 6 for each extra dof.
Time averaged spectrum fit using the average DRM
Power-law model
Time interval is from  -38.296 sec. to  267.908 sec.

Spectral model in power-law:
------------------------------------------------------------
Parameters  : value       lower 90%   higher 90%
Photon index: -1.67658     ( -0.0894647   0.0884508 )
Norm@50keV  : 1.92691E-03    ( -9.82413e-05   9.77392e-05 )
------------------------------------------------------------
#Fit statistic  : Chi-Squared                   57.40     using 59 bins.
 Reduced chi-squared = 1.00702
# Null hypothesis probability of 4.60e-01 with 57 degrees of freedom

Photon flux (15-150 keV)    in 306.2 sec: 0.253868 ( -0.01247  0.012489 ) ph/cm2/s
Energy fluence (15-150 keV)             : 5.4744e-06 ( -2.95167e-07  2.97322e-07 ) ergs/cm2
Cutoff power-law model
Time interval is from  -38.296 sec. to  267.908 sec.
Spectral model in the cutoff power-law:
------------------------------------------------------------
Parameters  : value       lower 90%   higher 90%
Photon index: -1.11779     ( -0.372257   0.406674 )
Epeak [keV] : 76.2478      ( -14.5114 54.5881 )
Norm@50keV  : 3.72630E-03    ( -0.00129912   0.00224334 )
------------------------------------------------------------
#Fit statistic  : Chi-Squared                   50.57     using 59 bins.
 Reduced chi-squared = 0.903036
# Null hypothesis probability of 6.80e-01 with 56 degrees of freedom

Photon flux (15-150 keV)    in 306.2 sec: 0.245440 ( -0.013582  0.013597 ) ph/cm2/s
Energy fluence (15-150 keV)             : 5.20326e-06 ( -3.40693e-07  3.43706e-07 ) ergs/cm2
1-s peak spectrum fit
Power-law model
Time interval is from    0.228 sec. to    1.228 sec.

Spectral model in power-law:
------------------------------------------------------------
Parameters  : value       lower 90%   higher 90%
Photon index: -1.15841     ( -0.209287   0.211992 )
Norm@50keV  : 1.50695E-02    ( -0.00189184   0.00189127 )
------------------------------------------------------------
#Fit statistic  : Chi-Squared                   43.95     using 59 bins.
 Reduced chi-squared = 0.771053
# Null hypothesis probability of 8.97e-01 with 57 degrees of freedom

Photon flux (15-150 keV)    in 1 sec: 1.75920 ( -0.22649  0.22691 ) ph/cm2/s
Energy fluence (15-150 keV)             : 1.5476e-07 ( -2.13311e-08  2.14619e-08 ) ergs/cm2
Cutoff power-law model
Time interval is from    0.228 sec. to    1.228 sec.
Spectral model in the cutoff power-law:
------------------------------------------------------------
Parameters  : value       lower 90%   higher 90%
Photon index: -0.534878     ( -0.740117   1.05957 )
Epeak [keV] : 131.194      ( -51.502 -131.194 )
Norm@50keV  : 2.92007E-02    ( -0.0135784   0.0564217 )
------------------------------------------------------------
#Fit statistic  : Chi-Squared                   42.45     using 59 bins.
 Reduced chi-squared = 0.758036
# Null hypothesis probability of 9.09e-01 with 56 degrees of freedom

Photon flux (15-150 keV)    in 1 sec: 1.72194 ( -0.23432  0.23305 ) ph/cm2/s
Energy fluence (15-150 keV)             : 1.50702e-07 ( -2.27138e-08  2.24789e-08 ) ergs/cm2
Time-resolved spectra
Distribution
T90 vs. Hardness ratio plot
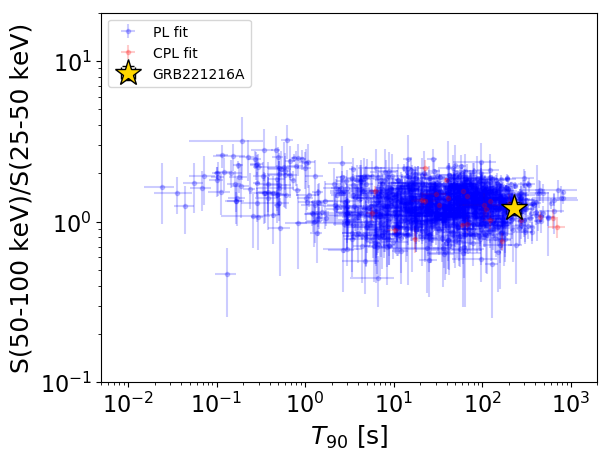
T90                                   = 228.532 sec.
Hardness ratio (energy fluence ratio) = 1.20923306514
S(15-50 keV) vs. S(50-150 keV) plot
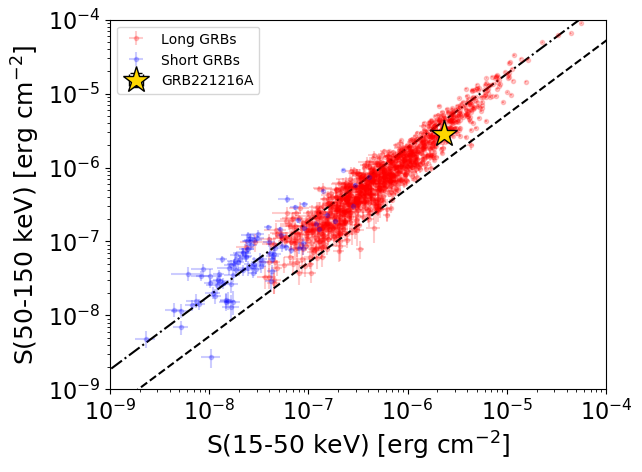
S(15-50 keV)  = 2.353793e-06
S(50-150 keV) = 2.8494014e-06
The dash-dotted line and the dashed line traces the fluences calculated from the Band function with Epeak = 15 and 150 keV, respectively. Both lines assume a canonical values of alpha = -1 and beta = -2.5.
Mask shadow pattern
IMX = 2.670204085641351E-01, IMY = 8.760484207718193E-02
Spacecraft aspect plot
Bright source in the pre-burst/pre-slew/post-slew images
Pre-burst image of 15-350 keV band
Time interval of the image:
-239.360000 -38.296000

# RAcent  DECcent POSerr Theta    Phi  PeakCts   SNR AngSep     Name
#  [deg]    [deg]    ['] [deg]  [deg]                   [']
306.6117  -1.8629    2.4  52.7  -26.6   7.8640   4.8 ------	UNKNOWN
252.3222 -59.7813    2.4  46.3 -126.3   6.5103   4.8 ------	UNKNOWN
Pre-slew background subtracted image of 15-350 keV band
Time interval of the image:
-38.296000 11.740590

# RAcent  DECcent POSerr Theta    Phi  PeakCts   SNR AngSep     Name
#  [deg]    [deg]    ['] [deg]  [deg]                   [']
326.0534 -34.4140    0.5  15.7  -18.2   2.9078  22.8 ------	UNKNOWN
Post-slew image of 15-350 keV band
Time interval of the image:
59.940600 327.940600

# RAcent  DECcent POSerr Theta    Phi  PeakCts   SNR AngSep     Name
#  [deg]    [deg]    ['] [deg]  [deg]                   [']
285.2359 -24.8363    0.0  36.5  -79.9   0.1075   0.1   12.0	HT1900.1-2455
 20.3348 -45.8088    2.7  42.2  128.7   8.0505   4.2 ------	UNKNOWN
 24.3125 -72.8575    3.8  48.1  166.4   5.3828   3.1 ------	UNKNOWN
325.9948 -34.4317    1.2   0.0 -142.2   4.6936   9.9 ------	UNKNOWN
322.1972 -28.9872    2.4   6.3  -26.0   2.2820   4.9 ------	UNKNOWN
301.7506 -21.8636    2.5  24.7  -59.8   2.7218   4.6 ------	UNKNOWN
282.0081 -63.3444    2.5  39.5 -144.6   3.3616   4.5 ------	UNKNOWN