Analysis Summary
Notes:
- 1) No attempt has been made to eliminate the non-significant decimal places.
- 2) This batgrbproduct analysis is done using the HEASARC data.
- 3) This batgrbproduct analysis is using the flight position for the mask-weighting calculation.
======================================================================
                  BAT GRB EVENT DATA PROCESSING REPORT
    Process Script Ver: batgrbproduct v2.48
    Process Start Time: Wed Jun 14 11:58:25 EDT 2023
             Host Name: batproc1
   Current Working Dir: /local/data/bat1/alien/Swift_3rdBATcatalog/event/batevent_reproc/trigger1145959
======================================================================

  Trigger: 01145959      Segment: 000

  BAT Trigger Time: 693787310.528   [s; MET]
      Trigger Stop: 693787311.04   [s; MET]
               UTC: 2022-12-26T22:41:20.062800    [includes UTCF correction]
       Where From?: TDRSS position message

  BAT
    RA: 22.9171584316979   Dec: -41.5539444002905  [deg; J2000]

     Catalogged Source?: NO
     Point Source?:      YES
     GRB Indicated?:     YES    [ by BAT flight software ]
     Image S/N Ratio:    7.7
     Image Trigger?:     NO
     Rate S/N Ratio:     17.7763888346312  [ if not an image trigger ]
     Image S/N Ratio:    7.7

  Analysis Position:   [ source = BAT ]
    RA: 22.9171584316979   Dec: -41.5539444002905  [deg; J2000]

  Refined Position:   [ source = BAT pre-slew burst ]
    RA: 22.9023487163082   Dec: -41.5142968972296  [deg; J2000]
        { 01h 31m 36.6s , -41d 30' 51.5" }
         +/- 1.23241818145184 [arcmin] (estimated 90% radius based on SNR)
         +/- 0.554740042824287 [arcmin] (formal 1-sigma fit error)
    SNR: 22.5664869929759

  Angular difference between the analysis and refined position is 2.470094 arcmin

  Partial Coding Fraction: 0.9765625    [ including projection effects ]

  Duration
     T90: 3.44000005722046 +/- 0.552405669542483
        Measured from: 0.296000003814697
                   to: 3.73600006103516     [s; relative to TRIGTIME]
     T50: 1.48800003528595 +/- 0.200479460617901
        Measured from: 0.74399995803833
                   to: 2.23199999332428     [s; relative to TRIGTIME]


  Fluence
     Peak Flux  (peak 1 second)
        Measured from: 0.236000061035156
                   to: 1.23600006103516     [s; relative to TRIGTIME]
     Total Fluence
        Measured from: 0.215999960899353
                   to: 4.27999997138977     [s; relative to TRIGTIME]

             Band 1     Band 2     Band 3     Band 4
              15-25      25-50     50-100    100-350     keV
 Total     0.184063   0.283032   0.272707   0.089580
           0.019014   0.021119   0.019582   0.015280 [error]
 Peak      0.084634   0.116117   0.108687   0.038257
           0.010292   0.011725   0.010880   0.007881 [error]

     [ fluence units of on-axis counts / fully illuminated detector ]

======================================================================


====== Table of the duration information =============================

        Value   tstart    tstop
T100    4.064    0.216    4.280
T90     3.440    0.296    3.736
T50     1.488    0.744    2.232
Peak    1.000    0.236    1.236


====== Spectral Analysis Summary =====================================

Model      : spectral model: simple power-law (PL) and cutoff power-law (CPL)
Ph_index   : photon index: E^{Ph_index}
Ph_90err   : 90% error of the photon index
Epeak      : Epeak in keV
Epeak_90err: 90% error of Epeak
Norm       : normalization at 50 keV in both the PL model and CPL model
Nomr_90err : 90% error of the normalization
chi2       : Chi-Squared
dof        : degree of freedo

=== Time-averaged spectral analysis ===
(Best model with acceptable fit: N/A)

Model Ph_index Ph_90err_low Ph_90err_hi  Epeak  Epeak_90err_low  Epeak_90err_hi  Norm       Nomr_90err_low    Norm_90err_hi    chi2    dof
PL      -1.152    -0.127      0.128       -           -               -         1.30e-02     -9.75e-04          9.75e-04      73.990   57
CPL     -0.618    -0.522      0.601      137.700     -47.047      1394.810      2.34e-02     -1.00e-02          2.11e-02      70.950   56


=== 1-s peak spectral analysis ===
(Best model with acceptable fit: PL)

Model Ph_index Ph_90err_low Ph_90err_hi  Epeak  Epeak_90err_low  Epeak_90err_hi  Norm       Nomr_90err_low    Norm_90err_hi    chi2    dof
PL      -1.256     -0.173     0.172       -           -               -         2.16e-02     -2.18e-03          2.18e-03      52.310   57
CPL     -1.077     -0.334     0.738      266.473    -266.473      -266.473      2.65e-02     -9.58e-03          3.39e-02      52.090   56


=== Fluence/Peak Flux Summary ===

              Model    Band1     Band2     Band3     Band4     Band5     Total
                       15-25     25-50    50-100    100-350    15-150    15-350    keV
Fluence         PL   4.87e-08  1.11e-07  1.99e-07  8.49e-07  5.43e-07  1.21e-06   erg/cm2
      90%_error_low -6.63e-09 -9.39e-09 -1.80e-08 -1.57e-07 -4.59e-08 -1.71e-07   erg/cm2
      90%_error_hi   6.90e-09  9.30e-09  1.79e-08  1.80e-07  4.62e-08  1.91e-07   erg/cm2
Peak flux       PL   7.03e-01  8.18e-01  6.85e-01  9.68e-01  2.55e+00  3.17e+00   ph/cm2/s
      90%_error_low -1.22e-01 -9.04e-02 -8.52e-02 -2.29e-01 -2.57e-01 -3.41e-01   ph/cm2/s
      90%_error_hi   1.28e-01  8.94e-02  8.42e-02  2.69e-01  2.57e-01  3.49e-01   ph/cm2/s

Fluence        CPL   4.38e-08  1.16e-07  2.09e-07  4.10e-07  5.24e-07  7.79e-07   erg/cm2
      90%_error_low -8.10e-09 -1.11e-08 -2.06e-08 -1.94e-07 -5.06e-08 -1.97e-07   erg/cm2
      90%_error_hi   8.27e-09  1.14e-08  2.11e-08  4.22e-07  5.03e-08  4.18e-07   erg/cm2
Peak flux      CPL   6.80e-01  8.33e-01  6.98e-01  7.79e-01  2.54e+00  2.99e+00   ph/cm2/s
      90%_error_low -1.47e-01 -1.01e-01 -9.44e-02 -4.15e-01 -2.63e-01 -5.03e-01   ph/cm2/s
      90%_error_hi   7.48e-02  1.08e-01  9.87e-02  2.97e-01  2.63e-01  5.00e-01   ph/cm2/s

======================================================================
Image
Pre-slew 15.0-350.0 keV image (Event data)
#   RAcent    DECcent   POSerr    Theta     Phi              Peak Cts       SNR   Name
   22.9023   -41.5143   0.0085    10.6179   -50.7214         0.8589798     22.566 TRIG_01145959

Foreground time interval of the image:
  0.216   4.280 (delta_t =   4.064 [sec])
Background time interval of the image:
-161.627   0.216 (delta_t = 161.843 [sec])
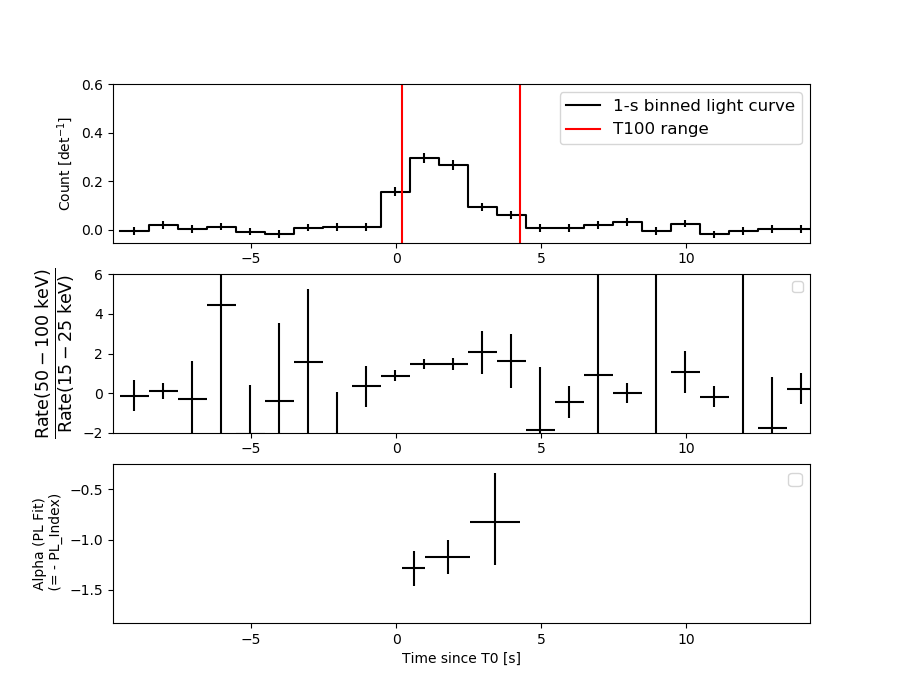
Light Curves
Note: The mask-weighted lightcurves have units of either count/det or counts/sec/det, where a det is 0.4 x 0.4 = 0.16 sq cm.
Full-time range; 1 s binning
Other quick-look light curves:
- 64 ms binning (zoomed)
- 16 ms binning (zoomed)
- 8 ms binning (zoomed)
- 2 ms binning (zoomed)
- SN=5 or 10 s binning (full-time range)
- Raw light curve
Spectra
- 64 ms binning (zoomed)
- 16 ms binning (zoomed)
- 8 ms binning (zoomed)
- 2 ms binning (zoomed)
- SN=5 or 10 s binning (full-time range)
- Raw light curve
Spectra
Notes:
- 1) The fitting includes the systematic errors.
- 2) When the burst includes telescope slew time periods, the fitting uses an average response file made from multiple 5-s response files through out the slew time plus single time preiod for the non-slew times, and weighted by the total counts in the corresponding time period using addrmf. An average response file is needed becuase a spectral fit using the pre-slew DRM will introduce some errors in both a spectral shape and a normalization if the PHA file contains a lot of the slew/post-slew time interval.
- 3) For fits to more complicated models (e.g. a power-law over a cutoff power-law), the BAT team has decided to require a chi-square improvement of more than 6 for each extra dof.
Time averaged spectrum fit using the average DRM
Power-law model
Time interval is from    0.216 sec. to    4.280 sec.

Spectral model in power-law:
------------------------------------------------------------
Parameters  : value       lower 90%   higher 90%
Photon index: -1.15211     ( -0.127387   0.128448 )
Norm@50keV  : 1.29779E-02    ( -0.000975263   0.000975233 )
------------------------------------------------------------
#Fit statistic  : Chi-Squared                   73.99     using 59 bins.
 Reduced chi-squared = 1.29807
# Null hypothesis probability of 6.47e-02 with 57 degrees of freedom

Photon flux (15-150 keV)    in 4.064 sec: 1.51387 ( -0.1156  0.11568 ) ph/cm2/s
Energy fluence (15-150 keV)             : 5.42666e-07 ( -4.59094e-08  4.62504e-08 ) ergs/cm2
Cutoff power-law model
Time interval is from    0.216 sec. to    4.280 sec.
Spectral model in the cutoff power-law:
------------------------------------------------------------
Parameters  : value       lower 90%   higher 90%
Photon index: -0.61786     ( -0.522072   0.600651 )
Epeak [keV] : 137.700      ( -47.0477 1394.81 )
Norm@50keV  : 2.34467E-02    ( -0.0100387   0.0211335 )
------------------------------------------------------------
#Fit statistic  : Chi-Squared                   70.95     using 59 bins.
 Reduced chi-squared = 1.26696
# Null hypothesis probability of 8.62e-02 with 56 degrees of freedom

Photon flux (15-150 keV)    in 4.064 sec: 1.48399 ( -0.12006  0.11957 ) ph/cm2/s
Energy fluence (15-150 keV)             : 5.24041e-07 ( -5.06131e-08  5.0266e-08 ) ergs/cm2
1-s peak spectrum fit
Power-law model
Time interval is from    0.236 sec. to    1.236 sec.

Spectral model in power-law:
------------------------------------------------------------
Parameters  : value       lower 90%   higher 90%
Photon index: -1.25609     ( -0.172547   0.172129 )
Norm@50keV  : 2.15740E-02    ( -0.00218126   0.00217583 )
------------------------------------------------------------
#Fit statistic  : Chi-Squared                   52.31     using 59 bins.
 Reduced chi-squared = 0.917719
# Null hypothesis probability of 6.51e-01 with 57 degrees of freedom

Photon flux (15-150 keV)    in 1 sec: 2.55419 ( -0.25693  0.25703 ) ph/cm2/s
Energy fluence (15-150 keV)             : 2.15591e-07 ( -2.49835e-08  2.52165e-08 ) ergs/cm2
Cutoff power-law model
Time interval is from    0.236 sec. to    1.236 sec.
Spectral model in the cutoff power-law:
------------------------------------------------------------
Parameters  : value       lower 90%   higher 90%
Photon index: -1.07674     ( -0.334045   0.738464 )
Epeak [keV] : 266.473      ( -266.481 -266.481 )
Norm@50keV  : 2.65011E-02    ( -0.00958132   0.0338703 )
------------------------------------------------------------
#Fit statistic  : Chi-Squared                   52.09     using 59 bins.
 Reduced chi-squared = 0.930179
# Null hypothesis probability of 6.24e-01 with 56 degrees of freedom

Photon flux (15-150 keV)    in 1 sec: 2.53916 ( -0.26323  0.26256 ) ph/cm2/s
Energy fluence (15-150 keV)             : 2.12966e-07 ( -2.72155e-08  2.6531e-08 ) ergs/cm2
Time-resolved spectra
Distribution
T90 vs. Hardness ratio plot
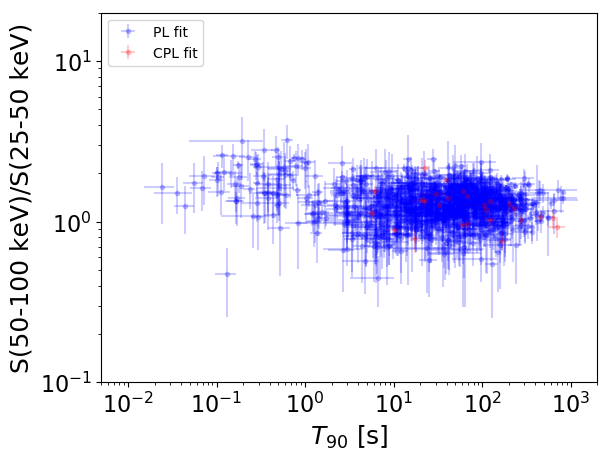
T90                                   = N/A sec.
Hardness ratio (energy fluence ratio) = N/A
S(15-50 keV) vs. S(50-150 keV) plot
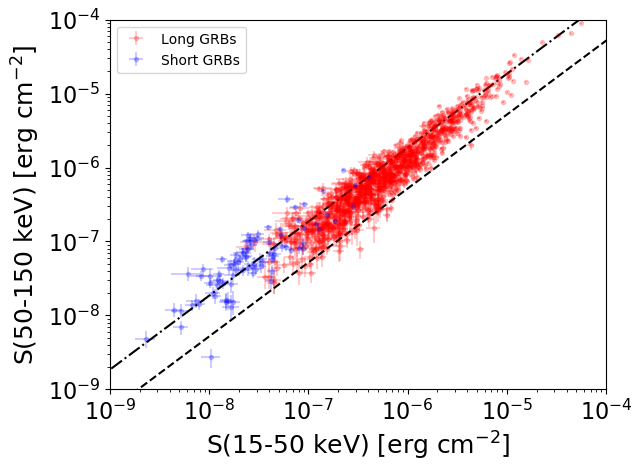
S(15-50 keV)  = N/A
S(50-150 keV) = N/A
The dash-dotted line and the dashed line traces the fluences calculated from the Band function with Epeak = 15 and 150 keV, respectively. Both lines assume a canonical values of alpha = -1 and beta = -2.5.
Mask shadow pattern
IMX = 1.186841510043655E-01, IMY = 1.451142043091031E-01
Spacecraft aspect plot
Bright source in the pre-burst/pre-slew/post-slew images
Pre-burst image of 15-350 keV band
Time interval of the image:
-161.627400 0.216000

# RAcent  DECcent POSerr Theta    Phi  PeakCts   SNR AngSep     Name
#  [deg]    [deg]    ['] [deg]  [deg]                   [']
  3.9658 -32.3666    2.3  27.7  -35.6   1.7856   5.0 ------	UNKNOWN
345.8940 -15.4882    2.5  50.8  -28.4   4.8947   4.5 ------	UNKNOWN
146.5453 -70.5649    2.0  57.7 -154.7   8.6755   5.8 ------	UNKNOWN
Pre-slew background subtracted image of 15-350 keV band
Time interval of the image:
0.216000 4.280000

# RAcent  DECcent POSerr Theta    Phi  PeakCts   SNR AngSep     Name
#  [deg]    [deg]    ['] [deg]  [deg]                   [']
 67.7287 -46.1100    2.3  22.7  160.6   0.2182   5.0 ------	UNKNOWN
 22.9024 -41.5143    0.5  10.6  -50.7   0.8590  22.6 ------	UNKNOWN
107.1881 -64.7586    2.2  45.4 -167.2   0.3390   5.2 ------	UNKNOWN
111.2711 -75.2351    2.1  46.7 -152.6   0.4473   5.4 ------	UNKNOWN
Post-slew image of 15-350 keV band
Time interval of the image:
54.972600 462.172590

# RAcent  DECcent POSerr Theta    Phi  PeakCts   SNR AngSep     Name
#  [deg]    [deg]    ['] [deg]  [deg]                   [']
 41.4340  -9.6370    3.4  35.8   61.1   5.0495   3.4 ------	UNKNOWN
 66.5024 -36.3926    2.0  33.9  124.7   7.9973   5.9 ------	UNKNOWN
 97.8441 -58.6360    3.7  48.1  166.3   8.4657   3.1 ------	UNKNOWN
 47.9225 -45.0551    2.8  18.5  138.2   3.2525   4.2 ------	UNKNOWN
 22.1448 -34.2790    2.9   7.3   23.7   2.7075   4.0 ------	UNKNOWN
359.8747  -0.0066    2.5  46.5   -3.9   4.2359   4.7    7.5	UNKNOWN
345.7522   2.2470    3.8  55.3  -18.5   6.9607   3.1 ------	UNKNOWN