Analysis Summary
Notes:
- 1) No attempt has been made to eliminate the non-significant decimal places.
- 2) This batgrbproduct analysis is done using the HEASARC data.
- 3) This batgrbproduct analysis is using the flight position for the mask-weighting calculation.
======================================================================
                  BAT GRB EVENT DATA PROCESSING REPORT
    Process Script Ver: batgrbproduct v2.48
    Process Start Time: Wed Jun 14 15:20:16 EDT 2023
             Host Name: batproc1
   Current Working Dir: /local/data/bat1/alien/Swift_3rdBATcatalog/event/batevent_reproc/trigger1149250
======================================================================

  Trigger: 01149250      Segment: 000

  BAT Trigger Time: 695576032   [s; MET]
      Trigger Stop: 695576096   [s; MET]
               UTC: 2023-01-16T15:33:21.412960    [includes UTCF correction]
       Where From?: TDRSS position message

  BAT
    RA: 223.46306794312   Dec: -16.8714844051089  [deg; J2000]

     Catalogged Source?: NO
     Point Source?:      YES
     GRB Indicated?:     YES    [ by BAT flight software ]
     Image S/N Ratio:    13.88
     Image Trigger?:     YES
     Rate S/N Ratio:     0  [ if not an image trigger ]
     Image S/N Ratio:    13.88

  Analysis Position:   [ source = BAT ]
    RA: 223.46306794312   Dec: -16.8714844051089  [deg; J2000]

  Refined Position:   [ source = BAT pre-slew burst ]
    RA: 223.467132990072   Dec: -16.8828378347964  [deg; J2000]
        { 14h 53m 52.1s , -16d 52' 58.2" }
         +/- 1.38765514586551 [arcmin] (estimated 90% radius based on SNR)
         +/- 0.753159925701396 [arcmin] (formal 1-sigma fit error)
    SNR: 19.0484227988708

  Angular difference between the analysis and refined position is 0.720080 arcmin

  Partial Coding Fraction: 0.65625    [ including projection effects ]

  Duration
     T90: 315.871999979019 +/- 53.4216859637062
        Measured from: -20.2960000038147
                   to: 295.575999975204     [s; relative to TRIGTIME]
     T50: 117.904000043869 +/- 57.7623406301486
        Measured from: 21.1599999666214
                   to: 139.06400001049     [s; relative to TRIGTIME]


  Fluence
     Peak Flux  (peak 1 second)
        Measured from: 247.707999944687
                   to: 248.707999944687     [s; relative to TRIGTIME]
     Total Fluence
        Measured from: -35.7999999523163
                   to: 346.679999947548     [s; relative to TRIGTIME]

             Band 1     Band 2     Band 3     Band 4
              15-25      25-50     50-100    100-350     keV
 Total     3.108276   3.876502   2.496329   0.609698
           0.251275   0.249853   0.216416   0.188613 [error]
 Peak      0.044973   0.040063   0.036230   0.006156
           0.014069   0.014454   0.012072   0.010814 [error]

     [ fluence units of on-axis counts / fully illuminated detector ]

======================================================================


====== Table of the duration information =============================

        Value   tstart    tstop
T100  382.480  -35.800  346.680
T90   315.872  -20.296  295.576
T50   117.904   21.160  139.064
Peak    1.000  247.708  248.708


====== Spectral Analysis Summary =====================================

Model      : spectral model: simple power-law (PL) and cutoff power-law (CPL)
Ph_index   : photon index: E^{Ph_index}
Ph_90err   : 90% error of the photon index
Epeak      : Epeak in keV
Epeak_90err: 90% error of Epeak
Norm       : normalization at 50 keV in both the PL model and CPL model
Nomr_90err : 90% error of the normalization
chi2       : Chi-Squared
dof        : degree of freedo

=== Time-averaged spectral analysis ===
(Best model with acceptable fit: PL)

Model Ph_index Ph_90err_low Ph_90err_hi  Epeak  Epeak_90err_low  Epeak_90err_hi  Norm       Nomr_90err_low    Norm_90err_hi    chi2    dof
PL      -1.733    -0.138      0.135       -           -               -         1.74e-03     -1.39e-04          1.38e-04      54.380   57
CPL     -1.559    -0.302      0.561      121.539     -61.400      -121.539      2.15e-03     -4.31e-04          2.01e-03      54.040   56


=== 1-s peak spectral analysis ===
(Best model with acceptable fit: N/A)

Model Ph_index Ph_90err_low Ph_90err_hi  Epeak  Epeak_90err_low  Epeak_90err_hi  Norm       Nomr_90err_low    Norm_90err_hi    chi2    dof
PL      -2.049     -0.755     0.590       -           -               -         6.45e-03     -3.04e-03          2.84e-03      51.190   57
CPL     -0.619     -1.535     4.323       45.721     -44.545       -45.721      3.74e-02     -3.74e-02          4.90e+00      50.200   56


=== Fluence/Peak Flux Summary ===

              Model    Band1     Band2     Band3     Band4     Band5     Total
                       15-25     25-50    50-100    100-350    15-150    15-350    keV
Fluence         PL   1.06e-06  1.69e-06  2.03e-06  4.78e-06  6.15e-06  9.56e-06   erg/cm2
      90%_error_low -1.27e-07 -1.26e-07 -2.19e-07 -1.00e-06 -5.08e-07 -1.21e-06   erg/cm2
      90%_error_hi   1.32e-07  1.26e-07  2.19e-07  1.17e-06  5.13e-07  1.33e-06   erg/cm2
Peak flux       PL   4.51e-01  3.29e-01  1.59e-01  1.09e-01  9.90e-01  1.05e+00   ph/cm2/s
      90%_error_low -2.14e-01 -1.22e-01 -8.94e-02 -1.09e-01 -3.67e-01 -3.87e-01   ph/cm2/s
      90%_error_hi   2.37e-01  1.22e-01  9.22e-02  1.52e-01  3.68e-01  3.89e-01   ph/cm2/s

Fluence        CPL   1.03e-06  1.72e-06  2.05e-06  3.59e-06  6.06e-06  8.39e-06   erg/cm2
      90%_error_low -1.51e-07 -1.49e-07 -2.26e-07 -1.95e-06 -5.75e-07 -2.05e-06   erg/cm2
      90%_error_hi   1.34e-07  1.58e-07  2.29e-07  2.72e-06  5.71e-07  1.63e-06   erg/cm2
Peak flux      CPL   3.69e-01  3.86e-01  1.78e-01  3.43e-02  9.60e-01  9.70e-01   ph/cm2/s
      90%_error_low -3.69e-01 -1.54e-01 -1.10e-01 -3.43e-02 -3.71e-01 -3.82e-01   ph/cm2/s
      90%_error_hi   2.75e-01  1.65e-01  1.20e-01  1.30e-01  3.73e-01  3.87e-01   ph/cm2/s

======================================================================
Image
Pre-slew 15.0-350.0 keV image (Event data)
#   RAcent    DECcent   POSerr    Theta     Phi              Peak Cts       SNR   Name
  223.4671   -16.8828   0.0101    30.4645    32.0511         4.9544864     19.048 TRIG_01149250

Foreground time interval of the image:
-35.800  69.901 (delta_t = 105.701 [sec])
Background time interval of the image:
-239.000 -35.800 (delta_t = 203.200 [sec])
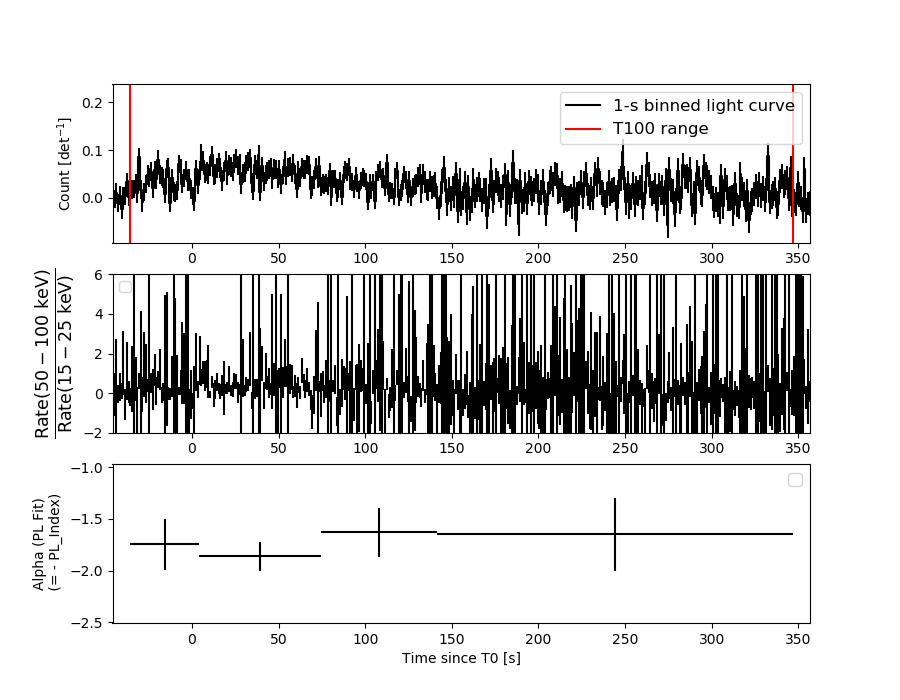
Light Curves
Note: The mask-weighted lightcurves have units of either count/det or counts/sec/det, where a det is 0.4 x 0.4 = 0.16 sq cm.
Full-time range; 1 s binning
Other quick-look light curves:
- 64 ms binning (zoomed)
- 16 ms binning (zoomed)
- 8 ms binning (zoomed)
- 2 ms binning (zoomed)
- SN=5 or 10 s binning (full-time range)
- Raw light curve
Spectra
- 64 ms binning (zoomed)
- 16 ms binning (zoomed)
- 8 ms binning (zoomed)
- 2 ms binning (zoomed)
- SN=5 or 10 s binning (full-time range)
- Raw light curve
Spectra
Notes:
- 1) The fitting includes the systematic errors.
- 2) When the burst includes telescope slew time periods, the fitting uses an average response file made from multiple 5-s response files through out the slew time plus single time preiod for the non-slew times, and weighted by the total counts in the corresponding time period using addrmf. An average response file is needed becuase a spectral fit using the pre-slew DRM will introduce some errors in both a spectral shape and a normalization if the PHA file contains a lot of the slew/post-slew time interval.
- 3) For fits to more complicated models (e.g. a power-law over a cutoff power-law), the BAT team has decided to require a chi-square improvement of more than 6 for each extra dof.
Time averaged spectrum fit using the average DRM
Power-law model

Time interval is from  -35.800 sec. to  346.680 sec.

Spectral model in power-law:
------------------------------------------------------------
Parameters  : value       lower 90%   higher 90%
Photon index: -1.73281     ( -0.137867   0.13529 )
Norm@50keV  : 1.74126E-03    ( -0.000138895   0.000137522 )
------------------------------------------------------------
#Fit statistic  : Chi-Squared                   54.38     using 59 bins.
 Reduced chi-squared = 0.954035
# Null hypothesis probability of 5.74e-01 with 57 degrees of freedom

Photon flux (15-150 keV)    in 382.5 sec: 0.233984 ( -0.0177  0.017747 ) ph/cm2/s
Energy fluence (15-150 keV)             : 6.15305e-06 ( -5.08339e-07  5.13353e-07 ) ergs/cm2
Cutoff power-law model
Time interval is from  -35.800 sec. to  346.680 sec.
Spectral model in the cutoff power-law:
------------------------------------------------------------
Parameters  : value       lower 90%   higher 90%
Photon index: -1.55859     ( -0.302475   0.561358 )
Epeak [keV] : 121.539      ( -61.4001 -121.539 )
Norm@50keV  : 2.14679E-03    ( -0.000431431   0.0020087 )
------------------------------------------------------------
#Fit statistic  : Chi-Squared                   54.04     using 59 bins.
 Reduced chi-squared = 0.965
# Null hypothesis probability of 5.49e-01 with 56 degrees of freedom

Photon flux (15-150 keV)    in 382.5 sec: 0.231865 ( -0.018755  0.018719 ) ph/cm2/s
Energy fluence (15-150 keV)             : 6.06152e-06 ( -5.75444e-07  5.70897e-07 ) ergs/cm2
1-s peak spectrum fit
Power-law model
Time interval is from  247.708 sec. to  248.708 sec.

Spectral model in power-law:
------------------------------------------------------------
Parameters  : value       lower 90%   higher 90%
Photon index: -2.04943     ( -0.755407   0.589952 )
Norm@50keV  : 6.44882E-03    ( -0.00303616   0.00284285 )
------------------------------------------------------------
#Fit statistic  : Chi-Squared                   51.19     using 59 bins.
 Reduced chi-squared = 0.89807
# Null hypothesis probability of 6.92e-01 with 57 degrees of freedom

Photon flux (15-150 keV)    in 1 sec: 0.990039 ( -0.367097  0.367611 ) ph/cm2/s
Energy fluence (15-150 keV)             : 5.96733e-08 ( -2.47705e-08  2.5859e-08 ) ergs/cm2
Cutoff power-law model
Time interval is from  247.708 sec. to  248.708 sec.
Spectral model in the cutoff power-law:
------------------------------------------------------------
Parameters  : value       lower 90%   higher 90%
Photon index: -0.618922     ( -1.52789   4.32936 )
Epeak [keV] : 45.7213      ( -44.5775 -45.7537 )
Norm@50keV  : 3.74113E-02    ( -0.0371404   4.90489 )
------------------------------------------------------------
#Fit statistic  : Chi-Squared                   50.20     using 59 bins.
 Reduced chi-squared = 0.896429
# Null hypothesis probability of 6.93e-01 with 56 degrees of freedom

Photon flux (15-150 keV)    in 1 sec: 0.959504 ( -0.37115  0.372636 ) ph/cm2/s
Energy fluence (15-150 keV)             : 5.77511e-08 ( -2.34633e-08  2.56113e-08 ) ergs/cm2
Time-resolved spectra
Distribution
T90 vs. Hardness ratio plot
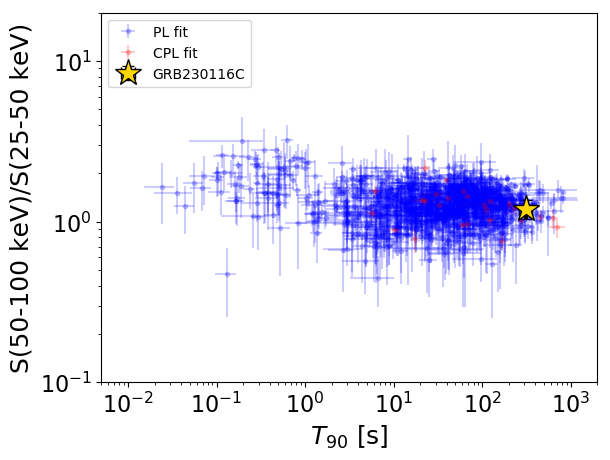
T90                                   = 315.872 sec.
Hardness ratio (energy fluence ratio) = 1.20351059072
S(15-50 keV) vs. S(50-150 keV) plot
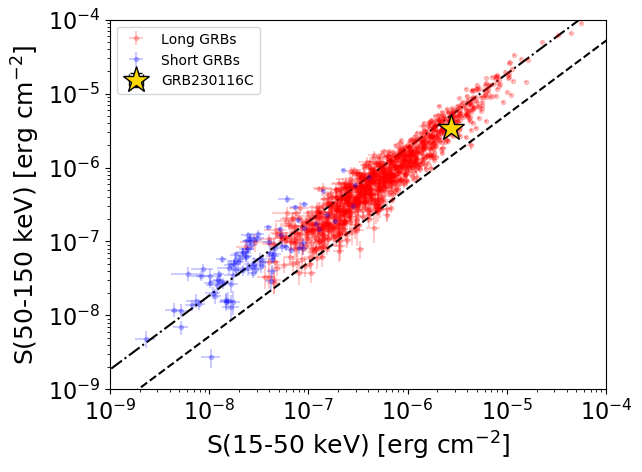
S(15-50 keV)  = 2.746634e-06
S(50-150 keV) = 3.406469e-06
The dash-dotted line and the dashed line traces the fluences calculated from the Band function with Epeak = 15 and 150 keV, respectively. Both lines assume a canonical values of alpha = -1 and beta = -2.5.
Mask shadow pattern
IMX = 4.985528199833181E-01, IMY = -3.121490077274349E-01
Spacecraft aspect plot
Bright source in the pre-burst/pre-slew/post-slew images
Pre-burst image of 15-350 keV band
Time interval of the image:
-239.000000 -35.800000

# RAcent  DECcent POSerr Theta    Phi  PeakCts   SNR AngSep     Name
#  [deg]    [deg]    ['] [deg]  [deg]                   [']
244.9690 -15.6341    0.5  18.6  -10.7   9.4730  24.4    0.7	Sco X-1
254.4635  35.3357   43.3  33.2  174.4   0.1387   0.3    0.5	Her X-1
255.8888 -37.7078    8.4  41.4  -27.5  -0.9710  -1.4    9.4	4U 1700-377
256.3642 -36.4664    3.4  40.3  -28.5   2.2399   3.4    4.3	GX 349+2
262.8304 -24.7922    8.8  31.6  -45.0  -0.7899  -1.3   10.1	GX 1+4
264.9708 -44.3563    5.0  49.9  -33.6  -3.0117  -2.3   11.3	4U 1735-44
268.4711  -1.6311    0.0  21.9  -95.3   0.9141   1.9   12.4	SW J1753.5-0127
270.3224 -25.1605    5.0  36.0  -54.4   1.6850   2.3    5.3	GX 5-1
270.1874 -25.8318    2.9  36.4  -53.5   2.9438   4.0    8.2	GRS 1758-258
274.1186 -14.1905    0.0  31.8  -73.8   1.0804   1.5   11.3	GX 17+2
276.0333 -30.2435    3.6  43.2  -54.6   3.5738   3.2    9.3	H1820-303
288.9266  11.0023    5.6  42.4 -120.0   2.5619   2.1    8.3	GRS 1915+105
262.8617 -33.9302    9.0  39.7  -37.6   0.8811   1.3    8.5	GX 354-0
214.9436 -28.9702    2.6  44.2   24.9   2.4108   4.4 ------	UNKNOWN
233.4811  18.9766    2.8  20.9  124.9   2.0033   4.2 ------	UNKNOWN
250.6310  50.8910    3.2  48.1  166.3   6.0532   3.6 ------	UNKNOWN
250.4667 -53.7199    2.6  56.6  -19.3   6.7801   4.5 ------	UNKNOWN
Pre-slew background subtracted image of 15-350 keV band
Time interval of the image:
-35.800000 69.900600

# RAcent  DECcent POSerr Theta    Phi  PeakCts   SNR AngSep     Name
#  [deg]    [deg]    ['] [deg]  [deg]                   [']
245.1194 -15.6866    7.0  18.6  -11.2   0.3341   1.6    8.5	Sco X-1
254.5951  35.3379    4.8  33.3  174.6   0.6451   2.4    6.7	Her X-1
256.1428 -37.7168    6.4  41.4  -27.8  -0.6758  -1.8   10.6	4U 1700-377
256.3746 -36.3528    8.5  40.2  -28.6  -0.4629  -1.4    5.1	GX 349+2
263.0394 -24.6685    2.9  31.6  -45.4   1.3786   4.0    4.9	GX 1+4
264.7678 -44.3774    4.0  49.8  -33.4   2.5094   2.9    4.5	4U 1735-44
268.1849  -1.5411    0.0  21.6  -95.4   0.3637   1.2   12.2	SW J1753.5-0127
270.2610 -25.0630   75.6  35.9  -54.4   0.0649   0.2    1.6	GX 5-1
270.3019 -25.7440   34.2  36.4  -53.7   0.1480   0.3    0.1	GRS 1758-258
273.9488 -14.1512   21.0  31.7  -73.7   0.2342   0.6    7.6	GX 17+2
275.8491 -30.4910   34.9  43.2  -54.2   0.2318   0.3    8.4	H1820-303
288.9603  10.9917   12.3  42.4 -120.0  -0.7650  -0.9    9.9	GRS 1915+105
263.1418 -33.8649   20.2  39.7  -38.0  -0.2400  -0.6    7.8	GX 354-0
213.6667  24.5510    2.6  38.8  110.3   2.8230   4.4 ------	UNKNOWN
223.4671 -16.8828    0.6  30.5   32.1   4.9528  19.0 ------	UNKNOWN
239.9032  18.1397    2.0  16.8  139.3   1.2689   5.8 ------	UNKNOWN
229.5978 -34.8757    2.3  41.1    5.1   1.6338   5.0 ------	UNKNOWN
267.9315 -30.2934    2.3  38.7  -46.4   2.2047   5.1 ------	UNKNOWN
Post-slew image of 15-350 keV band
Time interval of the image:
147.100600 729.500600

# RAcent  DECcent POSerr Theta    Phi  PeakCts   SNR AngSep     Name
#  [deg]    [deg]    ['] [deg]  [deg]                   [']
254.5473  35.4052   33.2  34.3 -145.4   0.4307   0.3    5.8	Her X-1
171.3962   8.6553    2.1  46.4   53.8  12.2631   5.5 ------	UNKNOWN
171.4353   5.4476    3.8  47.8   49.8   8.0689   3.0 ------	UNKNOWN
171.4109   5.8565    3.2  47.6   50.3   9.7100   3.8 ------	UNKNOWN
243.0515  68.6887    3.1  48.2  166.3  14.9854   3.8 ------	UNKNOWN
213.6688  13.9939    3.0   9.8   -3.3   3.2664   3.9 ------	UNKNOWN
244.7622  -9.4346    2.2  42.0  -68.2  14.2359   5.4 ------	UNKNOWN