Analysis Summary
Notes:
- 1) No attempt has been made to eliminate the non-significant decimal places.
- 2) This batgrbproduct analysis is done using the HEASARC data.
- 3) This batgrbproduct analysis is using the flight position for the mask-weighting calculation.
======================================================================
                  BAT GRB EVENT DATA PROCESSING REPORT
    Process Script Ver: batgrbproduct v2.48
    Process Start Time: Wed Jun 14 15:19:03 EDT 2023
             Host Name: batproc1
   Current Working Dir: /local/data/bat1/alien/Swift_3rdBATcatalog/event/batevent_reproc/trigger1149293
======================================================================

  Trigger: 01149293      Segment: 000

  BAT Trigger Time: 695595913.856   [s; MET]
      Trigger Stop: 695595926.016   [s; MET]
               UTC: 2023-01-16T21:04:43.267620    [includes UTCF correction]
       Where From?: TDRSS position message

  BAT
    RA: 98.5941375765579   Dec: 49.840140677662  [deg; J2000]

     Catalogged Source?: NO
     Point Source?:      YES
     GRB Indicated?:     YES    [ by BAT flight software ]
     Image S/N Ratio:    10.08
     Image Trigger?:     NO
     Rate S/N Ratio:     14.1067359796659  [ if not an image trigger ]
     Image S/N Ratio:    10.08

  Analysis Position:   [ source = BAT ]
    RA: 98.5941375765579   Dec: 49.840140677662  [deg; J2000]

  Refined Position:   [ source = BAT pre-slew burst ]
    RA: 98.5712442257505   Dec: 49.8440254116627  [deg; J2000]
        { 06h 34m 17.1s , +49d 50' 38.5" }
         +/- 1.94162438879087 [arcmin] (estimated 90% radius based on SNR)
         +/- 0.702706689944712 [arcmin] (formal 1-sigma fit error)
    SNR: 11.7883706388317

  Angular difference between the analysis and refined position is 0.915982 arcmin

  Partial Coding Fraction: 0.984375    [ including projection effects ]

  Duration
     T90: 41 +/- 11.1803398874989
        Measured from: 2.14400005340576
                   to: 43.1440000534058     [s; relative to TRIGTIME]
     T50: 16 +/- 8.24621125123532
        Measured from: 7.14400005340576
                   to: 23.1440000534058     [s; relative to TRIGTIME]


  Fluence
     Peak Flux  (peak 1 second)
        Measured from: 12.1440000534058
                   to: 13.1440000534058     [s; relative to TRIGTIME]
     Total Fluence
        Measured from: 1.14400005340576
                   to: 53.1440000534058     [s; relative to TRIGTIME]

             Band 1     Band 2     Band 3     Band 4
              15-25      25-50     50-100    100-350     keV
 Total     0.286286   0.566947   0.370859   0.108004
           0.059872   0.061517   0.052637   0.043739 [error]
 Peak      0.011354   0.031786   0.021491   0.009722
           0.008472   0.008987   0.007402   0.006051 [error]

     [ fluence units of on-axis counts / fully illuminated detector ]

======================================================================


====== Table of the duration information =============================

        Value   tstart    tstop
T100   52.000    1.144   53.144
T90    41.000    2.144   43.144
T50    16.000    7.144   23.144
Peak    1.000   12.144   13.144


====== Spectral Analysis Summary =====================================

Model      : spectral model: simple power-law (PL) and cutoff power-law (CPL)
Ph_index   : photon index: E^{Ph_index}
Ph_90err   : 90% error of the photon index
Epeak      : Epeak in keV
Epeak_90err: 90% error of Epeak
Norm       : normalization at 50 keV in both the PL model and CPL model
Nomr_90err : 90% error of the normalization
chi2       : Chi-Squared
dof        : degree of freedo

=== Time-averaged spectral analysis ===
(Best model with acceptable fit: PL)

Model Ph_index Ph_90err_low Ph_90err_hi  Epeak  Epeak_90err_low  Epeak_90err_hi  Norm       Nomr_90err_low    Norm_90err_hi    chi2    dof
PL      -1.385    -0.220      0.221       -           -               -         1.61e-03     -2.16e-04          2.15e-04      53.890   57
CPL     -0.577    -0.508      1.260       82.742     -27.254       -82.742      4.34e-03     -4.34e-03          1.61e-02      51.850   56


=== 1-s peak spectral analysis ===
(Best model with acceptable fit: PL)

Model Ph_index Ph_90err_low Ph_90err_hi  Epeak  Epeak_90err_low  Epeak_90err_hi  Norm       Nomr_90err_low    Norm_90err_hi    chi2    dof
PL      -1.451     -0.620     0.579       -           -               -         4.26e-03     -1.58e-03          1.54e-03      51.100   57
CPL      1.215     -3.419    -1.215       63.155     -15.458       -63.155      7.83e-02     -7.83e-02          2.33e+03      49.630   56


=== Fluence/Peak Flux Summary ===

              Model    Band1     Band2     Band3     Band4     Band5     Total
                       15-25     25-50    50-100    100-350    15-150    15-350    keV
Fluence         PL   9.61e-08  1.89e-07  2.90e-07  9.71e-07  8.13e-07  1.55e-06   erg/cm2
      90%_error_low -2.06e-08 -2.63e-08 -4.93e-08 -3.06e-07 -1.21e-07 -3.53e-07   erg/cm2
      90%_error_hi   2.16e-08  2.60e-08  4.91e-08  3.93e-07  1.22e-07  4.24e-07   erg/cm2
Peak flux       PL   1.67e-01  1.73e-01  1.27e-01  1.49e-01  5.25e-01  6.17e-01   ph/cm2/s
      90%_error_low -8.78e-02 -6.59e-02 -5.70e-02 -9.97e-02 -1.88e-01 -2.23e-01   ph/cm2/s
      90%_error_hi   1.02e-01  6.45e-02  5.54e-02  1.65e-01  1.89e-01  2.27e-01   ph/cm2/s

Fluence        CPL   8.67e-08  2.09e-07  2.97e-07  2.96e-07  7.50e-07  8.89e-07   erg/cm2
      90%_error_low -2.38e-08 -3.48e-08 -5.72e-08 -2.18e-07 -1.42e-07 -2.60e-07   erg/cm2
      90%_error_hi   2.44e-08  3.74e-08  5.54e-08  7.81e-07  1.44e-07  8.18e-07   erg/cm2
Peak flux      CPL   8.75e-02  2.03e-01  1.57e-01  2.57e-02  4.70e-01  4.74e-01   ph/cm2/s
      90%_error_low -8.75e-02 -9.65e-02 -7.33e-02 -2.57e-02 -2.23e-01 -2.26e-01   ph/cm2/s
      90%_error_hi   1.49e-01  9.28e-02  7.86e-02  1.72e-01  2.12e-01  2.77e-01   ph/cm2/s

======================================================================
Image
Pre-slew 15.0-350.0 keV image (Event data)
#   RAcent    DECcent   POSerr    Theta     Phi              Peak Cts       SNR   Name
   98.5712    49.8440   0.0163    10.6025   132.3715         1.4034154     11.788 TRIG_01149293

Foreground time interval of the image:
  1.144  53.144 (delta_t =  52.000 [sec])
Background time interval of the image:
-239.856   1.144 (delta_t = 241.000 [sec])
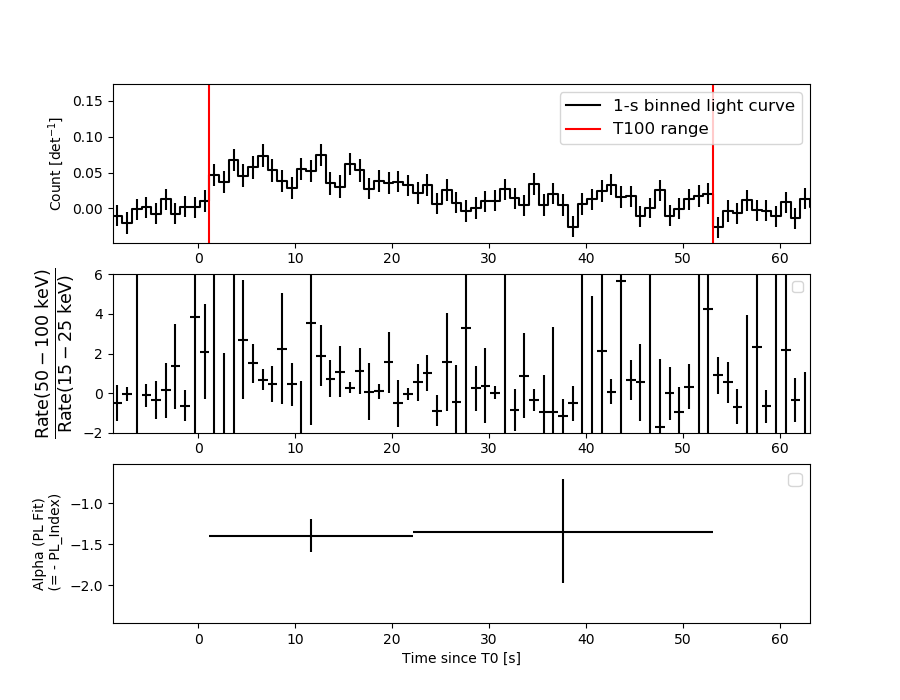
Light Curves
Note: The mask-weighted lightcurves have units of either count/det or counts/sec/det, where a det is 0.4 x 0.4 = 0.16 sq cm.
Full-time range; 1 s binning
Other quick-look light curves:
- 64 ms binning (zoomed)
- 16 ms binning (zoomed)
- 8 ms binning (zoomed)
- 2 ms binning (zoomed)
- SN=5 or 10 s binning (full-time range)
- Raw light curve
Spectra
- 64 ms binning (zoomed)
- 16 ms binning (zoomed)
- 8 ms binning (zoomed)
- 2 ms binning (zoomed)
- SN=5 or 10 s binning (full-time range)
- Raw light curve
Spectra
Notes:
- 1) The fitting includes the systematic errors.
- 2) When the burst includes telescope slew time periods, the fitting uses an average response file made from multiple 5-s response files through out the slew time plus single time preiod for the non-slew times, and weighted by the total counts in the corresponding time period using addrmf. An average response file is needed becuase a spectral fit using the pre-slew DRM will introduce some errors in both a spectral shape and a normalization if the PHA file contains a lot of the slew/post-slew time interval.
- 3) For fits to more complicated models (e.g. a power-law over a cutoff power-law), the BAT team has decided to require a chi-square improvement of more than 6 for each extra dof.
Time averaged spectrum fit using the average DRM
Power-law model
Time interval is from    1.144 sec. to   53.144 sec.

Spectral model in power-law:
------------------------------------------------------------
Parameters  : value       lower 90%   higher 90%
Photon index: -1.38497     ( -0.219852   0.220555 )
Norm@50keV  : 1.61197E-03    ( -0.000216061   0.000215091 )
------------------------------------------------------------
#Fit statistic  : Chi-Squared                   53.89     using 59 bins.
 Reduced chi-squared = 0.945439
# Null hypothesis probability of 5.92e-01 with 57 degrees of freedom

Photon flux (15-150 keV)    in 52 sec: 0.195652 ( -0.025943  0.025971 ) ph/cm2/s
Energy fluence (15-150 keV)             : 8.12594e-07 ( -1.20741e-07  1.22496e-07 ) ergs/cm2
Cutoff power-law model
Time interval is from    1.144 sec. to   53.144 sec.
Spectral model in the cutoff power-law:
------------------------------------------------------------
Parameters  : value       lower 90%   higher 90%
Photon index: -0.576979     ( -0.508536   1.2597 )
Epeak [keV] : 82.7418      ( -27.246 -82.7335 )
Norm@50keV  : 4.34290E-03    ( -0.00434374   0.0160926 )
------------------------------------------------------------
#Fit statistic  : Chi-Squared                   51.85     using 59 bins.
 Reduced chi-squared = 0.925893
# Null hypothesis probability of 6.33e-01 with 56 degrees of freedom

Photon flux (15-150 keV)    in 52 sec: 0.189779 ( -0.027107  0.026983 ) ph/cm2/s
Energy fluence (15-150 keV)             : 7.50334e-07 ( -1.42026e-07  1.43698e-07 ) ergs/cm2
1-s peak spectrum fit
Power-law model
Time interval is from   12.144 sec. to   13.144 sec.

Spectral model in power-law:
------------------------------------------------------------
Parameters  : value       lower 90%   higher 90%
Photon index: -1.45137     ( -0.620522   0.578574 )
Norm@50keV  : 4.26174E-03    ( -0.00157623   0.00154214 )
------------------------------------------------------------
#Fit statistic  : Chi-Squared                   51.10     using 59 bins.
 Reduced chi-squared = 0.896491
# Null hypothesis probability of 6.95e-01 with 57 degrees of freedom

Photon flux (15-150 keV)    in 1 sec: 0.525389 ( -0.188124  0.188626 ) ph/cm2/s
Energy fluence (15-150 keV)             : 4.07774e-08 ( -1.60317e-08  1.64442e-08 ) ergs/cm2
Cutoff power-law model
Time interval is from   12.144 sec. to   13.144 sec.
Spectral model in the cutoff power-law:
------------------------------------------------------------
Parameters  : value       lower 90%   higher 90%
Photon index: 1.21474     ( -3.49079   -1.28643 )
Epeak [keV] : 63.1553      ( -15.0874 -62.7842 )
Norm@50keV  : 7.83051E-02    ( -0.091093   2326.4 )
------------------------------------------------------------
#Fit statistic  : Chi-Squared                   49.63     using 59 bins.
 Reduced chi-squared = 0.88625
# Null hypothesis probability of 7.13e-01 with 56 degrees of freedom

Photon flux (15-150 keV)    in 1 sec: 0.469914 ( -0.222649  0.21179 ) ph/cm2/s
Energy fluence (15-150 keV)             : 3.61352e-08 ( -1.72179e-08  1.79004e-08 ) ergs/cm2
Time-resolved spectra
Distribution
T90 vs. Hardness ratio plot
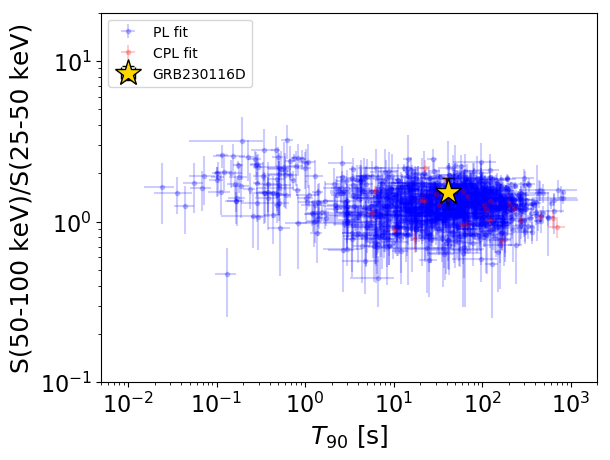
T90                                   = 41.0 sec.
Hardness ratio (energy fluence ratio) = 1.53168632928
S(15-50 keV) vs. S(50-150 keV) plot
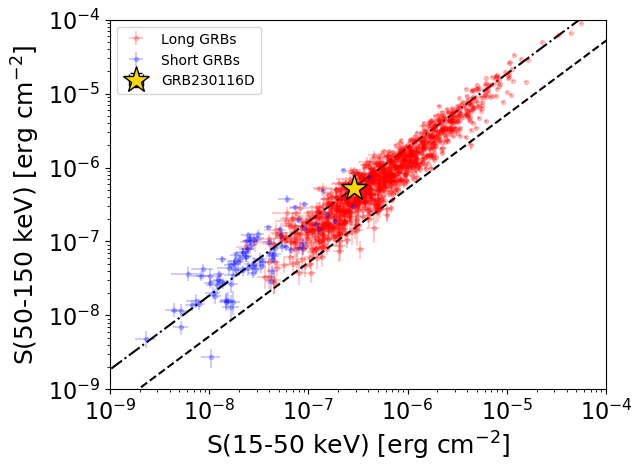
S(15-50 keV)  = 2.855713e-07
S(50-150 keV) = 5.270224e-07
The dash-dotted line and the dashed line traces the fluences calculated from the Band function with Epeak = 15 and 150 keV, respectively. Both lines assume a canonical values of alpha = -1 and beta = -2.5.
Mask shadow pattern
IMX = -1.261539998935572E-01, IMY = -1.382944636345954E-01
Spacecraft aspect plot
Bright source in the pre-burst/pre-slew/post-slew images
Pre-burst image of 15-350 keV band
Time interval of the image:
-239.856000 1.144000

# RAcent  DECcent POSerr Theta    Phi  PeakCts   SNR AngSep     Name
#  [deg]    [deg]    ['] [deg]  [deg]                   [']
 83.6486  21.9700    2.2  40.8  134.3   8.2212   5.2    2.8	Crab
119.0579  22.0036    3.2  38.0   81.7   5.2599   3.7 ------	UNKNOWN
 70.3296  44.4882    1.7  26.7  172.8   3.5412   6.8 ------	UNKNOWN
 43.1979  43.1471    2.7  41.5 -163.8   3.1769   4.2 ------	UNKNOWN
206.6215  50.5283    3.3  52.3  -28.3   7.4601   3.5 ------	UNKNOWN
227.2853  86.6905    3.4  32.7  -75.4   2.5607   3.5 ------	UNKNOWN
Pre-slew background subtracted image of 15-350 keV band
Time interval of the image:
1.144000 53.144000

# RAcent  DECcent POSerr Theta    Phi  PeakCts   SNR AngSep     Name
#  [deg]    [deg]    ['] [deg]  [deg]                   [']
 83.6844  22.1701    6.0  40.6  134.3   0.6250   1.9    9.8	Crab
141.3476  19.5050    2.6  46.5   52.9   2.3579   4.5 ------	UNKNOWN
 98.5712  49.8440    1.0  10.6  132.4   1.4036  11.8 ------	UNKNOWN
Post-slew image of 15-350 keV band
Time interval of the image:
112.044600 962.214600

# RAcent  DECcent POSerr Theta    Phi  PeakCts   SNR AngSep     Name
#  [deg]    [deg]    ['] [deg]  [deg]                   [']
 83.6297  21.9929    0.6  30.3  154.3  34.4477  18.1    1.3	Crab
128.4274  16.9825    2.1  40.7   79.1  42.7499   5.6 ------	UNKNOWN
 70.2868  44.5143    1.6  19.8 -148.8   9.9904   7.3 ------	UNKNOWN